 Explore
 Validate
 Learn
Learn Other assay
Antibody data
- Antibody Data
- Antigen structure
- References [11]
- Comments [0]
- Validations
- Other assay [15]
Submit
Validation data
Reference
Comment
Report error
- Product number
- 16-0809-050 - Provider product page

- Provider
- Invitrogen Antibodies
- Product name
- CD80 (B7-1) Monoclonal Antibody (2D10.4), Functional Grade, eBioscience™
- Antibody type
- Monoclonal
- Antigen
- Other
- Description
- Description: The 2D10.4 monoclonal antibody reacts with human CD80 (B7-1), a 60 kDa member of the Ig superfamily. CD80 is expressed by activated B cells, macrophages and dendritic cells. In addition, activated T cells express this antigen. CD80 has high affinity for binding to two T cell surface antigens, CD28 and CD152 (CTLA-4). The interaction of CD28 and CD152 with CD80 is crucial in T-B cell communication leading to activation of T and B cells, respectively.
- Antibody clone number
- 2D10.4
- Concentration
- 1 mg/mL
Submitted references Macrophage Membrane-Camouflaged shRNA and Doxorubicin: A pH-Dependent Release System for Melanoma Chemo-Immunotherapy.
B cell-intrinsic changes with age do not impact antibody-secreting cell formation but delay B cell participation in the germinal centre reaction.
Different Induction of PD-L1 (CD274) and PD-1 (CD279) Expression in THP-1-Differentiated Types 1 and 2 Macrophages.
Response of human macrophages to gamma radiation is mediated via expression of endogenous retroviruses.
Recombinant human IL-37 inhibited endometriosis development in a mouse model through increasing Th1/Th2 ratio by inducing the maturation of dendritic cells.
Astragalus polysaccharides (PG2) Enhances the M1 Polarization of Macrophages, Functional Maturation of Dendritic Cells, and T Cell-Mediated Anticancer Immune Responses in Patients with Lung Cancer.
Photodynamic therapy reduces the inhibitory effect of osteosarcoma cells on dendritic cells by upregulating HSP70.
A DNA vaccine encoding mutated HPV58 mE6E7-Fc-GPI fusion antigen and GM-CSF and B7.1.
Endothelial microparticles interact with and support the proliferation of T cells.
Phagocytosis, a potential mechanism for myeloid-derived suppressor cell regulation of CD8+ T cell function mediated through programmed cell death-1 and programmed cell death-1 ligand interaction.
Renal allograft rejection is prevented by adoptive transfer of anergic T cells in nonhuman primates.
Yang C, Ming Y, Zhou K, Hao Y, Hu D, Chu B, He X, Yang Y, Qian Z
Research (Washington, D.C.) 2022;2022:9768687
Research (Washington, D.C.) 2022;2022:9768687
B cell-intrinsic changes with age do not impact antibody-secreting cell formation but delay B cell participation in the germinal centre reaction.
Lee JL, Fra-Bido SC, Burton AR, Innocentin S, Hill DL, Linterman MA
Aging cell 2022 Sep;21(9):e13692
Aging cell 2022 Sep;21(9):e13692
Different Induction of PD-L1 (CD274) and PD-1 (CD279) Expression in THP-1-Differentiated Types 1 and 2 Macrophages.
Lai CY, Tseng PC, Chen CL, Satria RD, Wang YT, Lin CF
Journal of inflammation research 2021;14:5241-5249
Journal of inflammation research 2021;14:5241-5249
Response of human macrophages to gamma radiation is mediated via expression of endogenous retroviruses.
Mikhalkevich N, O'Carroll IP, Tkavc R, Lund K, Sukumar G, Dalgard CL, Johnson KR, Li W, Wang T, Nath A, Iordanskiy S
PLoS pathogens 2021 Feb;17(2):e1009305
PLoS pathogens 2021 Feb;17(2):e1009305
Recombinant human IL-37 inhibited endometriosis development in a mouse model through increasing Th1/Th2 ratio by inducing the maturation of dendritic cells.
Li L, Liao Z, Ye M, Jiang J
Reproductive biology and endocrinology : RB&E 2021 Aug 24;19(1):128
Reproductive biology and endocrinology : RB&E 2021 Aug 24;19(1):128
Astragalus polysaccharides (PG2) Enhances the M1 Polarization of Macrophages, Functional Maturation of Dendritic Cells, and T Cell-Mediated Anticancer Immune Responses in Patients with Lung Cancer.
Bamodu OA, Kuo KT, Wang CH, Huang WC, Wu ATH, Tsai JT, Lee KY, Yeh CT, Wang LS
Nutrients 2019 Sep 20;11(10)
Nutrients 2019 Sep 20;11(10)
Photodynamic therapy reduces the inhibitory effect of osteosarcoma cells on dendritic cells by upregulating HSP70.
Zhang F, Zhu Y, Fan G, Hu S
Oncology letters 2018 Oct;16(4):5034-5040
Oncology letters 2018 Oct;16(4):5034-5040
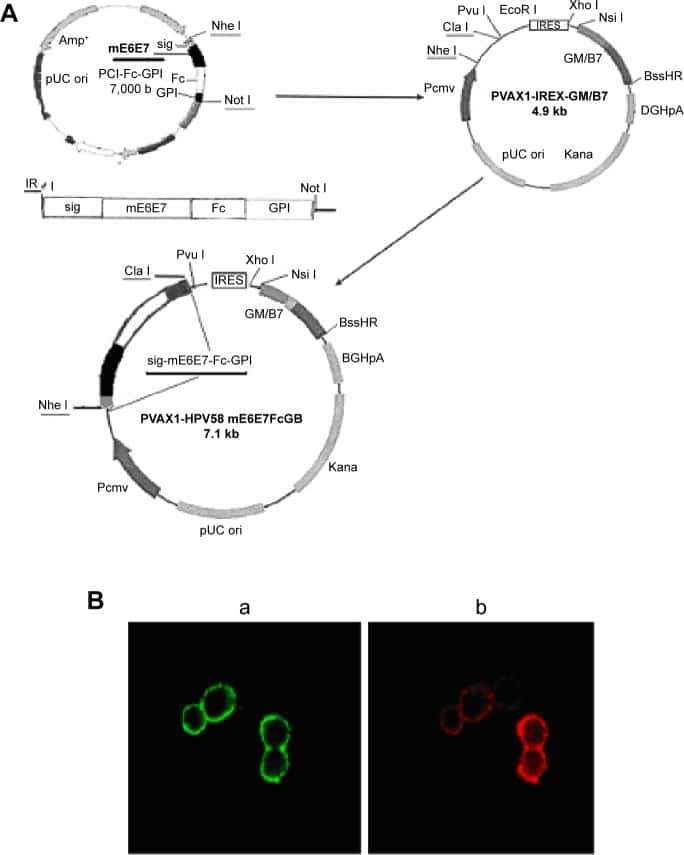
A DNA vaccine encoding mutated HPV58 mE6E7-Fc-GPI fusion antigen and GM-CSF and B7.1.
Wang H, Yu J, Li L
OncoTargets and therapy 2015;8:3067-77
OncoTargets and therapy 2015;8:3067-77
Endothelial microparticles interact with and support the proliferation of T cells.
Wheway J, Latham SL, Combes V, Grau GE
Journal of immunology (Baltimore, Md. : 1950) 2014 Oct 1;193(7):3378-87
Journal of immunology (Baltimore, Md. : 1950) 2014 Oct 1;193(7):3378-87
Phagocytosis, a potential mechanism for myeloid-derived suppressor cell regulation of CD8+ T cell function mediated through programmed cell death-1 and programmed cell death-1 ligand interaction.
Kim YJ, Park SJ, Broxmeyer HE
Journal of immunology (Baltimore, Md. : 1950) 2011 Sep 1;187(5):2291-301
Journal of immunology (Baltimore, Md. : 1950) 2011 Sep 1;187(5):2291-301
Renal allograft rejection is prevented by adoptive transfer of anergic T cells in nonhuman primates.
Bashuda H, Kimikawa M, Seino K, Kato Y, Ono F, Shimizu A, Yagita H, Teraoka S, Okumura K
The Journal of clinical investigation 2005 Jul;115(7):1896-902
The Journal of clinical investigation 2005 Jul;115(7):1896-902
No comments: Submit comment
Supportive validation
- Submitted by
- Invitrogen Antibodies (provider)
- Main image

- Experimental details
- NULL
- Submitted by
- Invitrogen Antibodies (provider)
- Main image
- Experimental details
- NULL
- Submitted by
- Invitrogen Antibodies (provider)
- Main image

- Experimental details
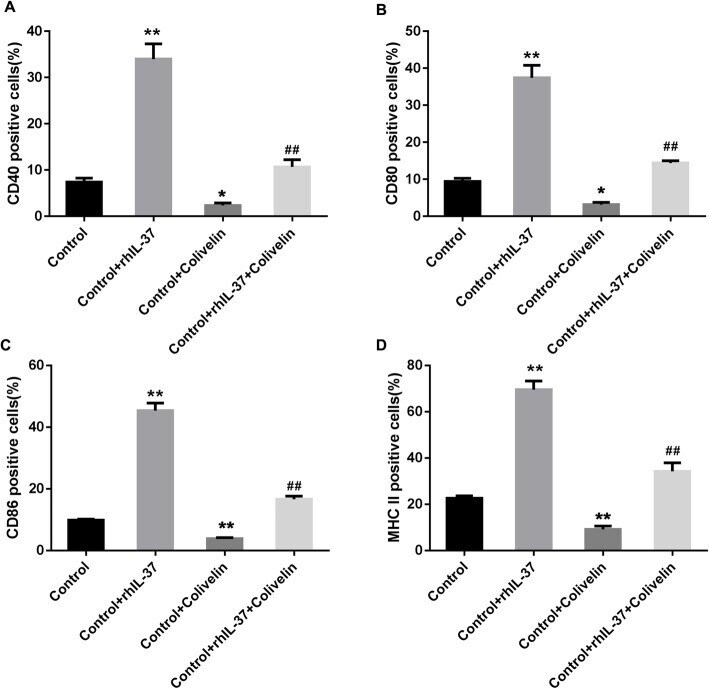
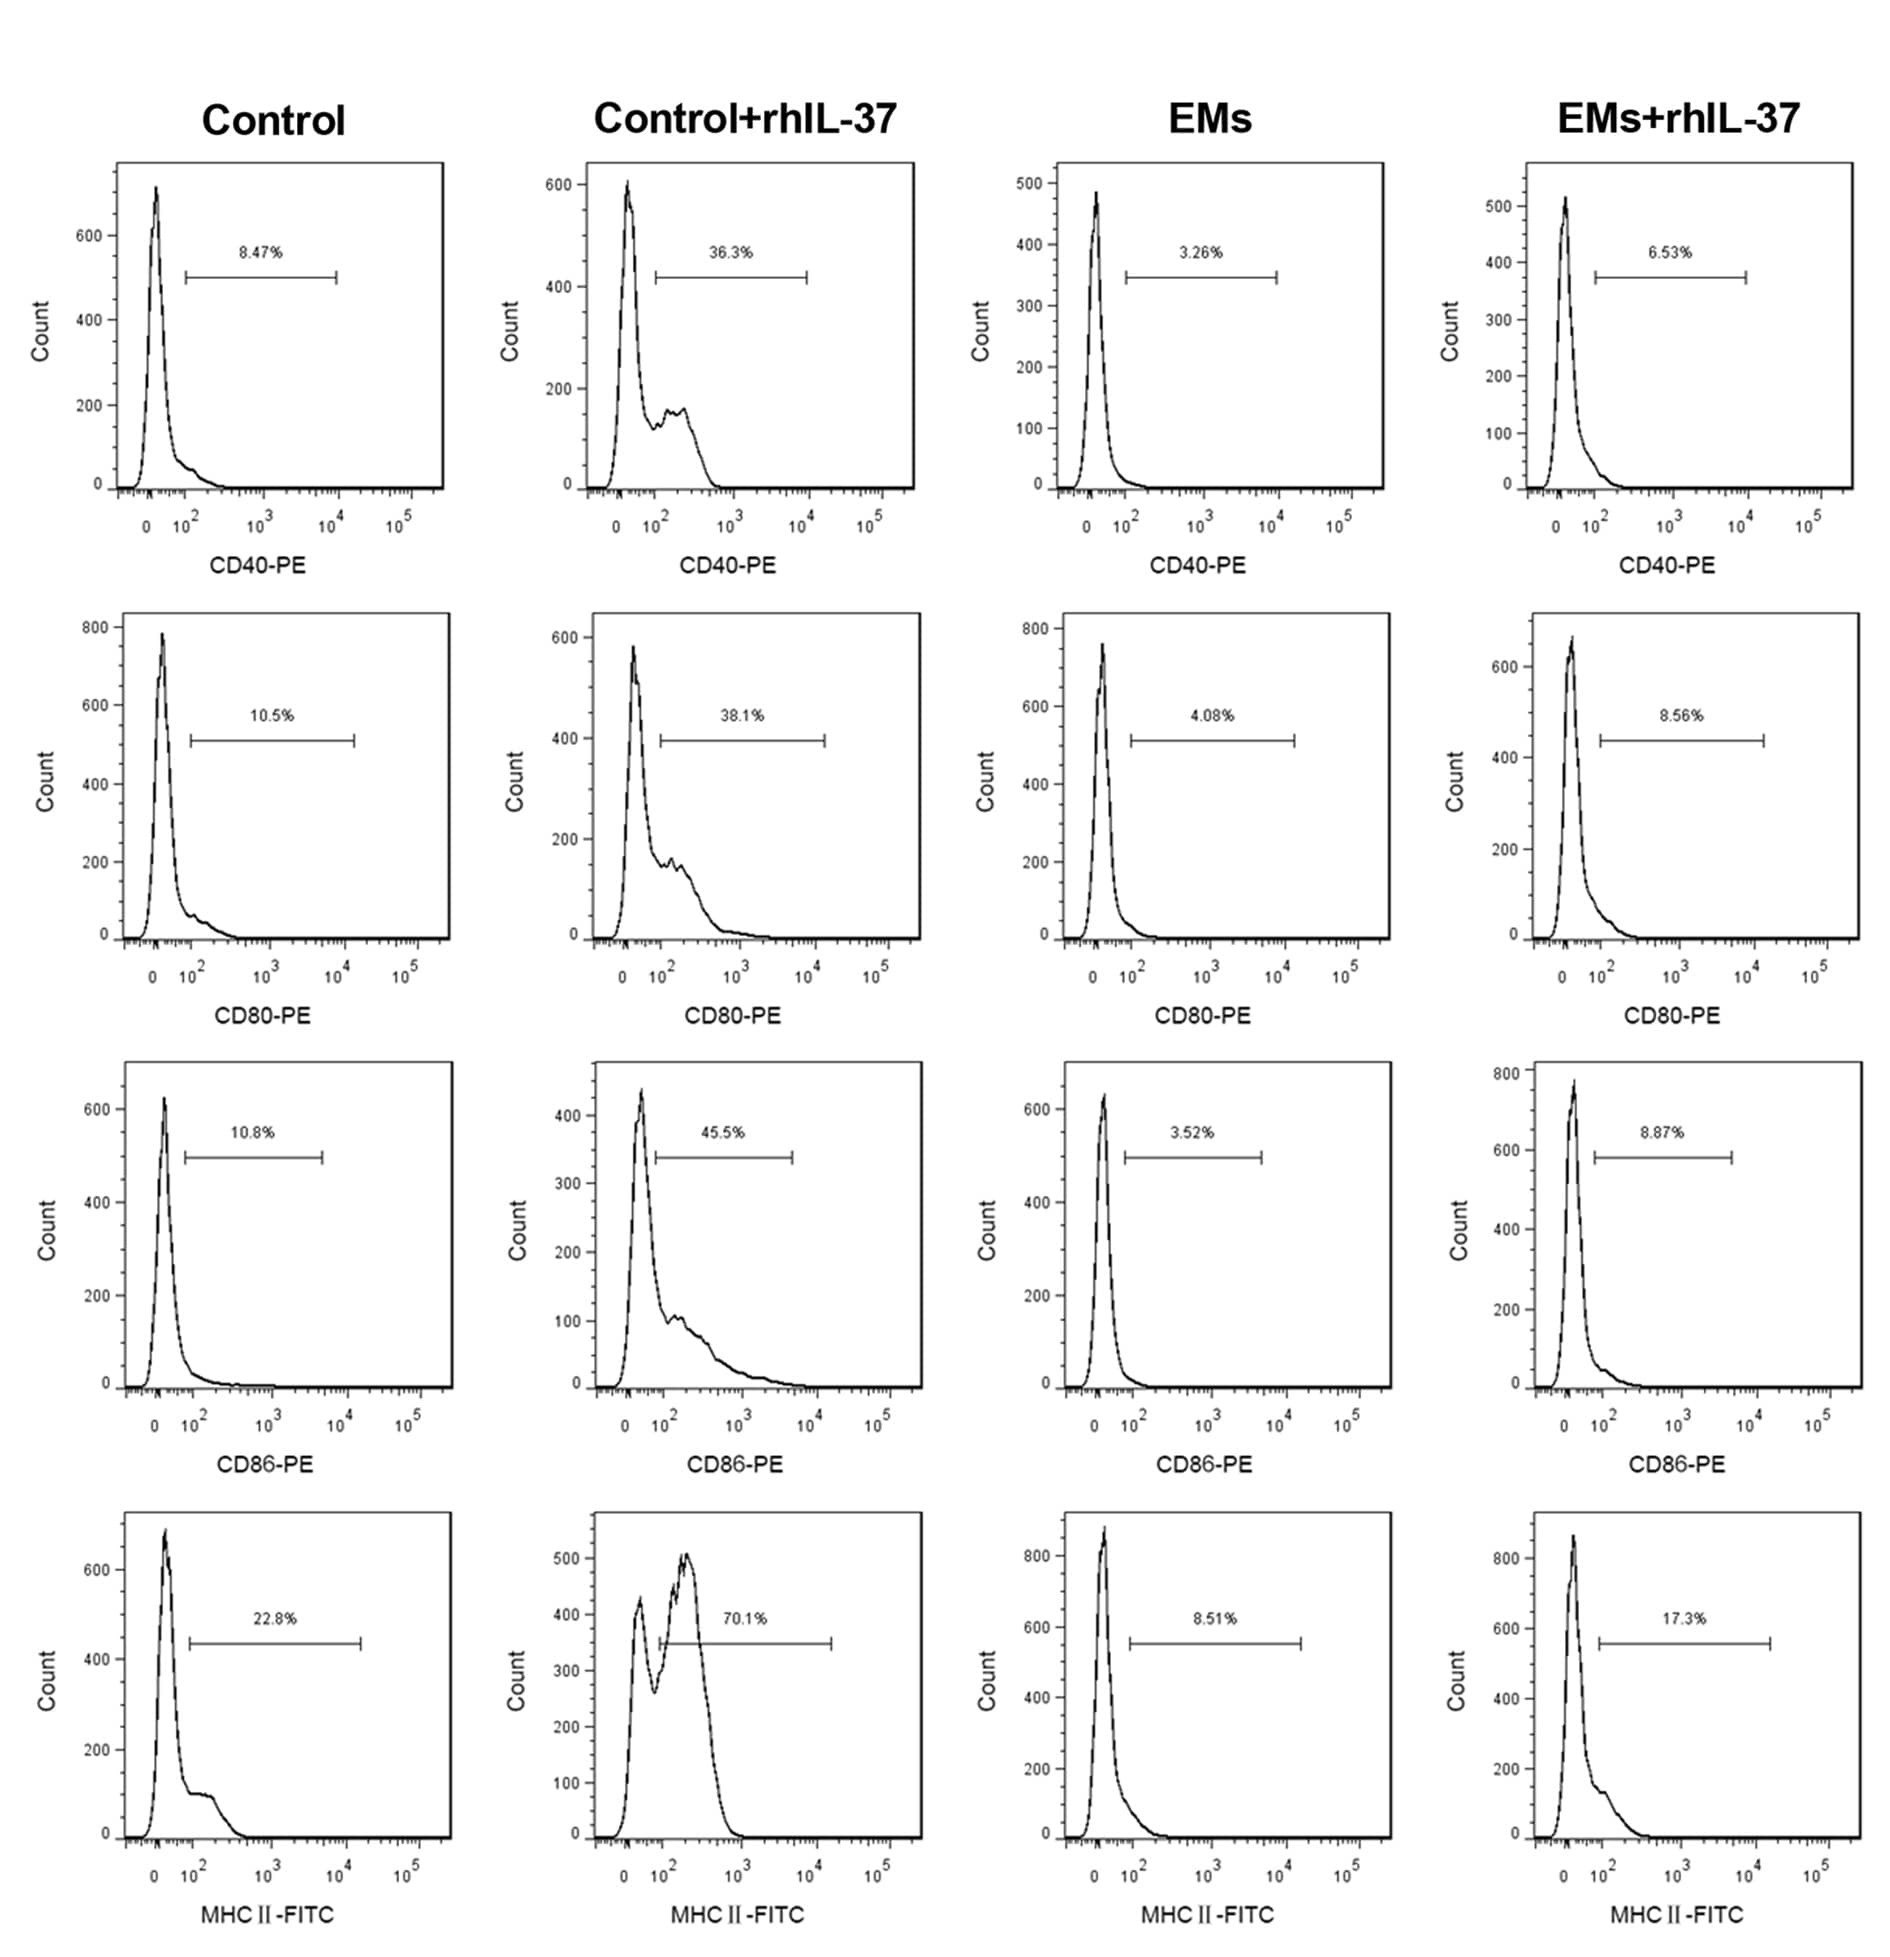
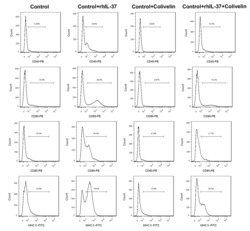
- Fig. 7 rhIL-37-induced the increasing of CD40, CD80, CD86, and MHC II in DCs was rescued by activation of STAT3. (A-D) The percentages of CD40-, CD80-, CD86-, and MHC II-positive DCs were determined using flow cytometry. N = 3. ** P < 0.01 compared with Control, and ## P < 0.01 compared with Control + rhIL-37
- Submitted by
- Invitrogen Antibodies (provider)
- Main image
- Experimental details
- Additional file 1: Supplementary figure 1 . Detection of the mature DCs percentage. At 24 hours after the last rhIL-37 administration, the percentages of CD40-, CD80-, CD86-, and MHC II-positive DCs in serum were determined using flow cytometry. N = 3.
- Submitted by
- Invitrogen Antibodies (provider)
- Main image
- Experimental details
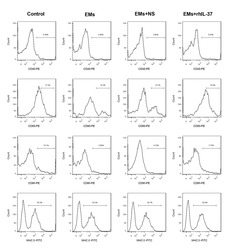
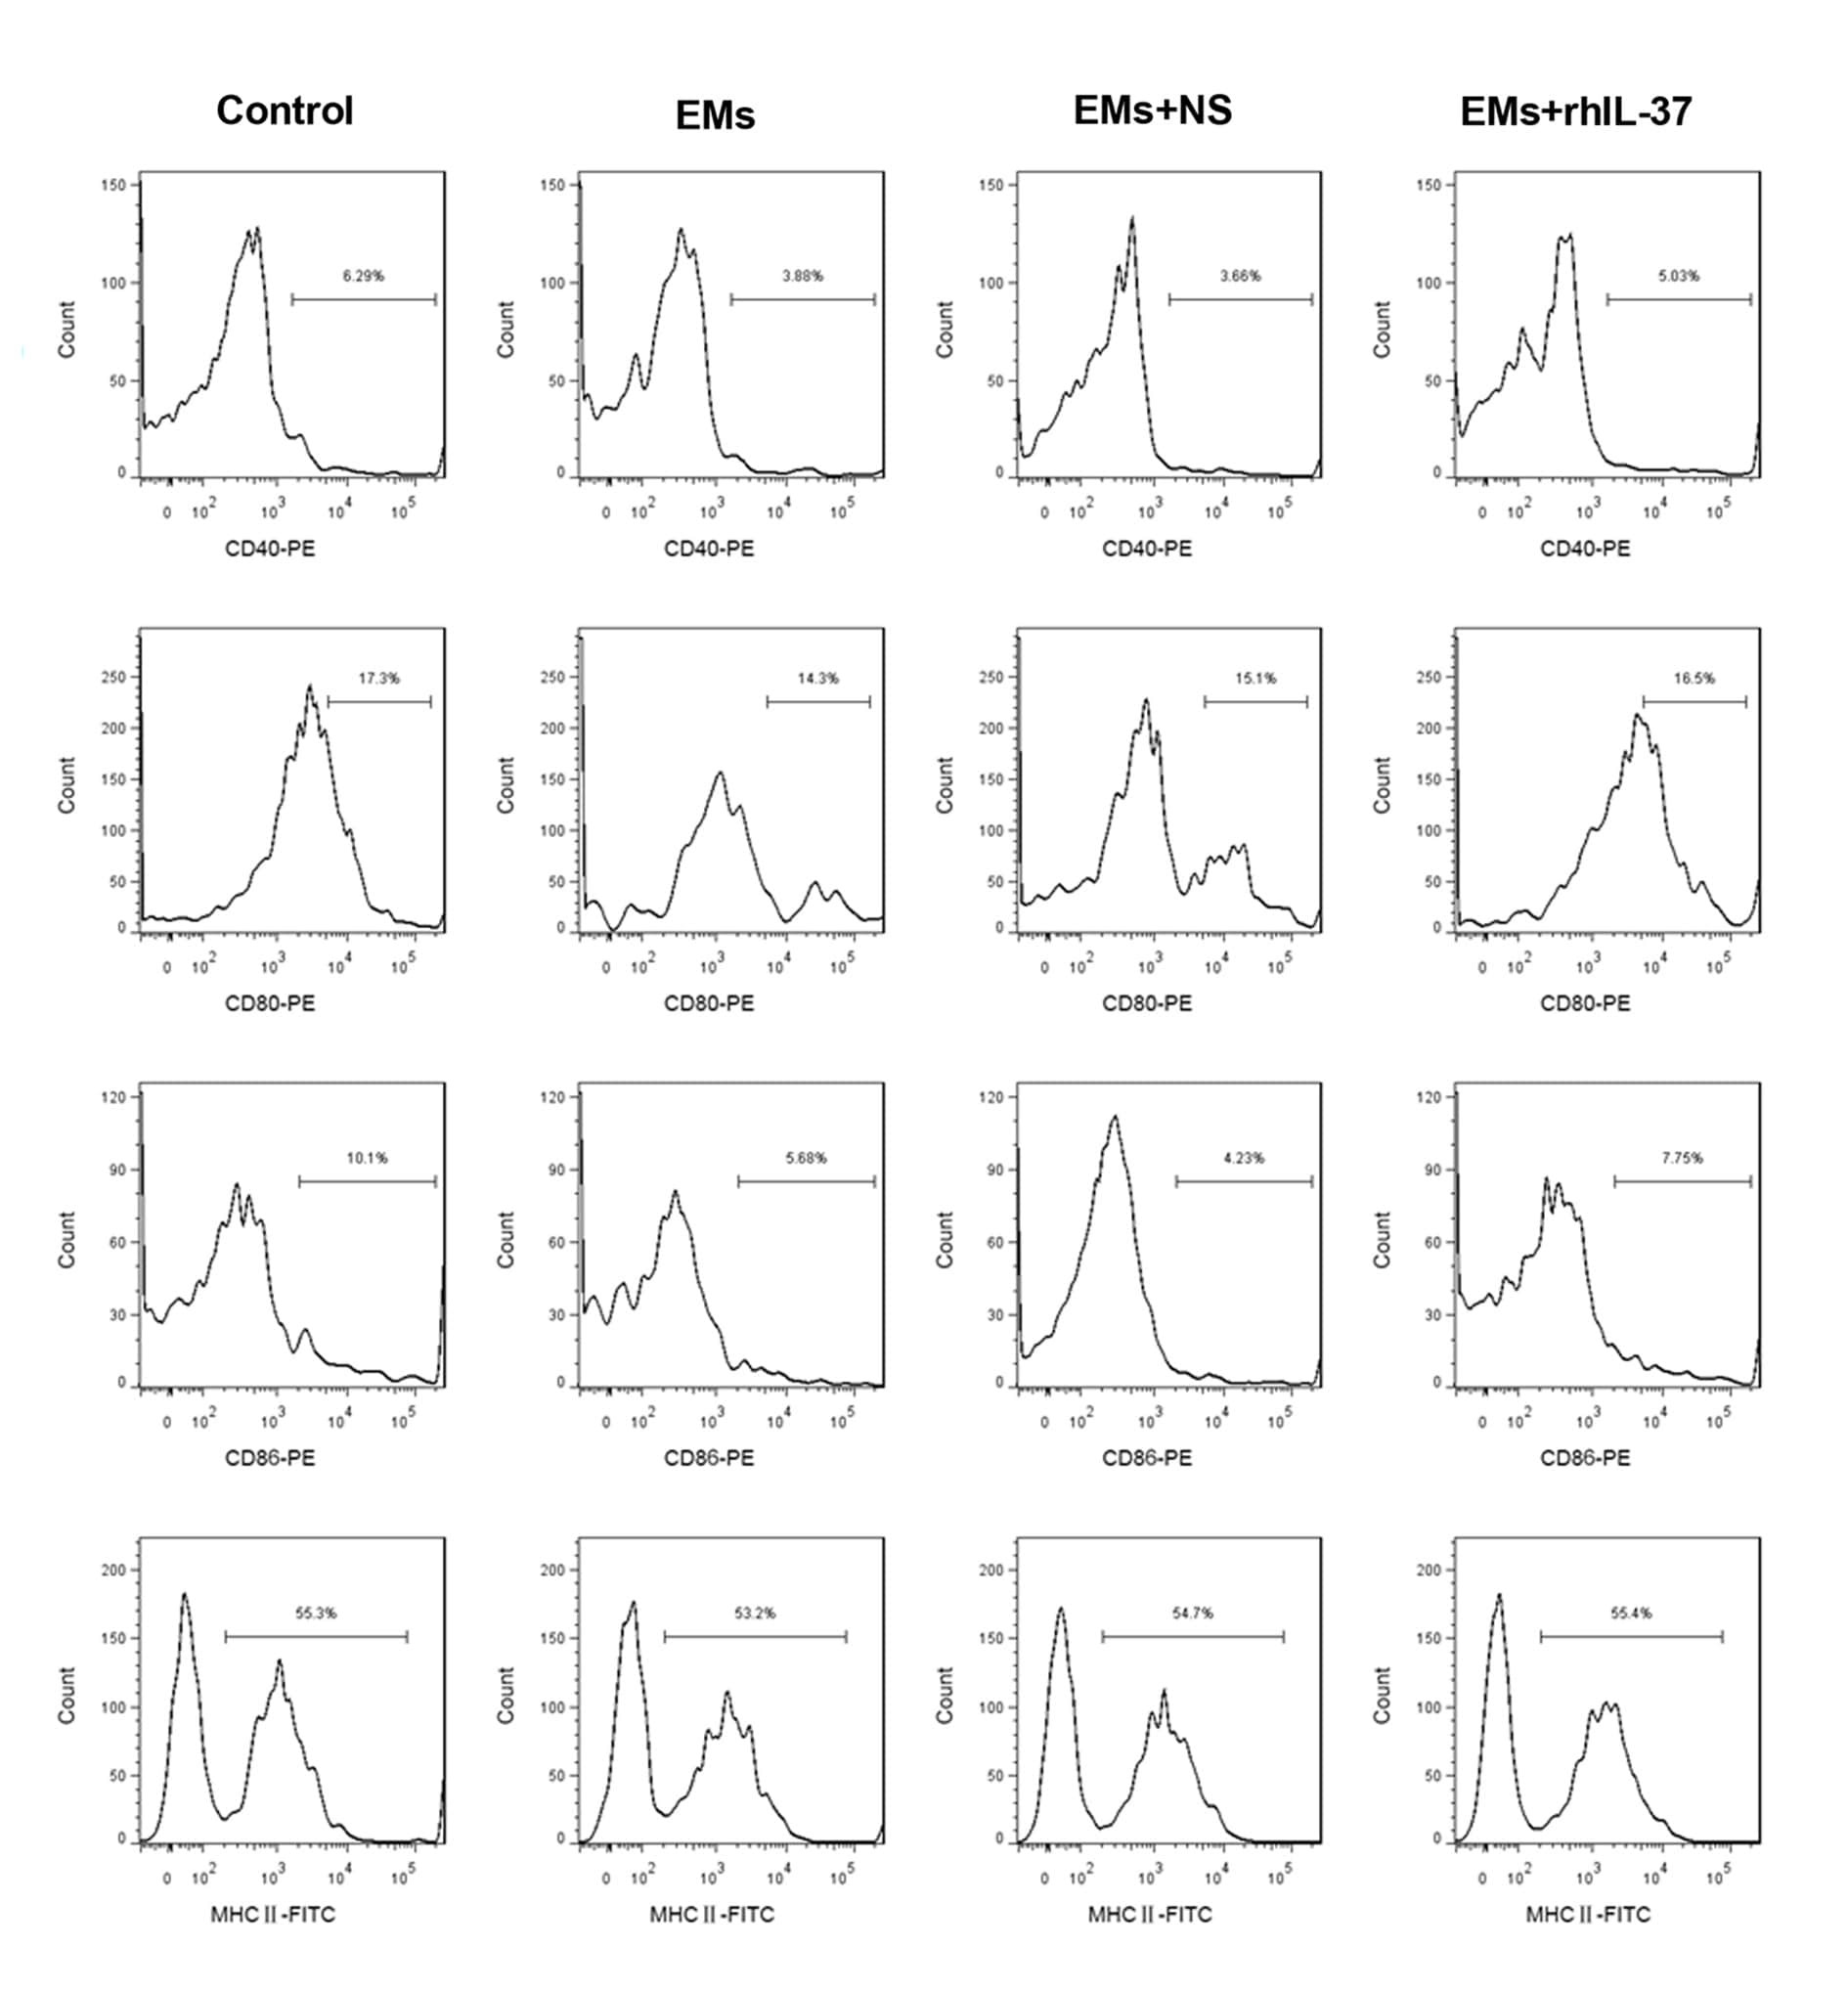
- Additional file 5: Supplementary figure 5 . Analysis of the maturation of DCs. DCs and EMs-DCs were separated, and were then treated with rhIL-37, and then the percentages of CD40-, CD80-, CD86-, and MHC II-positive DCs were determined using flow cytometry. N = 3.
- Submitted by
- Invitrogen Antibodies (provider)
- Main image
- Experimental details
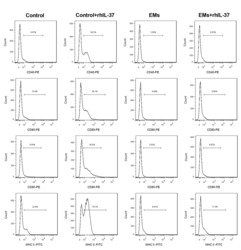
- Additional file 6: Supplementary figure 6 . Analysis of the maturation of DCs. The percentages of CD40-, CD80-, CD86-, and MHC II-positive DCs were determined using flow cytometry. N = 3.
- Submitted by
- Invitrogen Antibodies (provider)
- Main image
- Experimental details
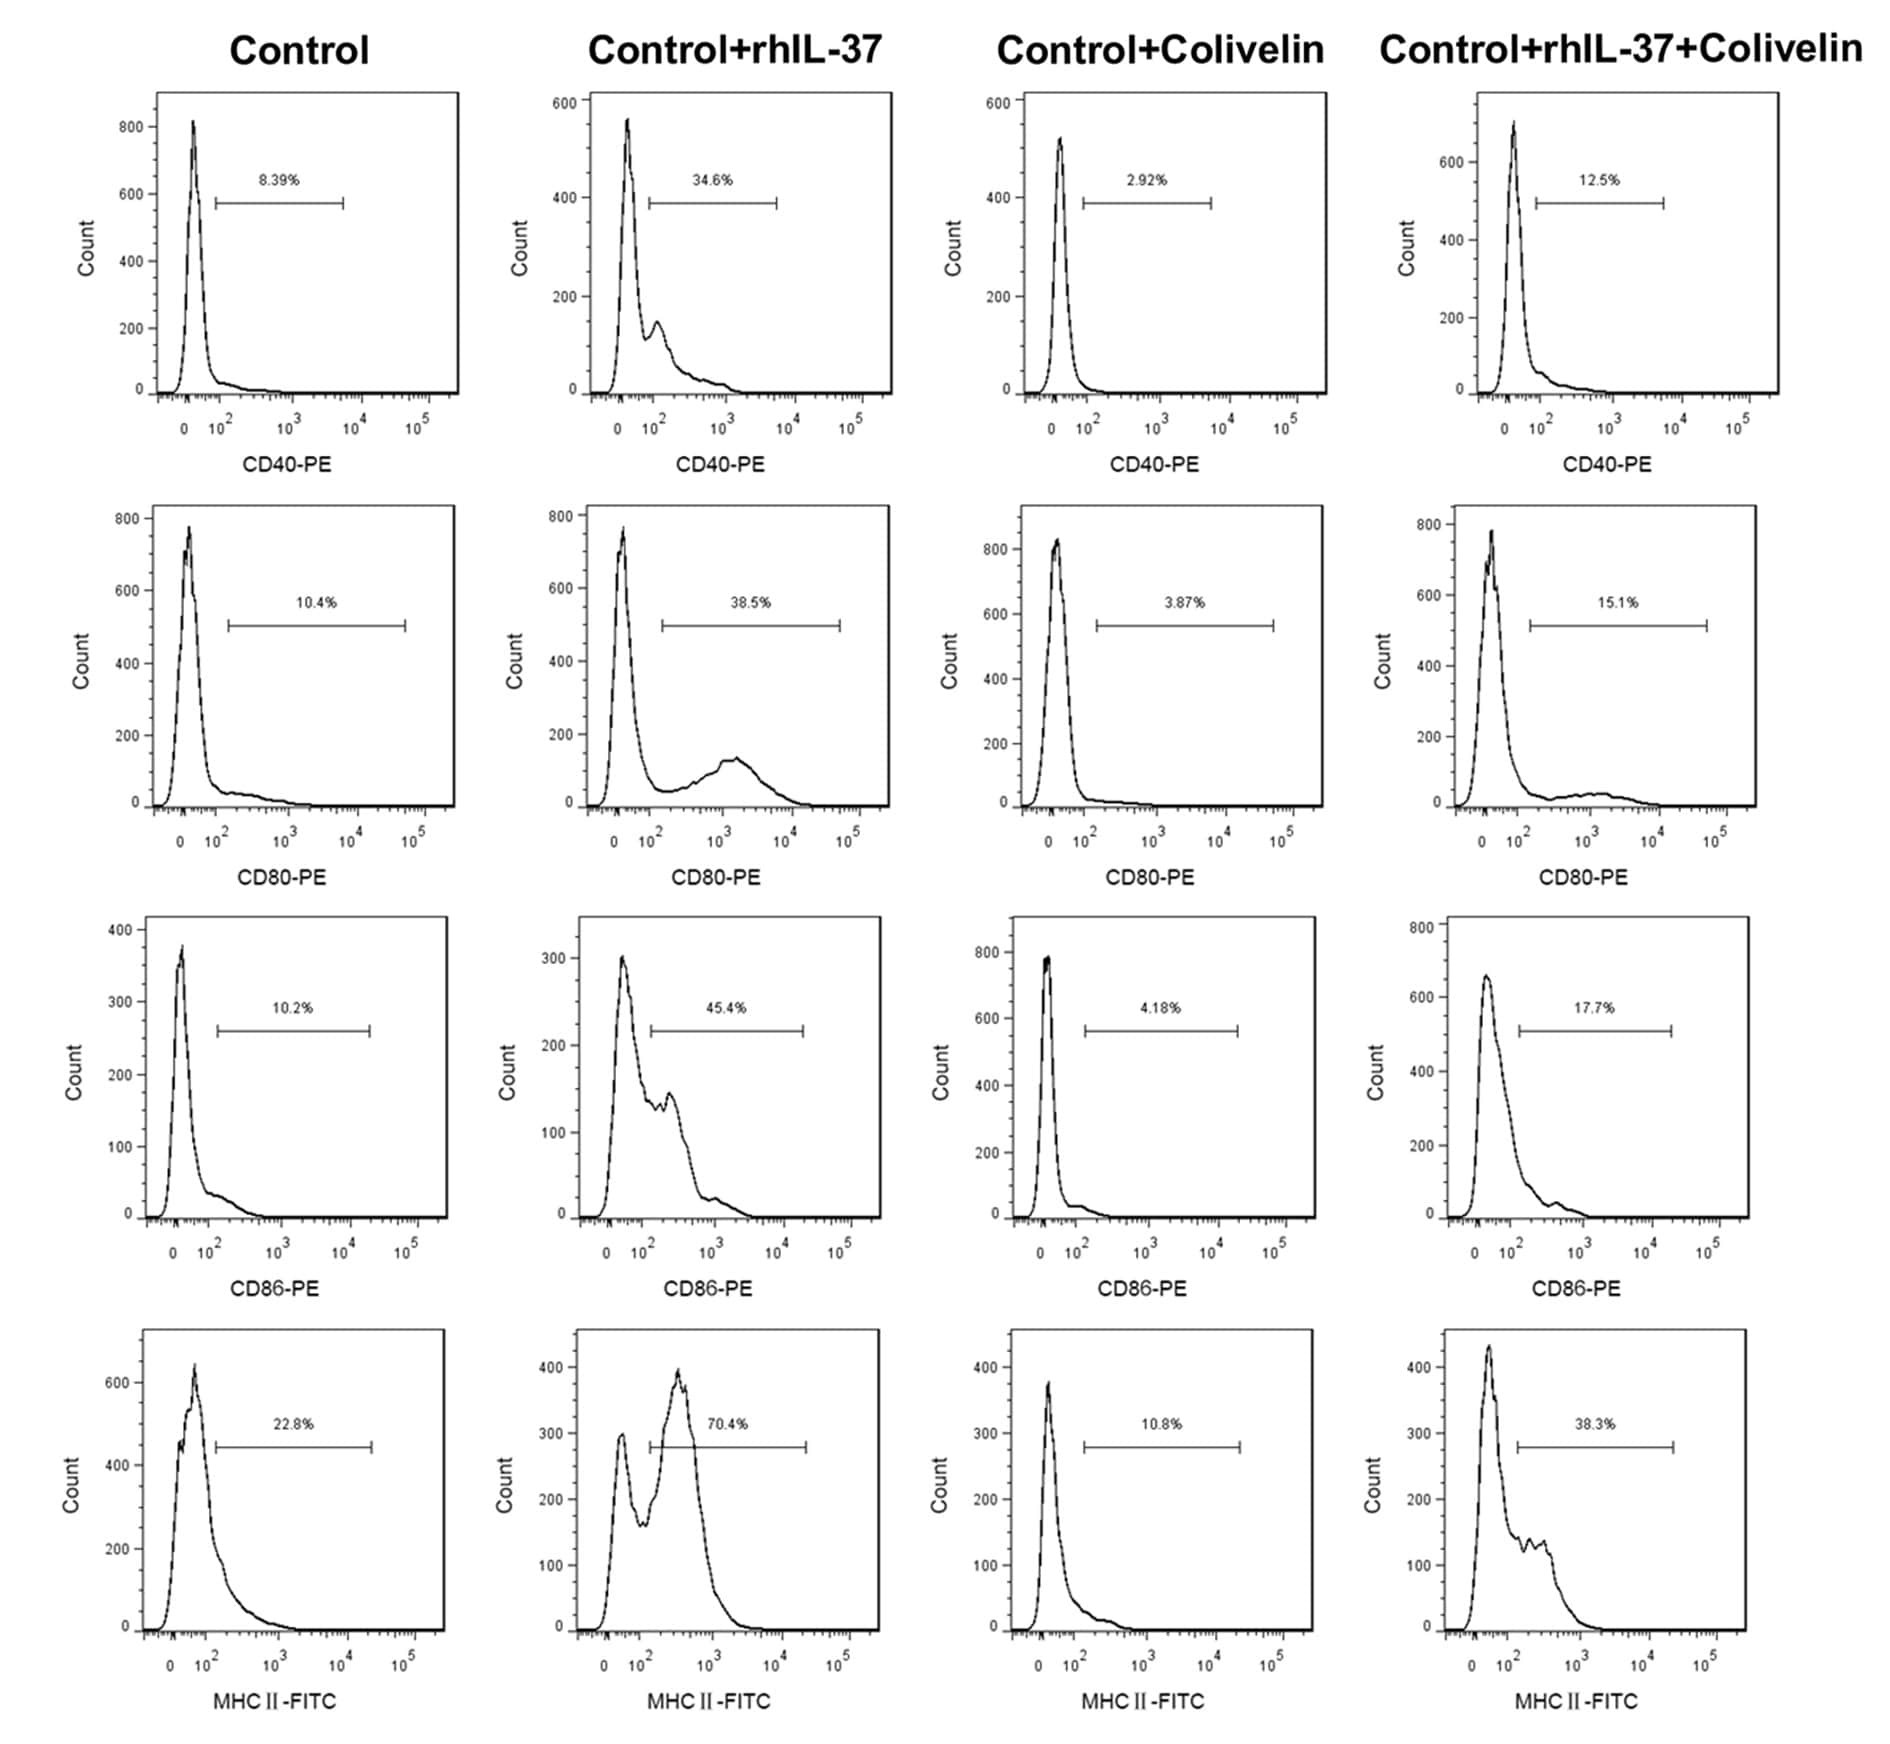
- Figure 5 Different expression of PD-L1 (CD274) and PD-1 (CD279) in THP-1-differentiated macrophages. ( A ) In PMA-stimulated THP-1-differentiated M 0 macrophages, cells were then treated with LPS (1 mug/mL)/IFN-gamma (10 ng/mL) and IL-4 (25 ng/mL)/IL-13 (25 ng/mL) for polarization of M 1 and M 2 , respectively, in the absence and presence of neutralizing antibodies (5 mug/mL) against CD274 (alpha-PD-L1) and CD279 (alpha-PD-1) according to the experimental design. ( B ) For immunostaining, cells were stained with CD80 and CD209 for dissecting M 1 and M 2 , respectively. Immunostaining followed by flow cytometric histogram analysis showed the expression of CD274 and CD279 in these cells. ( C ) Furthermore, the expression of CD80 and CD209 in M 1 and M 2 without or with the blockade of CD274 and CD279 were shown. For all flow cytometric analysis, representative data were selectively obtained from three individual experiments, and the percentage of positive cells is shown. THP-1 (black); THP-1 M 0 (red); THP-1 M 1 (blue); THP-1 M 2 (green).
- Submitted by
- Invitrogen Antibodies (provider)
- Main image
- Experimental details
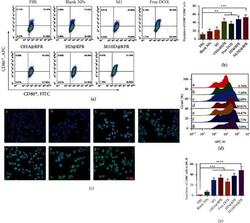
- Study on cellular immunity mechanism. (a) and (b) Representative flow cytometry plots of CD80 + CD86 + in each group. (c) Immunofluorescence results of M1 macrophages induced by nanoparticles. a, PBS; b, Blank NPs; c, M1; d, OHA@RPR; e, Free DOX; f, HD@RPR; g, M1HD@RPR (scale: 20 mu m). (d) and (e) Flow cytometry results of M1 induced by nanoparticles. a, PBS; b, Blank NPs; c, M1; d, OHA@RPR; e, Free DOX; f, HD@RPR; g, M1HD@RPR.

- Submitted by
- Invitrogen Antibodies (provider)
- Main image
- Experimental details
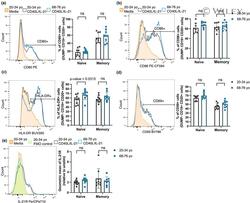
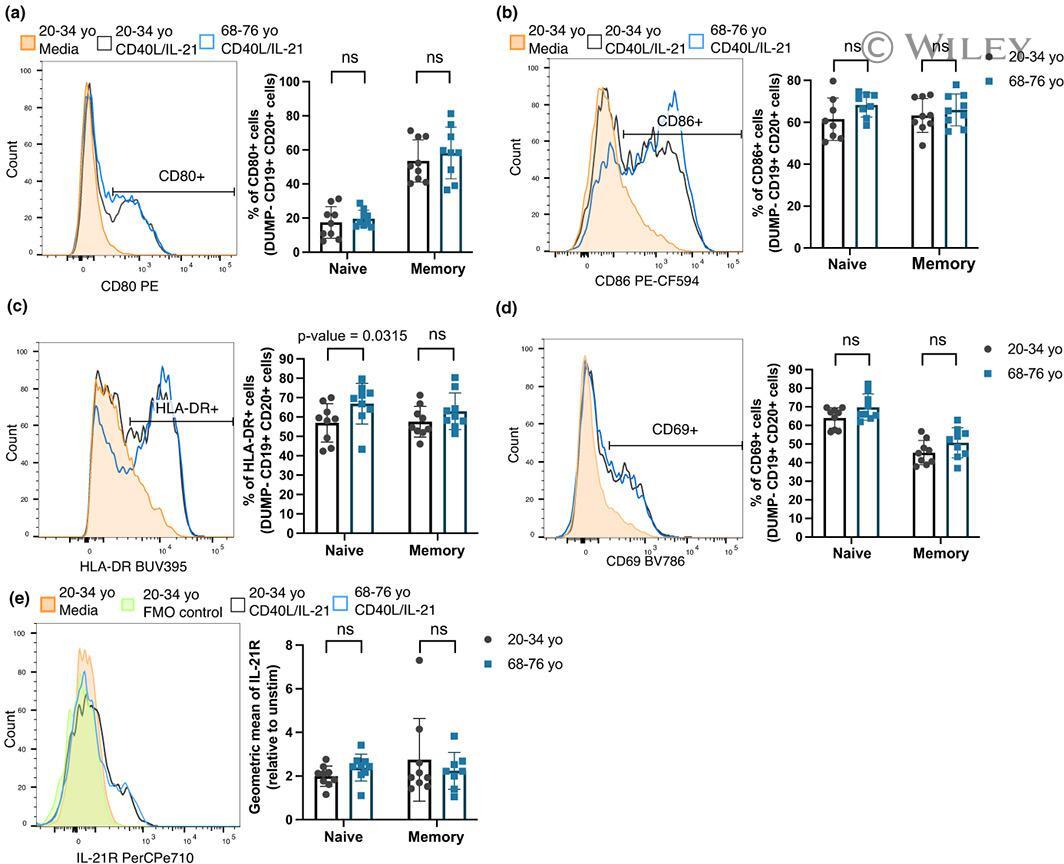
- 3 FIGURE B cells from older human donors are able to upregulate costimulatory molecules and activation markers after stimulation. (a-e) Representative flow cytometric histograms showing the expression levels of costimulatory molecules by memory B cells from a 29 year old (grey) and 70 year old (blue) donor after 48 h stimulation with CD40L and IL-21 or media (orange) and graphs showing the percentages of cells positive for the marker, or geometric mean of marker using the gating strategies shown, for CD80 (a), CD86 (b), HLA-DR (c), CD69 (d) and IL-21R (e). These were gated on live CD19 + CD20 + cells. Fluorescent minus one (FMO) controls were included for the IL-21R stain and are shown on the representative histogram. Bar height corresponds to the mean, error bars indicate standard deviation, and each symbol represents values from independent donors. Statistics were calculated using the unpaired Mann-Whitney U test. Data were representative of three independent repeat experiments.
- Submitted by
- Invitrogen Antibodies (provider)
- Main image
- Experimental details
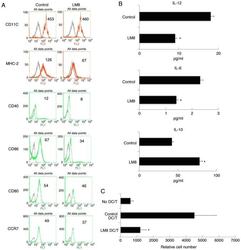
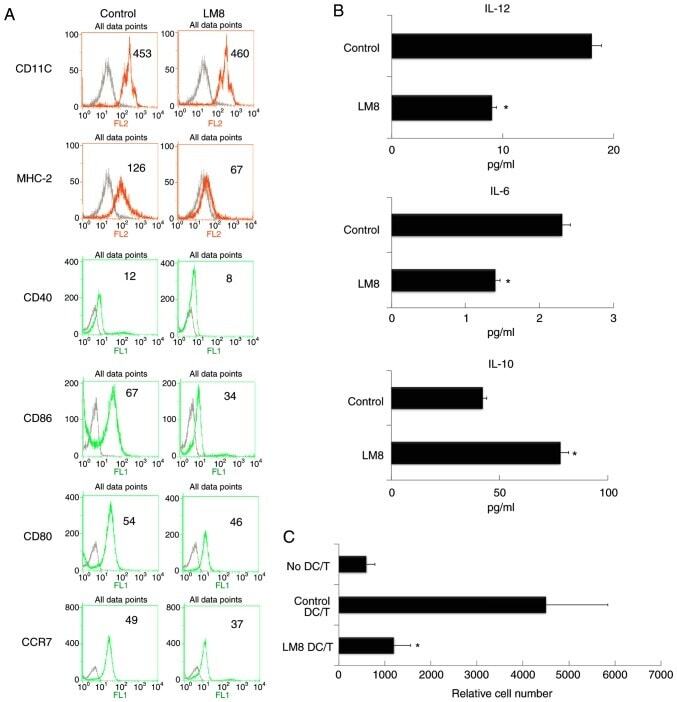
- Figure 1. The remnants of LM8 decreased the co-stimulatory molecules, and inhibited IL-12 and IL-6 levels, increased IL-10 levels, and inhibited the ability of DCs to stimulate T-cell proliferation. (A) The DCs were isolated following a 48-h co-culture with the remnants of LM8 cells. The cells were then labeled with antibodies against CD11c, MHC-2, CD40, CD86, CD80 and CCR7 for phenotypic analysis by flow cytometry. The numbers in the histograms indicate the geometric mean fluorescence intensity. (B) Following isolation from the co-culture system, the DCs were cultured for 12 h. Subsequently, the expression levels of IL-12, IL-6 and IL-10 in the supernatant were analyzed by ELISA. (C) CD4 + T cells from DO11.10 OVA 323-339 -specific (TCR-transgenic x C57BL/6) F1 hybrid mice were co-cultured with DCs or mDCs (control) in the presence of OVA peptides. Five days later, the total number of viable CD4 + T (CD4 + 7-AAD - ) cells in each well was measured by flow cytometry. Data represent one of at least three experiments with similar results. *P
- Submitted by
- Invitrogen Antibodies (provider)
- Main image
- Experimental details
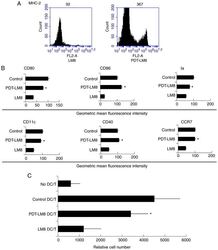
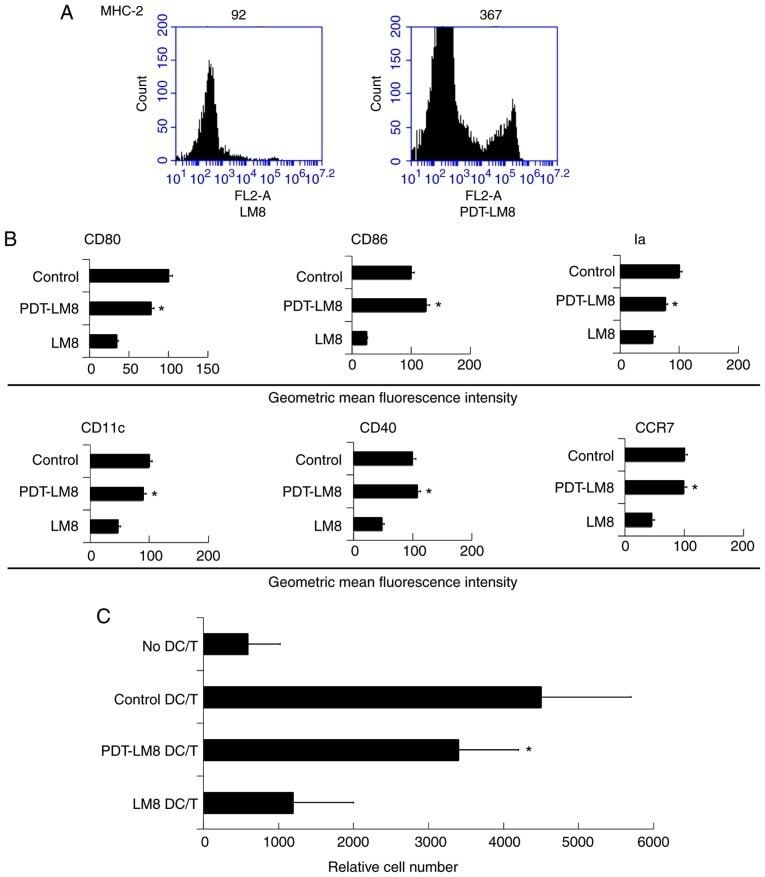
- Figure 2. PDT treatment partly reversed the effect of LM8 remnants on the phenotype of DCs and their ability to stimulate T cells proliferation. (A) The LM8 cells were pre-treated with PDT, and then labeled with antibodies against MHC-2, CD11c, CD40, CD86, CD80 and CCR7, for phenotypic analysis by flow cytometry. (B) The numbers in the histograms indicate the geometric mean fluorescence intensity. *P
- Submitted by
- Invitrogen Antibodies (provider)
- Main image
- Experimental details
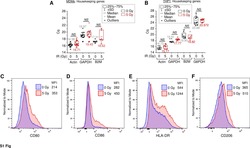
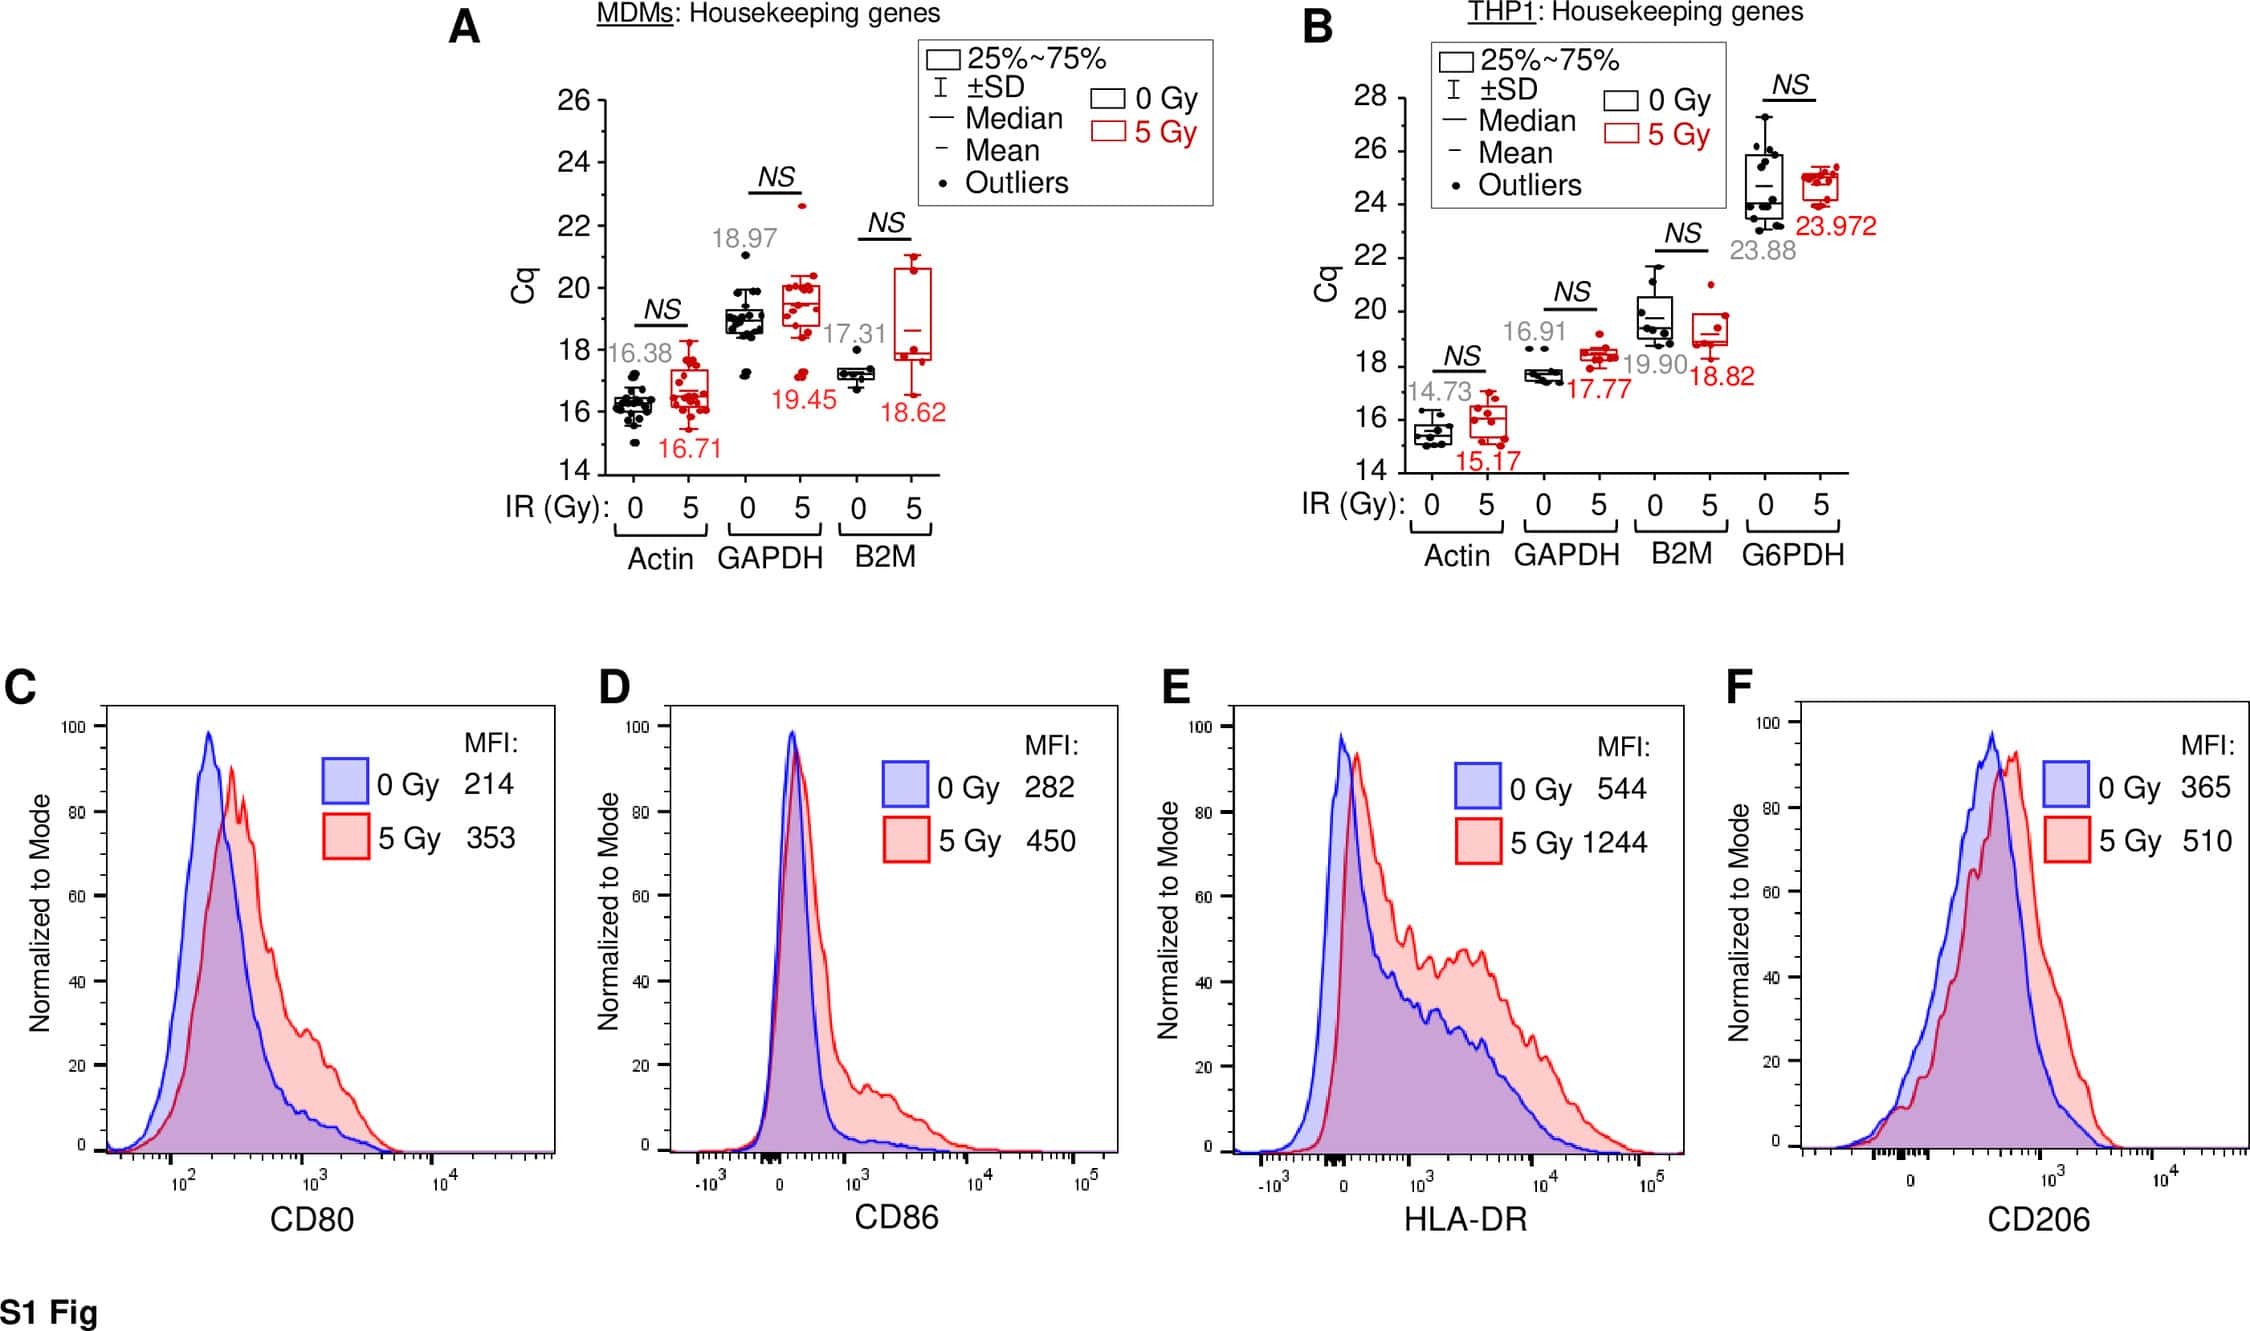
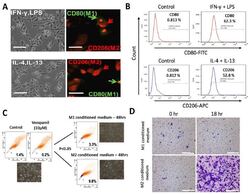
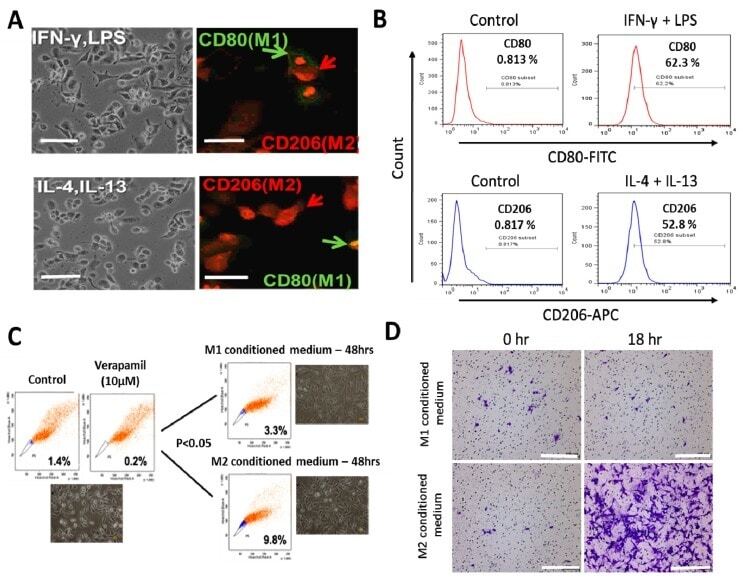
- Figure 1 Differential macrophage response to different inflammatory cytokine stimuli. ( A ) Morphological and immunocytochemical images showing monocyte-derived macrophage (MDM) polarization to M1 or M2 functional phenotype using type 1 cytokine IFN-gamma and lipopolysaccharide (LPS) or type 2 cytokine IL-4 and IL-13, respectively. ( B ) Increases in CD80+ M1 and CD206+ M2 MDMs were seen after treatment with IFN-gamma /LPS or IL-4/IL-13, respectively, using flow-cytometry analysis. Green arrows point to the CD80+ M1 macrophage, while red arrows indicate CD206+ M2 macrophages. ( C ) Flow cytometry and morphology imaging of M1 and M2 cell sorting and isolation using the fluorescence-activated cell sorting (FACS) assay. ( D ) Compared with the H1299 cells treated with M1 conditioned medium, the H1299 cells cultured with M2 conditioned medium exhibited higher invasion ability at 18 h in matrigel study. APC: antigen-presenting cell.
- Submitted by
- Invitrogen Antibodies (provider)
- Main image
- Experimental details
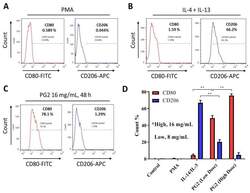
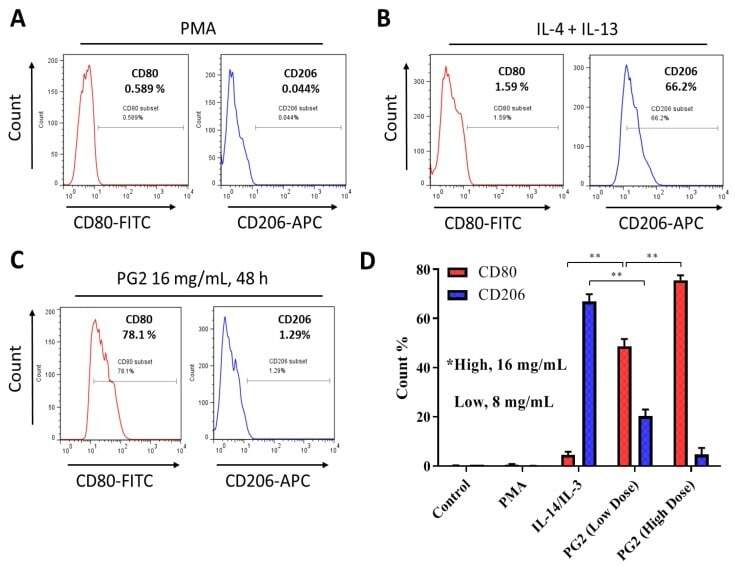
- Figure 2 Astragalus polysaccharide (PG2) enhances M1 polarization and down-regulates IL-4/IL-13-induced M2 polarization. Images from flow cytometric analyses showing ( A ) the differentiation of THP-1 monocyte into macrophages after 24 h incubation in phorbol 12-myristate 13-acetate (PMA), ( B ) incubation of MDM in IL-4 and IL-13 induced a CD206 high CD80 low M2 phenotype, while ( C ) incubation of MDM in PG2 16 mg/mL for 48 h induced a CD80 high CD206 low M1 phenotype. ( D ) A graphical representation of the differential effect of IL-4/IL-13 and low dose (8 mg/mL) or high dose (16 mg/mL) PG2 treatment on M1-M2 polarization. ** p < 0.01
- Submitted by
- Invitrogen Antibodies (provider)
- Main image
- Experimental details
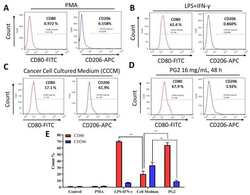
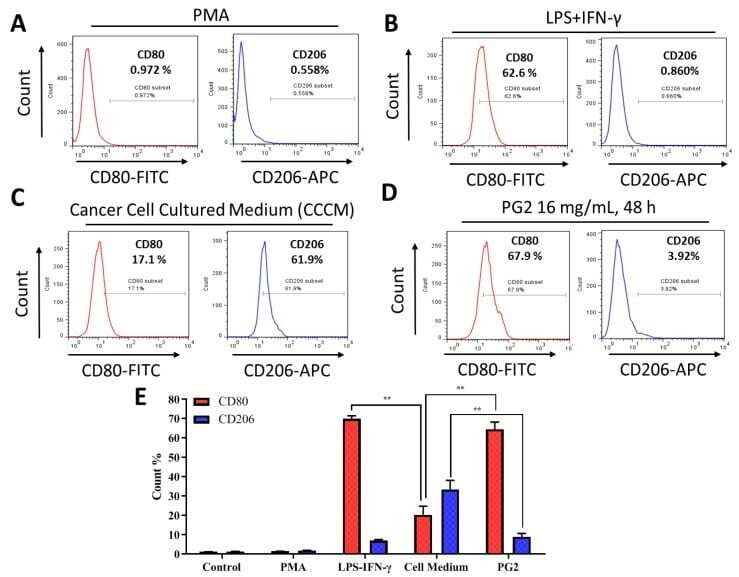
- Figure 3 The enhancement of M1 macrophage polarization by PG2 is akin to the effect of LPS/IFN-gamma stimulation of MDMs. Images from flow cytometric analyses showing ( A ) the differentiation of THP-1 monocyte into macrophages after 24 h incubation in PMA; ( B ) MDMs after exposure to IFN-gamma and LPS induced a CD80 high CD206 low M1 phenotype; ( C ) cancer cell culture medium (CCCM) induced 17.1% CD80+ and 61.9% CD206+ MDMs; ( D ) PG2-treatment of MDMs pre-incubated in CCCM induced a CD80 high CD206 low M1 phenotype, similar to IFN-gamma/LPS exposure; ( E ) a graphical representation of the differential effect of IFN-gamma/LPS, CCCM, and 16 mg/mL PG2 treatment on M1-M2 polarization. PG2 enhanced the M1 phenotype akin to IFN-gamma/LPS exposure effect. ** p < 0.01
- Submitted by
- Invitrogen Antibodies (provider)
- Main image
- Experimental details
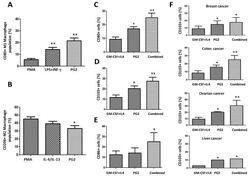
- Figure 6 PG2 modulated the CD80+ M1/CD206+ M2 macrophage population and increased the population of CD80+, CD103+, and CD86+ dendritic cells derived from peripheral blood mononuclear cells (PBMCs) of cancer patient's ex vivo. The effect of PMA, LPS+INF-gamma, or PG2 on the proportion of ( A ) CD80+ and ( B ) CD206+ cells, as shown by flow cytometry. Graphical representation of the effect of PG2 on the population of ( C ) CD80+, ( D ) CD103+, and ( E ) CD86+ dendritic cells derived from GM-CSF+IL-4-treated PBMCs of NSCLC patients. ( F ) Graphical representation of the effect of PG2 on the number of functional CD103+ dendritic cells derived from GM-CSF+IL-4-treated PBMCs of breast, colon, ovarian, or liver patients. 1: GM-CSF+IL4; 2: GM-CSF+IL4, followed by the treatment of PG2 (16 mg/mL); 3: GM-CSF+IL4, washed out, and followed by the treatment of PG2 (16 mg/mL); * p < 0.05, ** p < 0.01.
