Explore
 Validate
 Learn
Learn Immunocytochemistry
Antibody data
- Antibody Data
- Antigen structure
- References [8]
- Comments [0]
- Validations
- Immunocytochemistry [1]
- Other assay [9]
Submit
Validation data
Reference
Comment
Report error
- Product number
- 53-9843-80 - Provider product page

- Provider
- Invitrogen Antibodies
- Product name
- Nestin Monoclonal Antibody (10C2), Alexa Fluor™ 488, eBioscience™
- Antibody type
- Monoclonal
- Antigen
- Other
- Description
- Description: The monoclonal antibody 10C2 recognizes human nestin (residues 1464-1614). Nestin is a 220-240 kDa Class VI intermediate filament protein that is expressed in stem cells of the developing nervous system. Expression has also been found in pancreatic islet and mesenchymal precursors in addition to cells with angiogenic potential. Upon differentiation, nestin-containing filaments are replaced by cell type-specific intermediate filament proteins, such as GFAP. Expression has been identified in a variety of cancerous cells including glioblastomas and pancreatic tumors. No cross-reactivity to rodent nestins has been observed using the 10C2 antibody.
- Conjugate
- Green dye
- Antibody clone number
- 10C2
- Concentration
- 0.5 mg/mL
Submitted references Pannexin 1 Influences Lineage Specification of Human iPSCs.
Initiation of Pancreatic Cancer: The Interplay of Hyperglycemia and Macrophages Promotes the Acquisition of Malignancy-Associated Properties in Pancreatic Ductal Epithelial Cells.
Connexin 43 Gene Ablation Does Not Alter Human Pluripotent Stem Cell Germ Lineage Specification.
Herpes simplex virus type 1 infection leads to neurodevelopmental disorder-associated neuropathological changes.
Metalloproteinases ADAM10 and ADAM17 Mediate Migration and Differentiation in Glioblastoma Sphere-Forming Cells.
Sphere-Derived Multipotent Progenitor Cells Obtained From Human Oral Mucosa Are Enriched in Neural Crest Cells.
Histone modification profiling reveals differential signatures associated with human embryonic stem cell self-renewal and differentiation.
Establishment and characterization of primary glioblastoma cell lines from fresh and frozen material: a detailed comparison.
Noort RJ, Christopher GA, Esseltine JL
Frontiers in cell and developmental biology 2021;9:659397
Frontiers in cell and developmental biology 2021;9:659397
Initiation of Pancreatic Cancer: The Interplay of Hyperglycemia and Macrophages Promotes the Acquisition of Malignancy-Associated Properties in Pancreatic Ductal Epithelial Cells.
Otto L, Rahn S, Daunke T, Walter F, Winter E, Möller JL, Rose-John S, Wesch D, Schäfer H, Sebens S
International journal of molecular sciences 2021 May 11;22(10)
International journal of molecular sciences 2021 May 11;22(10)
Connexin 43 Gene Ablation Does Not Alter Human Pluripotent Stem Cell Germ Lineage Specification.
Christopher GA, Noort RJ, Esseltine JL
Biomolecules 2021 Dec 22;12(1)
Biomolecules 2021 Dec 22;12(1)
Herpes simplex virus type 1 infection leads to neurodevelopmental disorder-associated neuropathological changes.
Qiao H, Guo M, Shang J, Zhao W, Wang Z, Liu N, Li B, Zhou Y, Wu Y, Chen P
PLoS pathogens 2020 Oct;16(10):e1008899
PLoS pathogens 2020 Oct;16(10):e1008899
Metalloproteinases ADAM10 and ADAM17 Mediate Migration and Differentiation in Glioblastoma Sphere-Forming Cells.
Siney EJ, Holden A, Casselden E, Bulstrode H, Thomas GJ, Willaime-Morawek S
Molecular neurobiology 2017 Jul;54(5):3893-3905
Molecular neurobiology 2017 Jul;54(5):3893-3905
Sphere-Derived Multipotent Progenitor Cells Obtained From Human Oral Mucosa Are Enriched in Neural Crest Cells.
Abe S, Yamaguchi S, Sato Y, Harada K
Stem cells translational medicine 2016 Jan;5(1):117-28
Stem cells translational medicine 2016 Jan;5(1):117-28
Histone modification profiling reveals differential signatures associated with human embryonic stem cell self-renewal and differentiation.
Bhanu NV, Sidoli S, Garcia BA
Proteomics 2016 Feb;16(3):448-58
Proteomics 2016 Feb;16(3):448-58
Establishment and characterization of primary glioblastoma cell lines from fresh and frozen material: a detailed comparison.
Mullins CS, Schneider B, Stockhammer F, Krohn M, Classen CF, Linnebacher M
PloS one 2013;8(8):e71070
PloS one 2013;8(8):e71070
No comments: Submit comment
Supportive validation
- Submitted by
- Invitrogen Antibodies (provider)
- Main image
- Experimental details
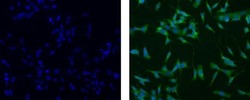
- Immunocytochemistry of fixed and permeabilized SKNSH cells using 10 µg/mL of Mouse IgG1 kappa Isotype Control Alexa Fluor® 488 (Product # 53-4714-42) (left) or 10 µg/mL Anti-Human Nestin Alexa Fluor® 488 (right). Nuclei are stained with DAPI.
- Conjugate
- Green dye

Supportive validation
- Submitted by
- Invitrogen Antibodies (provider)
- Main image

- Experimental details
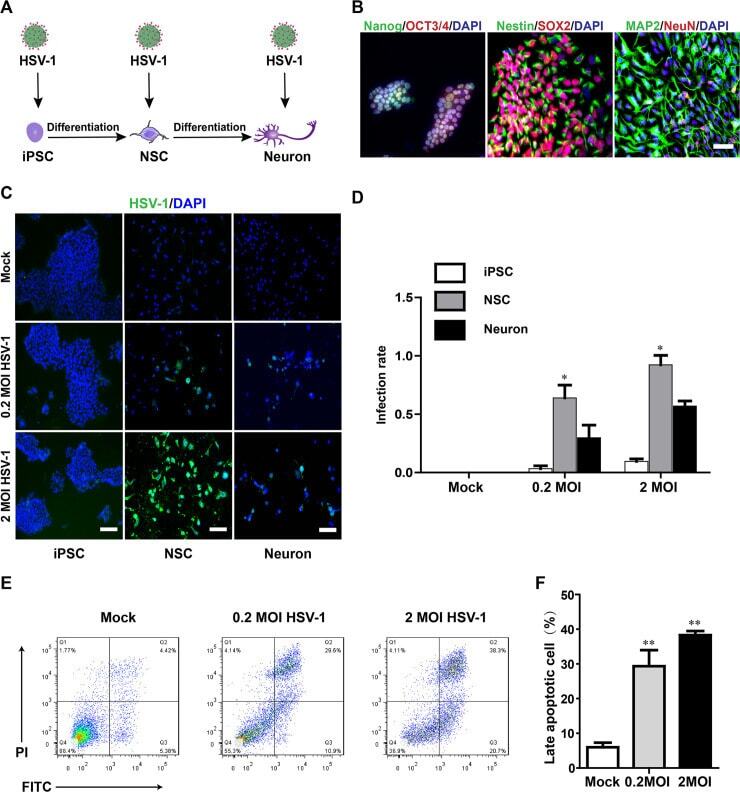
- Fig 1 HSV-1-infected NSCs exhibited increased cell apoptosis. (A) Schematic representation of the experimental pipeline used in the differentiation process of hiPSC-derived neurons. (B) Confirmation of the characteristic expression of hiPSCs, hiPSC-derived NSCs, and NSC-derived neurons. Immunolabeling of SOX2 and Nestin in hiPSC-derived NSCs at the day 7; NSCs were further differentiated into neurons illustrated using MAP2 and NeuN immunofluorescence after the day 21 of neural induction. Scale bars represent 50 mum. (C) Sample images of hiPSCs, NSCs and neurons 24 hours after infection with HSV-1, immunostained for HSV1 gE envelop protein (green) and DAPI (blue). The images were taken using an Olympus microscope. Scale bars represent 100 mum. (D) Quantification of infection efficiency for different cell types, including hiPSCs, hiPSC-derived NSCs, and NSC-derived neurons. Data represent the mean +- SEM. *p < 0.05 by ANOVA (n = 3 per sample). (E) Flow cytometry analysis showed the apoptotic NSCs after 24 hours treatment with or without HSV-1 infection (0.2 MOI or 2 MOI) for 2 hours. (F) Bar graphs showed the percentage of late apoptotic cells. Data represent the mean +- SEM. *p < 0.05, **p < 0.01 by ANOVA (n = 3 per sample).
- Conjugate
- Green dye
- Submitted by
- Invitrogen Antibodies (provider)
- Main image

- Experimental details
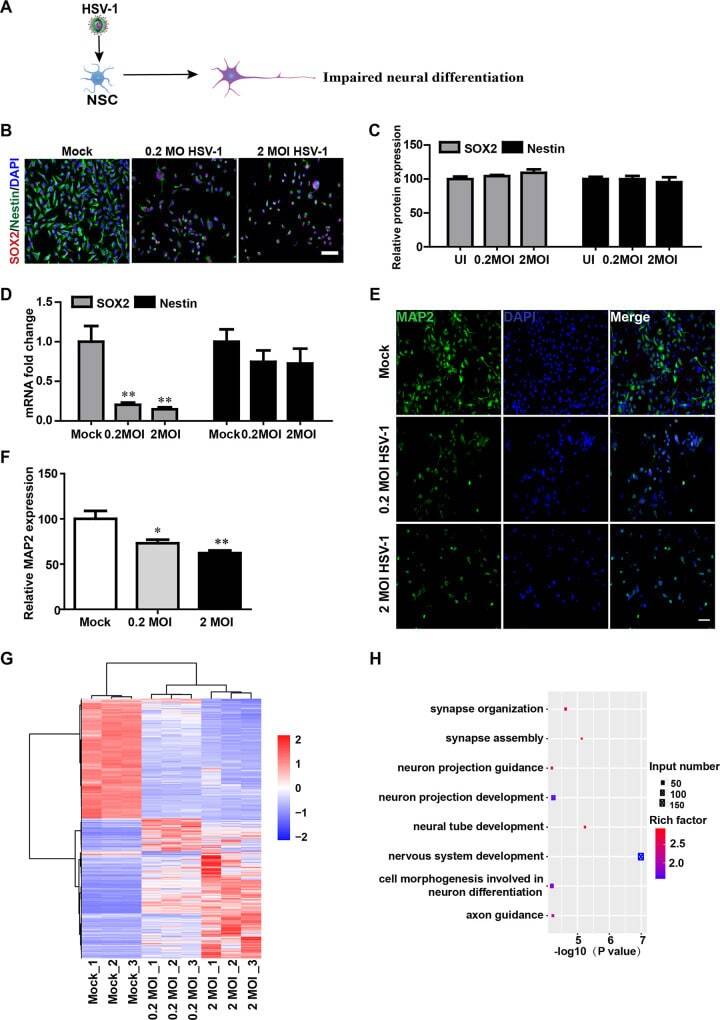
- Fig 2 HSV-1-infected NSCs exhibited dysregulated neural differentiation. (A) Schematic diagram depicting the effect of HSV-1-infection on the NSCs in the term of neuronal differentiation. (B) Sample images of NSCs after 24 hour infection without or with HSV-1(0.2 MOI or 2 MOI) for 2 hours, immunostained for NSCs markers Nestin (green) and SOX2 (red) and DAPI (blue). The images were taken using an Olympus microscope. (C) Quantification of Nestin and SOX2. (D) Detection of the mRNA expression of SOX2 and Nestin (n = 3). (E) The expressions of MAP2 were identified by immunofluorescence staining, and the quantifications (F) for the percentage of MAP2+ were shown using Image J. Data represent the mean +- SEM. *p < 0.05, **p < 0.01 by ANOVA (n = 3 per sample). (G) Unsupervised hierarchical clustering of genes differentially expressed in NSCs on the basis of infection with or without HSV-1 (0.2MOI, 2MOI). (H) Gene Ontology (GO) biological process groups enriched in genes down-regulated in NSCs infected with the HSV-1(0.2 MOI), compared with the NSCs.
- Conjugate
- Green dye
- Submitted by
- Invitrogen Antibodies (provider)
- Main image
- Experimental details
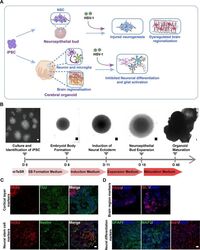
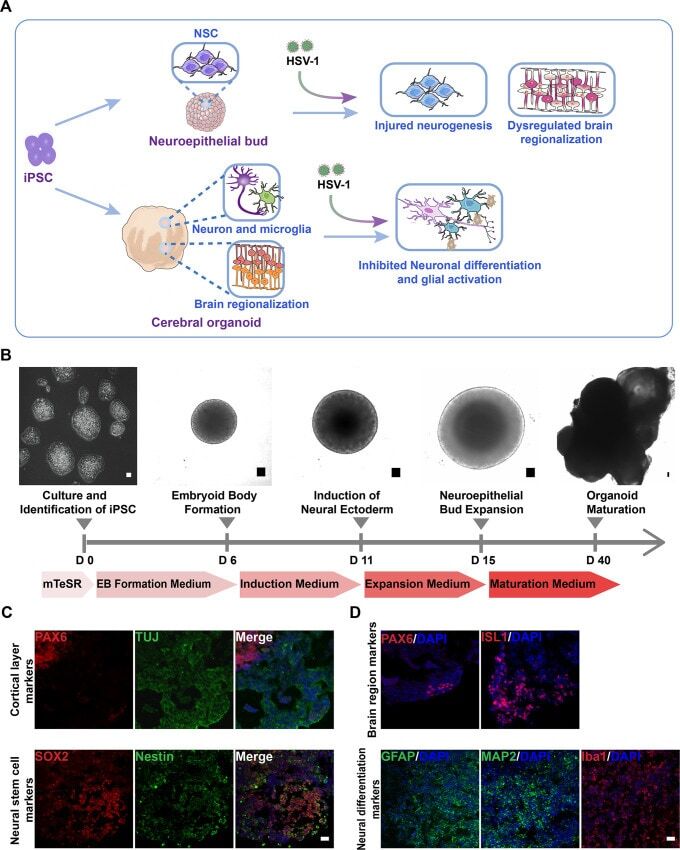
- Fig 3 The neuroepithelial buds and cerebral organoids recapitulated early stages of human fetal brain development. (A) Schematic diagram depicting the effect of HSV-1-infection on the neuroepithelial buds and brain organoids in the areas of modelling the pathological features of developing human fetal brain, including injured neurogenesis, impaired neuronal differentiation, abnormal microglial activation, and dysregulated brain regionalization. (B) Schematic diagram of the neuroepithelial bud and cerebral organoid method and timing. Scale bars: 50mum. (C) The immunofluorescence staining for PAX6, TUJ, Nestin, and SOX2 in the neuroepithelial buds at the day 18. Scale bars: 25 mum. (D) Expressions of the specific brain regions markers (forebrain, PAX6; hindbrain ISL1) in brain organoids at the day 18; the cerebral organoids derived from hiPSCs at the day 45 showed the diverse neuron subtypes, including the mature neurons (MAP2), the astrocyte marker (GFAP), and microglia markers (Iba1). Scale bars: 25 mum. The images were taken Images were captured on a Leica TCS SP8 STED confocal microscope.
- Conjugate
- Green dye
- Submitted by
- Invitrogen Antibodies (provider)
- Main image
- Experimental details
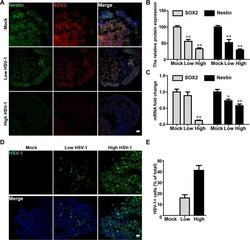
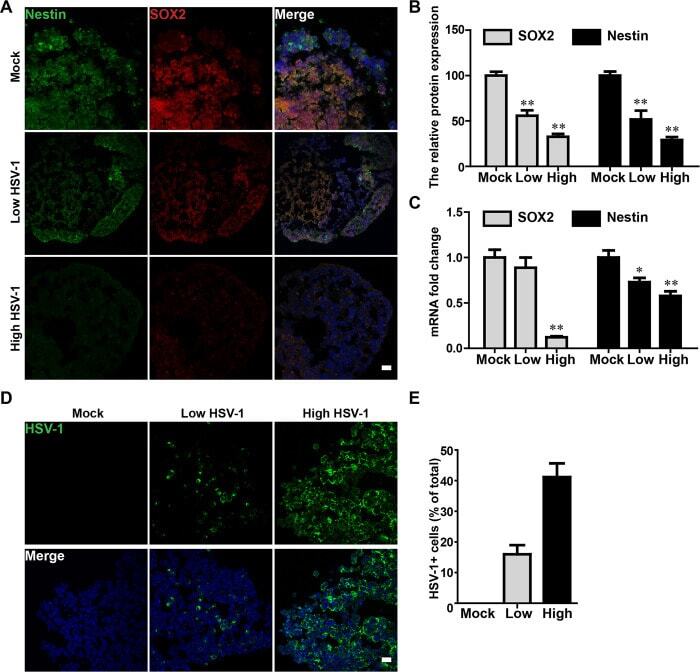
- Fig 4 HSV-1 infection impaired neurogenesis in neuroepithelial buds. (A) The immunofluorescence staining for Nestin and SOX2 in the neuroepithelial buds at 18 days after 3 days with HSV-1 infection (Mock, Low infection, and High infection). Scale bars: 25 mum. The images were taken Images were captured on a Leica TCS SP8 STED confocal microscope. (B) Relative fluorescence intensity statistics of SOX2 and Nestin expressions were shown in different groups. Specifically, the expression of SOX2 was calculated by dividing the integrated optical density (IOD) with the total area of the nucleus, and the expression of Nestin was calculated by dividing the IOD with the total area of the cytoplasm. Images were prepared using ImageJ software (NIH, MD, USA). Data represent the mean +- SEM. *p < 0.05, **p < 0.01 by ANOVA (n = 3 per sample). (C) The mRNA expressions of Nestin and SOX2 were identified by RT-PCR. Data represent the mean +- SEM. *p < 0.05, **p < 0.01 by ANOVA (n = 4 per sample). (D) The immunofluorescence staining on the neuroepithelial buds was performed for detecting positive HSV-1 gE envelop protein at 18 day after 3 days with HSV-1 infection. Scale bars: 25 mum. (E) Bar graphs showing the percentages of HSV-1-positive cells in the neuroepithelial buds. Data represent the mean +- SEM from four experiments.
- Conjugate
- Green dye
- Submitted by
- Invitrogen Antibodies (provider)
- Main image
- Experimental details
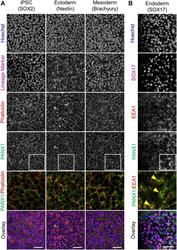
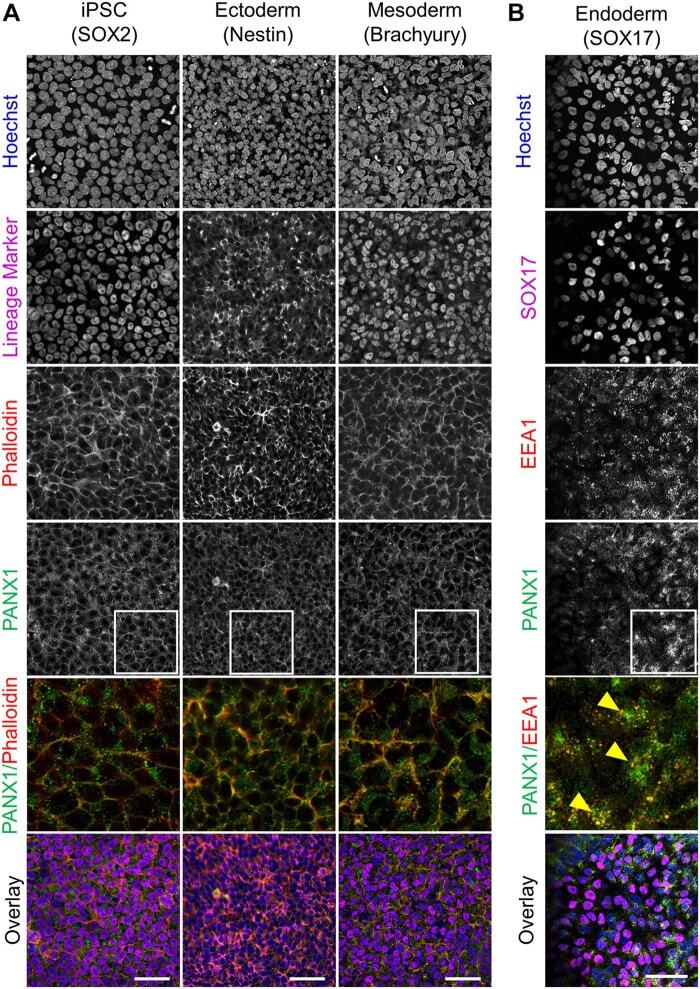
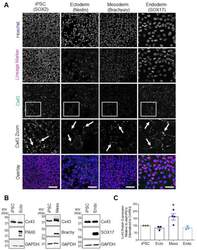
- FIGURE 4 PANX1 is differentially localized in the three embryonic germ layers. (A) Immunofluorescent evaluation of PANX1 (green) demonstrates primarily cell surface localization in iPSCs, ectoderm and mesoderm with lesser intracellular pools. Nuclei (Hoechst, blue); lineage markers (SOX2, Nestin, Brachyury, magenta); Actin (phalloidin, red). (B) In endoderm cells PANX1 is localized intracellularly where it partially overlaps with early endosomes (EEA1, red; SOX17, magenta). Inset: regions of interest zoomed in to highlight regional PANX1 localization. Brightness and contrast were equally adjusted across conditions in FIJI. Scale bar = 50 mum.
- Conjugate
- Green dye
- Submitted by
- Invitrogen Antibodies (provider)
- Main image
- Experimental details
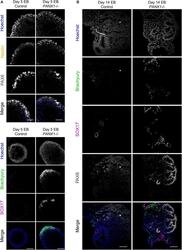
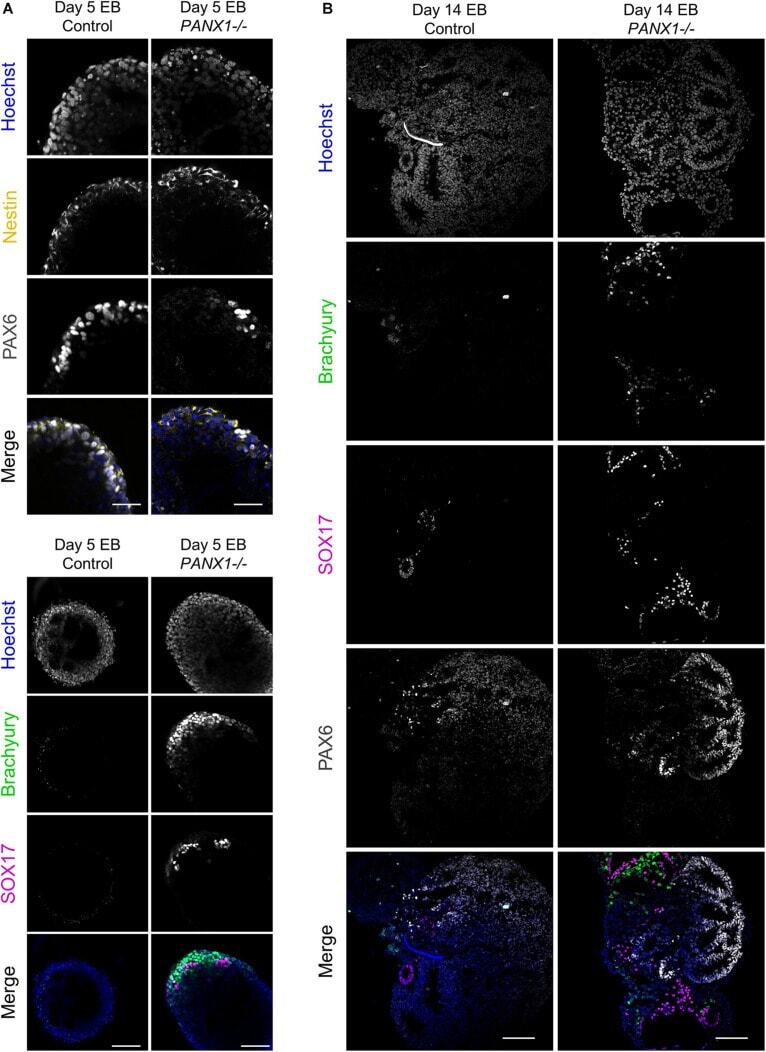
- FIGURE 6 Immunofluorescent analysis of PANX1-/- embryoid bodies. (A) Immunofluorescence of ectoderm (Nestin, yellow; PAX6, gray), mesoderm (Brachyury, green) and endoderm (SOX17, magenta) in control and PANX1-/- day 5 whole mount EBs. (B) After 14 days of differentiation, control and PANX1-/- EBs were cryosectioned and evaluated for germ lineage expression. Equal brightness contrast enhancements were made in FIJI for picture clarity. Nuclei (Hoechst, blue). Scale bar = 100 mum.
- Conjugate
- Green dye
- Submitted by
- Invitrogen Antibodies (provider)
- Main image

- Experimental details
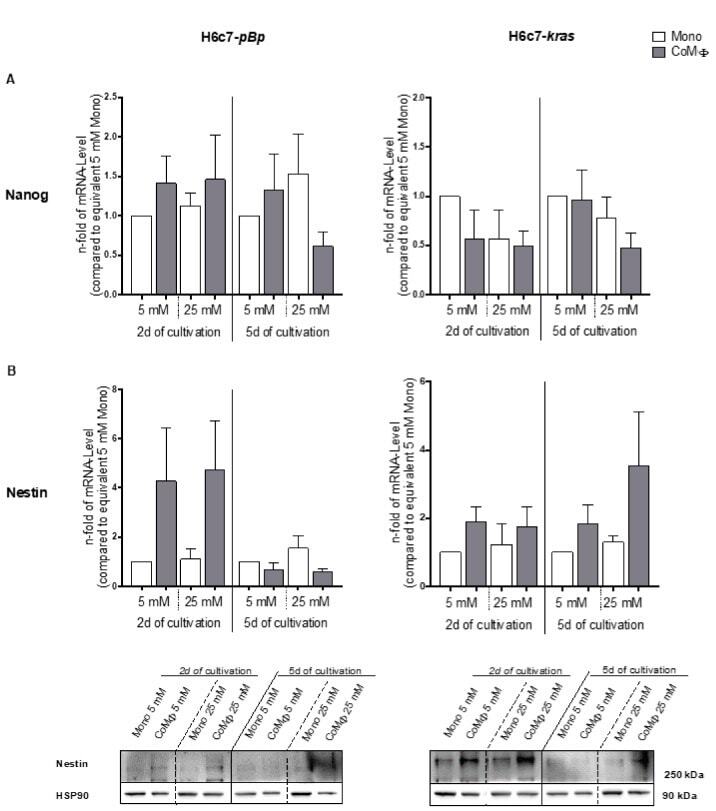
- Figure 3 The presence of M1 macrophages and hyperglycemia changes the expression of CSC marker genes in PDEC. H6c7- pBp or H6c7- kras cells were cultivated in mono- or coculture with M1-polarized macrophages (MPhi) under normo- or hyperglycemic conditions (5 or 25 mM of d -glucose) for 2 or 5 days. The epithelial cells were separated from direct coculture with macrophages via CD11b-MACS depletion of M1-MPhi or harvested from monoculture and used for qRT-PCR analysis. The relative mRNA levels of Nanog ( A ) and Nestin ( B ) for both cell lines are depicted. They are normalized to the housekeeping gene GAPDH and presented as n -fold expression compared with the monocultured 5 mM sample from the equivalent cultivation timespan. Normally distributed data are presented as mean and standard error of mean. n = 4 for 2-day culture, n = 7 for 5-day culture. In ( B ), protein levels of Nestin are also depicted; Hsp90 was used as loading control. A representative of three independent experiments is shown.
- Conjugate
- Green dye
- Submitted by
- Invitrogen Antibodies (provider)
- Main image
- Experimental details
- Figure 2 Cx43 protein expression and localization in iPSCs and cells of each germ lineage. ( A ) Representative immunofluorescent confocal micrographs, demonstrating Cx43 (green) localization in control iPSCs (SOX2, iPSCs: purple) and after directed differentiation toward the three germ lineages (Nestin, ectoderm; Brachyury, mesoderm; SOX17, endoderm: purple) and nuclei (Hoechst, nuclei: blue). Cx43 forms large puncta (white arrows) at the cell surface indicative of gap junction plaques. Scale bars = 50 um. ( B ) Representative Western blots and ( C ) densitometric analysis of total Cx43 protein expression in PAX6-positive ectoderm, Brachyury-positive mesoderm, and SOX17-positive endoderm cells. * p < 0.05 compared to undifferentiated iPSCs. Data represent the standard error of the mean of 3-4 independent experiments.
- Conjugate
- Green dye

- Submitted by
- Invitrogen Antibodies (provider)
- Main image
- Experimental details
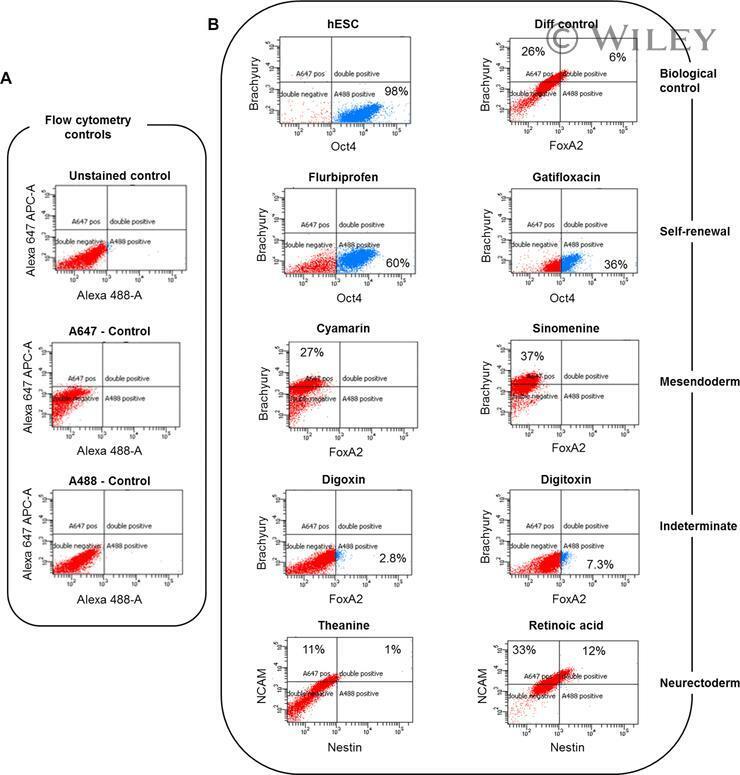
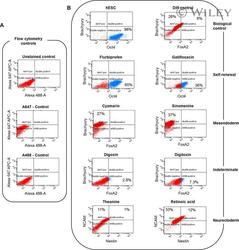
- Flow cytometric analysis for pluripotent and lineage markers expressed on day 6 of differentiation in the presence of drugs. Alexa 647-APC and Alexa 488 antibodies were used to double stain cells to look for pluripotency (Oct4+/Brachury-), mesendoderm (Oct4-/Bra+, Bra+/FoxA2-), endoderm (FoxA2+) and neurectoderm (NCAM+, NCAM+/nestin+). (A) Antibody controls using RA-treated cells. (B) Lineage-specific marker analysis.
- Conjugate
- Green dye