 Explore
 Validate
 Learn
Learn Western blot
 Immunocytochemistry
Antibody data
- Antibody Data
- Antigen structure
- References [1]
- Comments [0]
- Validations
- Immunocytochemistry [3]
- Immunohistochemistry [3]
- Flow cytometry [1]
- Other assay [1]
Submit
Validation data
Reference
Comment
Report error
- Product number
- PA5-11887 - Provider product page

- Provider
- Invitrogen Antibodies
- Product name
- Nestin Polyclonal Antibody
- Antibody type
- Polyclonal
- Antigen
- Synthetic peptide
- Reactivity
- Human
- Host
- Rabbit
- Isotype
- IgG
- Vial size
- 400 μL
- Concentration
- 0.5 mg/mL
- Storage
- Store at 4°C short term. For long term storage, store at -20°C, avoiding freeze/thaw cycles.
Submitted references The invasive proteome of glioblastoma revealed by laser-capture microdissection.
Daubon T, Guyon J, Raymond AA, Dartigues B, Rudewicz J, Ezzoukhry Z, Dupuy JW, Herbert JMJ, Saltel F, Bjerkvig R, Nikolski M, Bikfalvi A
Neuro-oncology advances 2019 May-Dec;1(1):vdz029
Neuro-oncology advances 2019 May-Dec;1(1):vdz029
No comments: Submit comment
Supportive validation
- Submitted by
- Invitrogen Antibodies (provider)
- Main image
- Experimental details
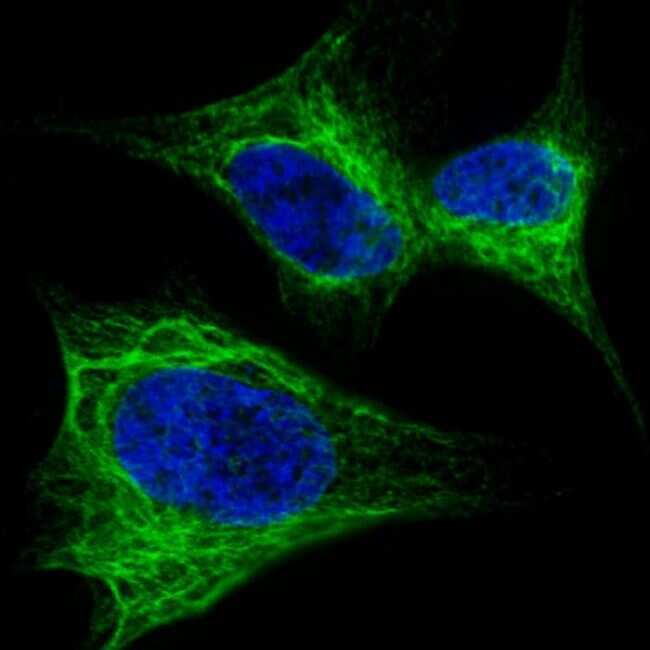
- Immunofluorescent analysis of SY5Y cells using a NES polyclonal antibody (Product # PA5-11887). SY5Y cells were fixed with 4% PFA (20 min), permeabilized with Triton X-100 (0.2%, 30 min). Cells were then incubated with a NES polyclonal antibody (Product # PA5-11887) (1:200, 2 hr at room temperature). Primary antibody detected by fluor-conjugated donkey anti-rabbit secondary antibody (green) was used (1:1000, 1hr). Nuclei were counterstained with Hoechst 33342 (blue) (10 µg/mL, 5 min).
- Submitted by
- Invitrogen Antibodies (provider)
- Main image

- Experimental details
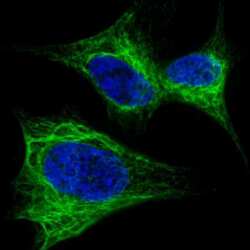
- Immunocytochemistry analysis of Nestin in SH-SY5Y cells. Samples were incubated with Nestin polyclonal antibody (Product # PA5-11887) using a dilution of 1:200 for 2 h at room temperature followed by Alexa Fluor® 488 conjugated donkey anti-rabbit at a dilution of 1:1,000 for 1hr. Cells were fixed with 4% PFA (20 min) and permeabilized with Triton X-100 (0.2%, 30 min). Nuclei were counterstained with Hoechst 33342 (blue) (10 μg/mL, 5 min). Note the highly specific localization of the Nestin (S1409) immunosignal to the intermediate filaments.

- Submitted by
- Invitrogen Antibodies (provider)
- Main image
- Experimental details
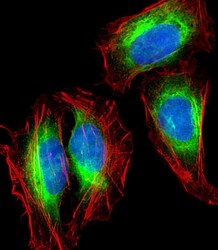
- Immunocytochemistry analysis of Nestin in U-2 OS (human bone osteosarcoma cell line) cells. Samples were incubated with Nestin polyclonal antibody (Product # PA5-11887) using a dilution of 1:25 followed by Dylight® 488-conjugated goat anti-rabbit IgG at a dilution of 1:200 (green). Cells were 4% paraformaldehyde-fixed and 0.1% Triton X-100 permeabilized. Immunofluorescence image showing cytoskeleton staining on U-2 OS cell line. Cytoplasmic actin is detected with Dylight® 554 Phalloidin at 1:100 dilution (red). The nuclear counter stain is DAPI (blue).

Supportive validation
- Submitted by
- Invitrogen Antibodies (provider)
- Main image
- Experimental details
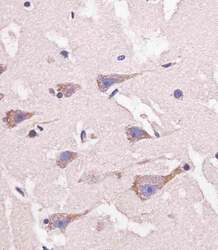
- Immunohistochemistry analysis of Nestin in paraformaldehyde-fixed, paraffin-embedded human brain tissue sections. Samples were incubated with Nestin polyclonal antibody (Product # PA5-11887) using a dilution of 1:25 for 1 hours at 37°C followed by an undiluted biotinylated goat polyvalent antibody. Tissue was fixed with formaldehyde and blocked with 3% BSA for 0.5 hour at room temperature; antigen retrieval was by heat mediation with a citrate buffer (pH 6).

- Submitted by
- Invitrogen Antibodies (provider)
- Main image
- Experimental details
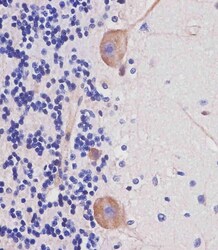
- Immunohistochemistry analysis of Nestin in paraformaldehyde-fixed, paraffin-embedded human cerebellum tissue sections. Samples were incubated with Nestin polyclonal antibody (Product # PA5-11887) using a dilution of 1:25 for 1 hours at 37°C followed by an undiluted biotinylated goat polyvalent antibody. Tissue was fixed with formaldehyde and blocked with 3% BSA for 0.5 hour at room temperature; antigen retrieval was by heat mediation with a citrate buffer (pH 6).

- Submitted by
- Invitrogen Antibodies (provider)
- Main image
- Experimental details
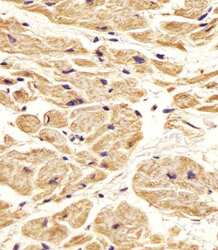
- Immunohistochemistry analysis of Nestin in paraformaldehyde-fixed, paraffin-embedded human heart tissue sections. Samples were incubated with Nestin polyclonal antibody (Product # PA5-11887) using a dilution of 1:25 for 1 hours at 37°C followed by an undiluted biotinylated goat polyvalent antibody. Tissue was fixed with formaldehyde and blocked with 3% BSA for 0.5 hour at room temperature; antigen retrieval was by heat mediation with a citrate buffer (pH 6).

Supportive validation
- Submitted by
- Invitrogen Antibodies (provider)
- Main image

- Experimental details
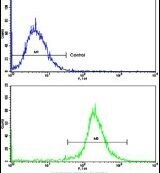
- Flow cytometry analysis of HepG2 cells using a NES polyclonal antibody (Product # PA5-11887) (bottom), compared to a negative control cell (top) at a dilution of 1:10-50, followed by a FITC-conjugated goat anti-rabbit antibody
Supportive validation
- Submitted by
- Invitrogen Antibodies (provider)
- Main image
- Experimental details
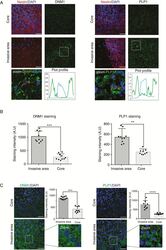
- Figure 3. DNM1 and PLP1 are more expressed in invasive areas of patient-derived xenografts and in patients. (A) Immunostaining of Nestin (red) and DNM1 or PLP1 (green) in the tumor core (upper panels) and in the invasive area (middle panels) of P3 tumors. DAPI was used for nuclear staining (blue). Scale bars: 100 um. Lower panels represent magnified images as delineated by dashed line squares, with plot profiles defined using Fiji software (defined by white lines). Both DNM1 and PLP1 are cytoplasmic. (B) The graphs represent DNM1 and PLP1 staining intensity of 10 different images from P3 core and invasive areas (Student t -test, ** P < .01; *** P < .001). (C) Immunostaining of DNM1 or PLP1 (green) in the tumor core (upper panels) and in the invasive area (lower panels) of P3 tumors. DAPI was used for nuclear staining (blue). Scale bars: 100 um. The graphs represent DNM1 and PLP1 staining intensity of 10 different images of core and invasive areas from several patient sections (Student t -test, *** P < .001; **** P < .0001).
