Explore
 Validate
 Learn
Learn46-7222-80
antibody from Invitrogen Antibodies
Targeting: IL22
IL-21, IL-22, IL-D110, IL-TIF, ILTIF, MGC79382, MGC79384, TIFa, TIFIL-23, zcyto18
 Flow cytometry
Antibody data
- Antibody Data
- Antigen structure
- References [14]
- Comments [0]
- Validations
- Flow cytometry [1]
- Other assay [15]
Submit
Validation data
Reference
Comment
Report error
- Product number
- 46-7222-80 - Provider product page

- Provider
- Invitrogen Antibodies
- Product name
- IL-22 Monoclonal Antibody (IL22JOP), PerCP-eFluor™ 710, eBioscience™
- Antibody type
- Monoclonal
- Antigen
- Other
- Description
- Description: The monoclonal antibody IL22JOP reacts with and inhibits the bioactivity of human and mouse IL-22. IL-22 is a 20 kDa member of the IL-10 cytokine family that is secreted primarily by Th17 cells, NK cells, and other T cells. Compared to IL-6 or TGF beta, IL-23 can induce greater levels of IL-22 in in vitro-differentiated Th17 cells. This observation suggests that IL-22 may be secreted by more fully differentiated Th17 cells in vivo. Recently, it was demonstrated that IL-22 could protect hosts from bacterial infection of the lungs and gut. Moreover, it has been reported that anti-CD3/CD28-induced production of IL-22 by PBMCs was elevated significantly in asthma patients compared to control patients. Flow cytometric analysis also showed that the frequencies of IL-17+IL-22+ CD4 T cells were increased in PBMCs from patients with ankylosing spondylitis and rheumatoid arthritis. IL22JOP is published to recognize rhesus IL-22. Applications Reported: This IL22JOP antibody has been reported for use in intracellular staining followed by flow cytometric analysis. Applications Tested: This IL22JOP antibody has been tested by intracellular staining and flow cytometric analysis of TH17 polarized mouse splenocytes. This can be used at less than or equal to 0.25 µg per test. A test is defined as the amount (µg) of antibody that will stain a cell sample in a final volume of 100 µL. Cell number should be determined empirically but can range from 10^5 to 10^8 cells/test. It is recommended that the antibody be carefully titrated for optimal performance in the assay of interest. PerCP-eFluor® 710 can be used in place of PE-Cy5, PE-Cy5.5 or PerCP-Cy5.5. PerCP-eFluor® 710 emits at 710 nm and is excited with the blue laser (488 nm). Please make sure that your instrument is capable of detecting this fluorochrome. For a filter configuration, we recommend using the 685 LP dichroic mirror and 710/40 band pass filter, however the 695/40 band pass filter is an acceptable alternative. Our testing indicates that PerCP-eFluor® 710 conjugated antibodies are stable when stained samples are exposed to freshly prepared 2% formaldehyde overnight at 4°C, but please evaluate for alternative fixation protocols. Excitation: 488 nm; Emission: 710 nm; Laser: Blue Laser. Filtration: 0.2 µm post-manufacturing filtered.
- Reactivity
- Human, Mouse
- Host
- Rat
- Isotype
- IgG
- Antibody clone number
- IL22JOP
- Vial size
- 25 µg
- Concentration
- 0.2 mg/mL
- Storage
- 4° C, store in dark, DO NOT FREEZE!
Submitted references Mitochondrial transcription factor A in RORγt(+) lymphocytes regulate small intestine homeostasis and metabolism.
A Central Role for Lipocalin-2 in the Adaptation to Short-Bowel Syndrome Through Down-Regulation of IL22 in Mice.
Antibiotic-induced microbiome perturbations are associated with significant alterations to colonic mucosal immunity in rhesus macaques.
Single-cell multi-omics analysis presents the landscape of peripheral blood T-cell subsets in human chronic prostatitis/chronic pelvic pain syndrome.
ATF3 Sustains IL-22-Induced STAT3 Phosphorylation to Maintain Mucosal Immunity Through Inhibiting Phosphatases.
CXCL4 is a novel inducer of human Th17 cells and correlates with IL-17 and IL-22 in psoriatic arthritis.
Loss of NF-κB1 Causes Gastric Cancer with Aberrant Inflammation and Expression of Immune Checkpoint Regulators in a STAT-1-Dependent Manner.
Regulatory Innate Lymphoid Cells Control Innate Intestinal Inflammation.
CD69 controls the uptake of L-tryptophan through LAT1-CD98 and AhR-dependent secretion of IL-22 in psoriasis.
Antibiotics in neonatal life increase murine susceptibility to experimental psoriasis.
Interleukin-22 promotes T helper 1 (Th1)/Th17 immunity in chlamydial lung infection.
OMIP-022: Comprehensive assessment of antigen-specific human T-cell functionality and memory.
Loss of mucosal CD103+ DCs and IL-17+ and IL-22+ lymphocytes is associated with mucosal damage in SIV infection.
Opposing consequences of IL-23 signaling mediated by innate and adaptive cells in chemically induced colitis in mice.
Fu Z, Dean JW, Xiong L, Dougherty MW, Oliff KN, Chen ZE, Jobin C, Garrett TJ, Zhou L
Nature communications 2021 Jul 22;12(1):4462
Nature communications 2021 Jul 22;12(1):4462
A Central Role for Lipocalin-2 in the Adaptation to Short-Bowel Syndrome Through Down-Regulation of IL22 in Mice.
Zhang A, Sodhi CP, Wang M, Shores DR, Fulton W, Prindle T, Brosten S, O'Hare E, Lau A, Ding H, Jia H, Lu P, White JR, Hui J, Sears CL, Hackam DJ, Alaish SM
Cellular and molecular gastroenterology and hepatology 2020;10(2):309-326
Cellular and molecular gastroenterology and hepatology 2020;10(2):309-326
Antibiotic-induced microbiome perturbations are associated with significant alterations to colonic mucosal immunity in rhesus macaques.
Manuzak JA, Zevin AS, Cheu R, Richardson B, Modesitt J, Hensley-McBain T, Miller C, Gustin AT, Coronado E, Gott T, Fang M, Cartwright M, Wangari S, Agricola B, May D, Smith E, Hampel HB, Gale M, Cameron CM, Cameron MJ, Smedley J, Klatt NR
Mucosal immunology 2020 May;13(3):471-480
Mucosal immunology 2020 May;13(3):471-480
Single-cell multi-omics analysis presents the landscape of peripheral blood T-cell subsets in human chronic prostatitis/chronic pelvic pain syndrome.
Zhang M, Liu Y, Chen J, Chen L, Meng J, Yang C, Yin S, Zhang X, Zhang L, Hao Z, Chen X, Liang C
Journal of cellular and molecular medicine 2020 Dec;24(23):14099-14109
Journal of cellular and molecular medicine 2020 Dec;24(23):14099-14109
ATF3 Sustains IL-22-Induced STAT3 Phosphorylation to Maintain Mucosal Immunity Through Inhibiting Phosphatases.
Glal D, Sudhakar JN, Lu HH, Liu MC, Chiang HY, Liu YC, Cheng CF, Shui JW
Frontiers in immunology 2018;9:2522
Frontiers in immunology 2018;9:2522
CXCL4 is a novel inducer of human Th17 cells and correlates with IL-17 and IL-22 in psoriatic arthritis.
Affandi AJ, Silva-Cardoso SC, Garcia S, Leijten EFA, van Kempen TS, Marut W, van Roon JAG, Radstake TRDJ
European journal of immunology 2018 Mar;48(3):522-531
European journal of immunology 2018 Mar;48(3):522-531
Loss of NF-κB1 Causes Gastric Cancer with Aberrant Inflammation and Expression of Immune Checkpoint Regulators in a STAT-1-Dependent Manner.
O'Reilly LA, Putoczki TL, Mielke LA, Low JT, Lin A, Preaudet A, Herold MJ, Yaprianto K, Tai L, Kueh A, Pacini G, Ferrero RL, Gugasyan R, Hu Y, Christie M, Wilcox S, Grumont R, Griffin MDW, O'Connor L, Smyth GK, Ernst M, Waring P, Gerondakis S, Strasser A
Immunity 2018 Mar 20;48(3):570-583.e8
Immunity 2018 Mar 20;48(3):570-583.e8
Regulatory Innate Lymphoid Cells Control Innate Intestinal Inflammation.
Wang S, Xia P, Chen Y, Qu Y, Xiong Z, Ye B, Du Y, Tian Y, Yin Z, Xu Z, Fan Z
Cell 2017 Sep 21;171(1):201-216.e18
Cell 2017 Sep 21;171(1):201-216.e18
CD69 controls the uptake of L-tryptophan through LAT1-CD98 and AhR-dependent secretion of IL-22 in psoriasis.
Cibrian D, Saiz ML, de la Fuente H, Sánchez-Díaz R, Moreno-Gonzalo O, Jorge I, Ferrarini A, Vázquez J, Punzón C, Fresno M, Vicente-Manzanares M, Daudén E, Fernández-Salguero PM, Martín P, Sánchez-Madrid F
Nature immunology 2016 Aug;17(8):985-96
Nature immunology 2016 Aug;17(8):985-96
Antibiotics in neonatal life increase murine susceptibility to experimental psoriasis.
Zanvit P, Konkel JE, Jiao X, Kasagi S, Zhang D, Wu R, Chia C, Ajami NJ, Smith DP, Petrosino JF, Abbatiello B, Nakatsukasa H, Chen Q, Belkaid Y, Chen ZJ, Chen W
Nature communications 2015 Sep 29;6:8424
Nature communications 2015 Sep 29;6:8424
Interleukin-22 promotes T helper 1 (Th1)/Th17 immunity in chlamydial lung infection.
Peng Y, Gao X, Yang J, Shekhar S, Wang S, Fan Y, Zhao W, Yang X
Molecular medicine (Cambridge, Mass.) 2014 Mar 20;20(1):109-19
Molecular medicine (Cambridge, Mass.) 2014 Mar 20;20(1):109-19
OMIP-022: Comprehensive assessment of antigen-specific human T-cell functionality and memory.
Graves AJ, Padilla MG, Hokey DA
Cytometry. Part A : the journal of the International Society for Analytical Cytology 2014 Jul;85(7):576-9
Cytometry. Part A : the journal of the International Society for Analytical Cytology 2014 Jul;85(7):576-9
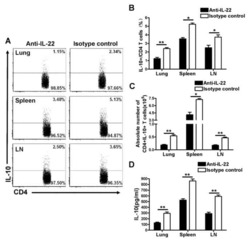
Loss of mucosal CD103+ DCs and IL-17+ and IL-22+ lymphocytes is associated with mucosal damage in SIV infection.
Klatt NR, Estes JD, Sun X, Ortiz AM, Barber JS, Harris LD, Cervasi B, Yokomizo LK, Pan L, Vinton CL, Tabb B, Canary LA, Dang Q, Hirsch VM, Alter G, Belkaid Y, Lifson JD, Silvestri G, Milner JD, Paiardini M, Haddad EK, Brenchley JM
Mucosal immunology 2012 Nov;5(6):646-57
Mucosal immunology 2012 Nov;5(6):646-57
Opposing consequences of IL-23 signaling mediated by innate and adaptive cells in chemically induced colitis in mice.
Cox JH, Kljavin NM, Ota N, Leonard J, Roose-Girma M, Diehl L, Ouyang W, Ghilardi N
Mucosal immunology 2012 Jan;5(1):99-109
Mucosal immunology 2012 Jan;5(1):99-109
No comments: Submit comment
Supportive validation
- Submitted by
- Invitrogen Antibodies (provider)
- Main image
- Experimental details
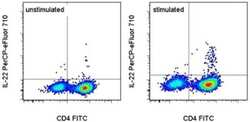
- Th17 polarized mouse splenocytes either unstimulated (left) or stimulated with Cell Stimulation Cocktail (plus protein transport inhibitors) (500X) (right) were intracellularly stained with Anti-Mouse CD4 FITC (Product # 11-0042-82) and 0.125 µg of Anti-Human/Mouse IL-22 PerCP-eFluor® 710. Cells in the lymphocyte gate were used for analysis.

Supportive validation
- Submitted by
- Invitrogen Antibodies (provider)
- Main image
- Experimental details
- NULL
- Submitted by
- Invitrogen Antibodies (provider)
- Main image

- Experimental details
- NULL

- Submitted by
- Invitrogen Antibodies (provider)
- Main image
- Experimental details
- NULL

- Submitted by
- Invitrogen Antibodies (provider)
- Main image

- Experimental details
- NULL

- Submitted by
- Invitrogen Antibodies (provider)
- Main image
- Experimental details
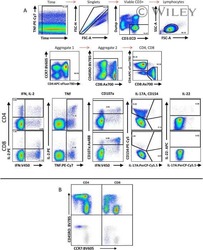
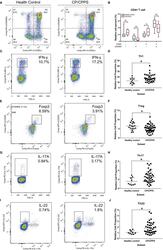
- FIGURE 5 Flow cytometry revealed central memory T cell, Th1, Th17, Th22 and Treg proportions increased in PBMCs derived from CP/CPPS patients than healthy controls. PBMCs were incubated with various fluorescein-labelled antigens for surface staining. PerCP/Cyanine5.5-conjugated CD3 and FITC-conjugated CD4 were used for the central memory T cell, Th1, Th17 and Th22 cell staining, and PE-conjugated CD25 and FITC-conjugated CD4 were incubated for staining Treg cells. After fixing and permeabilizing with cell fixation/permeabilization kit, (A) for samples staining central memory T cells were incubated with PE-conjugated CD45RA and APC-conjugated CD62L; (C) for samples staining, Th1 cells were incubated with PE-conjugated IFN-gamma; (E) for samples staining, Treg cells were incubated with eFluor 660-conjugated FoxP3; (G) for samples staining, Th17 cells were incubated with PE-conjugated IL-17A; and (I) for samples staining, Th22 cells were incubated with PE-conjugated IL-17A and APC-conjugated IL-22. The quantification data were presented in B, D, F, H and J. * P < 0.05; PBMC, peripheral blood mononuclear cell

- Submitted by
- Invitrogen Antibodies (provider)
- Main image

- Experimental details
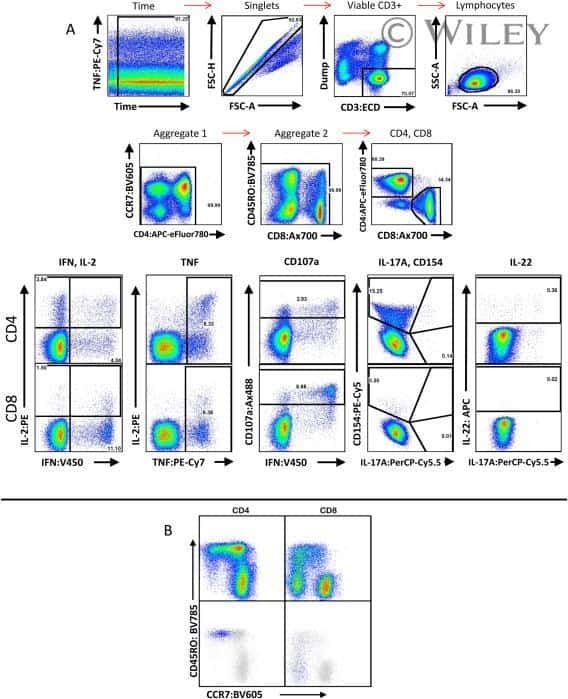
- Fig. 4 Gene profiling reveals tissue-specific transcriptomic signature of gammadeltaT17 cells. a Left panel, principal component analysis (PCA) plot of the RNA-seq of Tfam-sufficient splenic (Sp), small intestinal (SI), and large intestinal (LI) gammadeltaT17 cells from 3-week-old ( n = 3 for each group) mice. gammadeltaT17 cells of each sample were sorted from an individual mouse. Right panel, Euclidean distance comparison of the transcriptome of each splenic gammadeltaT17 cell sample and the mean intestine centroid vs. the mean small intestine centroid to each large intestinal gammadeltaT17 cell sample ( n = 3 for each group) (*** P = 0.0002). b Heatmap of tissue-specific genes (TSGs) identified by the RNA-seq in Sp, SI, and LI gammadeltaT17 cells. Genes were ranked in a descending order based on the fold changes of expression (Sp/[SI and LI average mean]; [SI and LI average mean]/Sp). c RNA-seq FPKM values of Ahr direct target genes of Sp, SI, and LI gammadeltaT17 cells (mean +- SD) ( n = 3 for each group) (Sp vs. SI: Ahr , *** P = 0.0005, Ahrr , ** P = 0.0037, Asb2 , *** P = 0.0004, Cd93 , **** P < 0.0001, Cd160 , *** P = 0.0002, Gem , ** P = 0.0096, Hic1 , *** P = 0.0002, Il17a , **** P < 0.0001, Il22 , * P = 0.0180, Kit , *** P = 0.0004, Nuerl3 , **** P < 0.0001, Osgin1 , *** P = 0.0002, Vps37b , **** P < 0.0001; Sp vs. LI: Ahr , * P = 0.0460, Ahrr , P = 0.0506, Asb2 , ** P = 0.0076, Cd93 , **** P < 0.0001, Cd160 , *** P = 0.0001, Gem , * P = 0.0108, Hic1 , *** P = 0.00

- Submitted by
- Invitrogen Antibodies (provider)
- Main image
- Experimental details
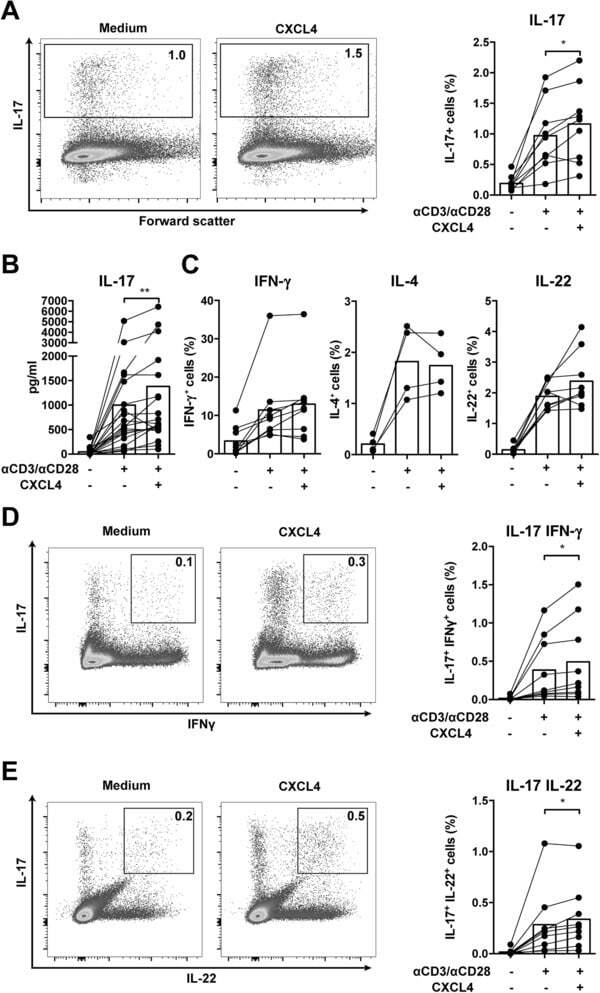
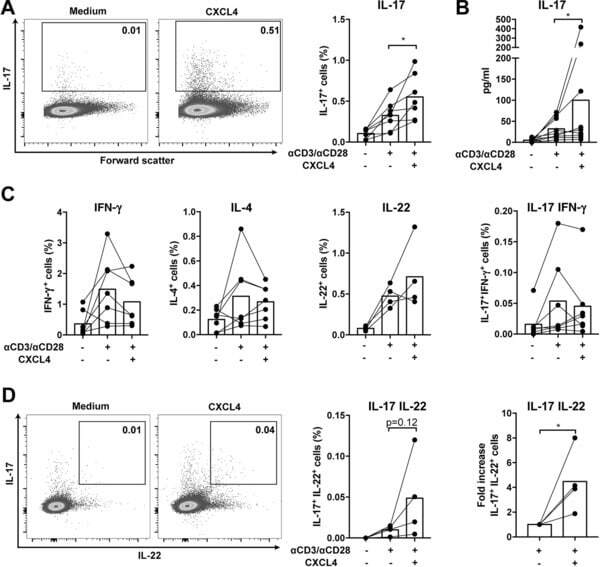
- Figure 1 CXCL4 increases the percentage of IL-17 producing cells in CD3/CD28-stimulated human CD4 + T cells. CD4 + T cells were isolated from healthy donors and cultured with CD3/CD28 coated Dynabeads and CXCL4 for five days. (A, B) The effect of CXCL4 on IL-17 production by CD4 + T cells was assessed by (A) flow cytometric intracellular cytokine staining and (B) enzyme-linked immunosorbent assay. (C) The percentage of of IFN-gamma-, IL-4- and IL-22-producing CD4 + T cells were measured by flow cytometry. (D, E) The amount of IL-17 producing cells co-expressing IFN-gamma (D) or IL-22 (E) were measured by flow cytometry. Cells were gated on live, single cells. Means (bars) and values from each donor are shown. Data are pooled from two to four independent experiments, except for panel B from 14 independent experiments, with one to four donor samples per experiment. Each dot on the bar graphs represent a single donor and paired t -test was used for statistical analysis. * p
- Submitted by
- Invitrogen Antibodies (provider)
- Main image

- Experimental details
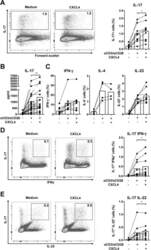
- Figure 2 CXCL4 induces IL-17 producing cells differentiated from naive human CD4 + T cells. Naive CD4 + T cells were purified by fluorescence-activated cell sorting and cultured with CD3/CD28 coated Dynabeads and CXCL4 for seven days. (A, B) The effect of CXCL4 on IL-17 production by CD4 + T cells was assessed by (A) flow cytometric intracellular cytokine staining and (B) enzyme-linked immunosorbent assay. (C) The levels of IFN-gamma-, IL-4-, IL-22-, and IL-17/IFN-gamma-producing CD4 + T cells were measured by flow cytometry. (D) The amount of IL-17 producing cells co-expressing or IL-22 was measured by flow cytometry. Cells were gated on live, single cells. Means (bars) and values from each donor are shown. Data are pooled from four to 10 independent experiments, with one to two donor samples per experiment. Each dot on the bar graphs represents a single donor and paired t -test was used for statistical analysis. * p
- Submitted by
- Invitrogen Antibodies (provider)
- Main image

- Experimental details
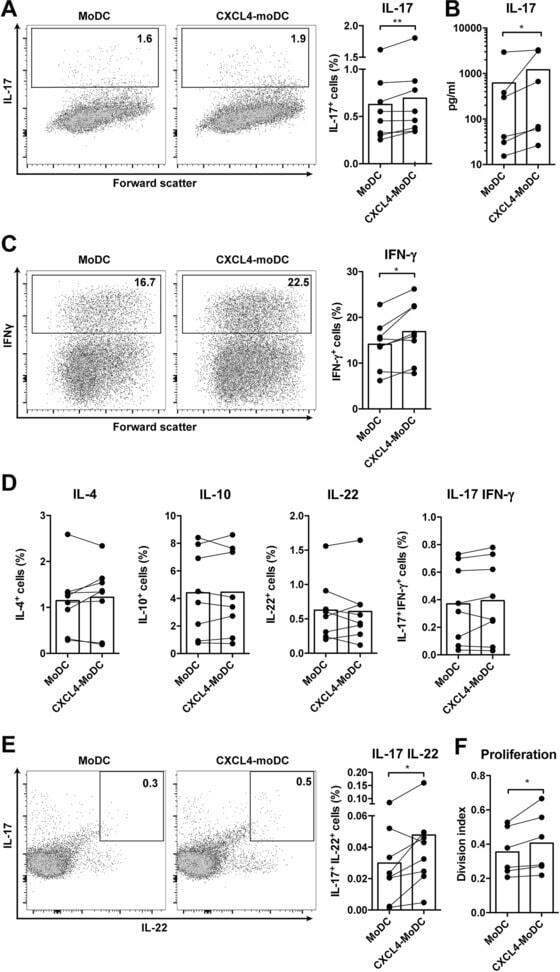
- Figure 4 CXCL4-differentiated monocyte-derived dendritic cells enhance pro-inflammatory cytokine production and proliferation by CD4 + T cells. Monocytes from healthy donors were isolated and differentiated into dendritic cells in the absence or presence of CXCL4 (moDCs or CXCL4-moDCs). moDCs were then co-cultured with autologous CD4 + T cells in the presence of superantigen from Staphylococcal Enterotoxin B (SEB) for three days and restimulated with PMA and ionomycin. (A-C) Comparison of co-culture with moDC or CXCL4-moDC on IL-17 or IFN-gamma production by CD4 + T cells was assessed by (A, C) intracellular cytokine staining and (B) enzyme-linked immunosorbent assay are shown. (D) Intracellular cytokine staining was performed for the measurement of IL-4 + , IL-10 + , IL-22 + , and IL-17 + IFN-gamma + cells gated on live CD4 + T cells. (E) The amount of IL-17 producing cells co-expressing IL-22 as measured by flow cytometry. (F) CD4 + T cells were labeled with CellTrace Violet prior co-culture and proliferation was analyzed as division index. Cells were gated on live, single, CD4 + T cells. Means (bars) and values from each donor are shown. Data are pooled from two to three independent experiments, with two to three donor samples per experiment. Each dot on the bar graphs represent a single donor and paired t -test was used for statistical analysis. * p
- Submitted by
- Invitrogen Antibodies (provider)
- Main image

- Experimental details
- Figure 9 LCN2 reduces intestinal adaptation by inhibiting IL22 expression after 75% SBR on POD 7 . ( A ) IL22 protein expression in the serum was measured by ELISA (n = 7 mice per group). ( B ) Transcriptional levels of the Il22 gene in the intestine were evaluated by quantitative PCR (n = 6 per group). ( C ) CD4 + IL22 + LPLs were quantified with flow cytometry analysis (n = 5 per group). ( D ) Representative IL22 protein expression in supernatant from Th22 cells in vitro with and without LCN2 stimulation as measured by ELISA (n = 3 per group/each experiment, each experiment was repeated 3 times). ( E-H ) Representative flow cytometry dot plots of the LPL population from small intestinal tissue. Single-cell suspensions prepared from the lamina propria were stained with CD4 and IL22 antibodies. Gate 1 identified lymphocytes based on FSC-A/SSC-A properties. The numbers within the quadrants represent the percentage of CD4 + IL22 - , CD4 + IL22 + , CD4 - IL22 - , and CD4 - IL22 + cells within the lymphocyte gate. Data are representative of analyses of 5 mice per group. Forward scatter area (FSC-A)/side scatter area (SSC-A). * P < .05, ** P < .01, and *** P < .001.

- Submitted by
- Invitrogen Antibodies (provider)
- Main image
- Experimental details
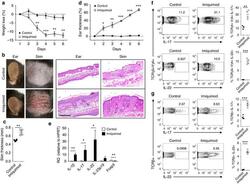
- Figure 1 Imiquimod increases IL-17 and IL-22 in both gammadelta and alphabeta T cells in skin. Skin and ear of wild type C57BL/6 mice were treated by topical application of imiquimod cream (Fougera, n =4) or control cream (Vaseline, n =3) for 6 consecutive days. ( a ) Weight loss of imiquimod and control cream treated mice monitored daily. ( b ) Photographs of imiquimod and control cream treated skin and ear; photos were taken at day 6. H&E stained ear and back skin sections of imiquimod treated and control mice. Scale bar, 200 mum. ( c ) Thickness of skin measured by Digimatic Caliper at day 6 in control and imiquimod treated mice. Data showed represents average of at least two measurements. ( d ) Ear thickness of imiquimod and control cream treated mice monitored daily. Ear thickness was measured using Digimatic Caliper. ( e ) Quantitative PCR analysis of Th17 associated cytokines and Foxp3 in skin after 6 days of imiquimod and control cream treatment. ( f ) Representative flow cytometric analysis of TCRgammadelta + Vgamma4 + IL-17 + (upper raw) and TCRgammadelta + Vgamma4 + IL-22 + cells (lower row) in the skin of control ( n =3) and imiquimod treated mice ( n =4). ( g ) Representative flow cytometric analysis of single-positive TCRbeta + IL-17 + (upper raw) or TCRbeta + IL-22 + (lower raw) cells in the skin of control ( n =3) and imiquimod treated mice ( n =4). Data representative of more than three experiments, results are shown as mean+-s.e.m., significance determined b

- Submitted by
- Invitrogen Antibodies (provider)
- Main image
- Experimental details
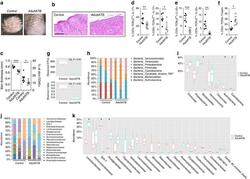
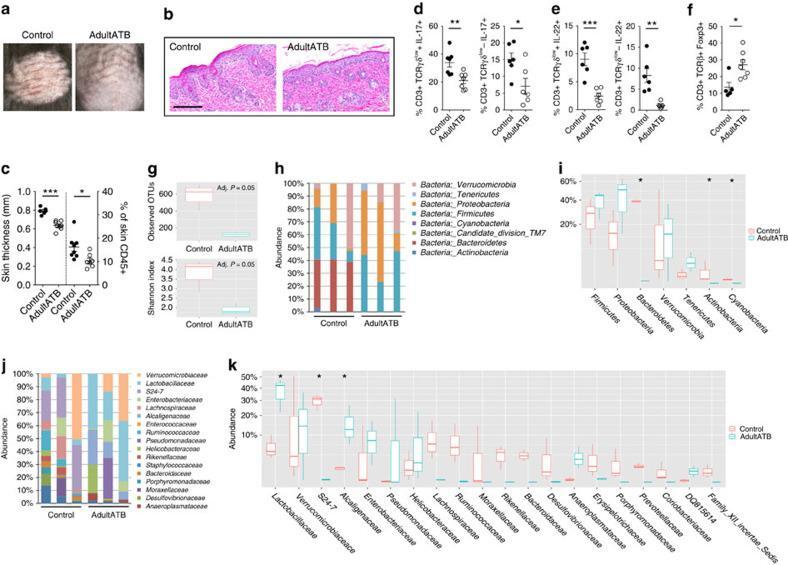
- Figure 2 Antibiotics in adult mice ameliorate psoriasis by reduction of IL-17 and IL-22 in T cells. Young adult mice (4-weeks-old) were exposed to antibiotics in drinking water (adultATB) for four weeks, and last six consecutive days followed by imiquimod treatment. ( a ) Representative photographs of back skin of control and adultATB mice followed by imiquimod treatment. Photos were taken at day 6. ( b ) H&E stained skin sections of control and adultATB mice after imiquimod treatment. Scale bar, 200 mum. ( c ) Thickness of skin measured by digimatic caliper at day 6 in control and imiquimod treated mice. Data showed represents average of at least two measurements. Increased skin infiltration in control compared adultATB mice based on staining of skin CD45 + cells. ( d ) Flow cytometric analysis of single-positive CD3 + TCRgammadelta low+ IL-17 + cells or CD3 + TCRgammadelta - IL-17 + cells in control ( n =6-7) and adultATB ( n =6-7) mice after imiquimod treatment. ( e ) Flow cytometric analysis of single-positive CD3 + TCRgammadelta low+ IL-22 + cells or CD3 + TCRgammadelta - IL-22 + cells in control ( n =6) and adultATB ( n =6) mice after imiquimod treatment. ( f ) Frequency of skin CD3 + TCRbeta + Foxp3 + cells in the skin of control ( n =5) and adultATB ( n =7) mice after imiquimod treatment. ( g ) Diversity of the microbiota (Observed OTUs, Shannon Index) in adultATB and control mice. Primary samples were collected per cage (Pooled samples from 3 independent experiments)
- Submitted by
- Invitrogen Antibodies (provider)
- Main image

- Experimental details
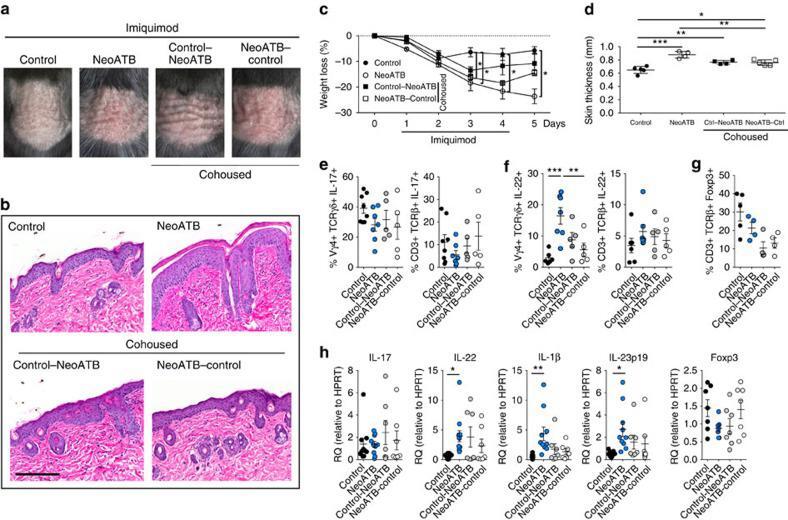
- Figure 3 Neonatal antibiotic treatment of mice increases severity of psoriasis. Breeding pairs were given antibiotics vancomycin+polymyxin B in drinking water immediately after pups delivery for 3 weeks of rearing (neoATB). After weaning, mice were housed or cohoused (mice without antibiotics treatment together with mice treated with antibiotics) in normal specific pathogen-free conditions for next 8 weeks. The mice were then treated with imiquimod cream for 4 consecutive days. ( a ) Representative photographs of back skin in controls (mice without antibiotic treatment); neonatally antibiotics treated mice (neoATB) or cohoused mice (control-neoATB resp. NeoATB-control) after imiquimod treatment. Photos were taken at day 5. ( b ) H&E stained skin sections of control, neoATB and cohoused mice after imiquimod treatment. Scale bar, 200 mum. ( c ) Weight loss of control, neoATB and cohoused mice during imiquimod treatment monitored daily. ( d ) Skin thickness of control, neoATB and cohoused mice measured at day 5. Skin thickness was measured by digimatic caliper by at least two investigators and data showed represents average of at least two measurements. ( e ) Flow cytometric analysis of single-positive TCRgammadelta + Vgamma4 + IL-17 + cells or CD3 + TCRbeta + IL-17 + cells in control ( n =8), neoATB ( n =7) and cohoused mice ( n =5) after imiquimod treatment. ( f ) Flow cytometric analysis of single-positive TCRgammadelta + Vgamma4 + IL-22 + cells or CD3 + TCRbeta + IL-22 + cel
- Submitted by
- Invitrogen Antibodies (provider)
- Main image
- Experimental details
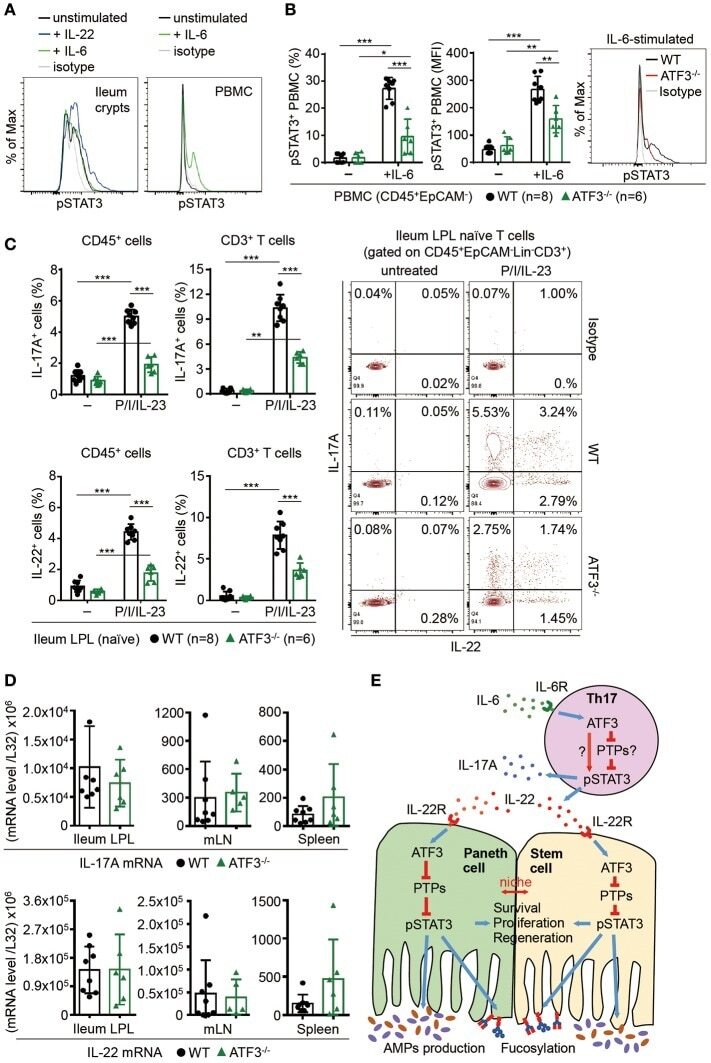
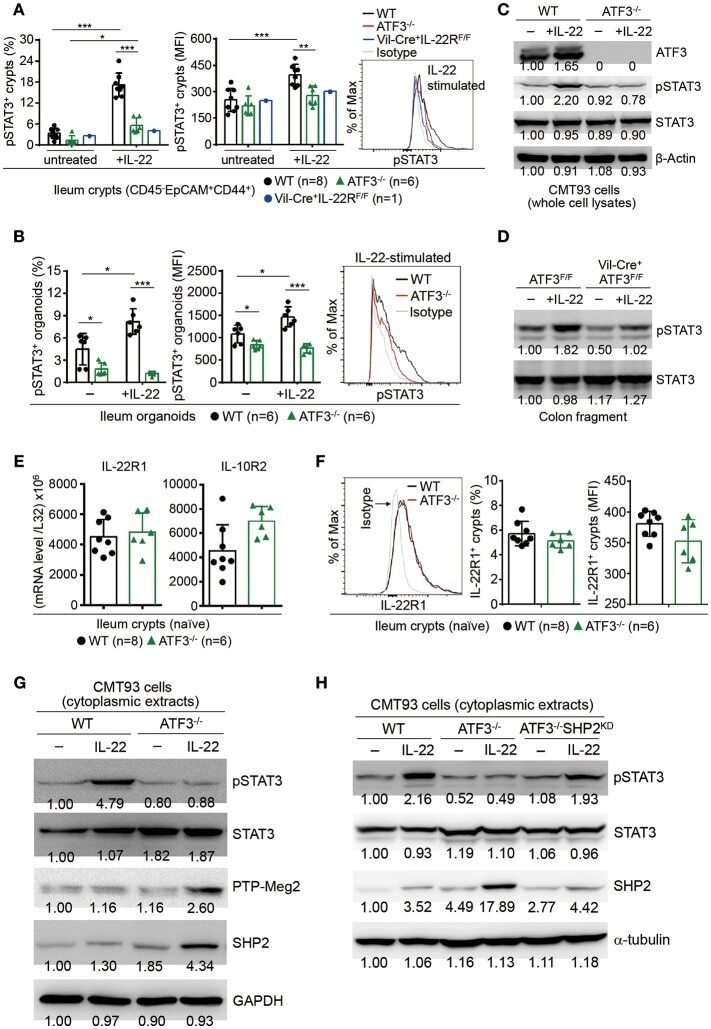
- Figure 7 ATF3 promotes IL-22-induced STAT3 phosphorylation by suppressing phosphatases. (A) Freshly isolated ileum crypts, or (B) ileum organoids at day 6 of culture, were stimulated with IL-22, followed by fixation and intracellular staining of phospho-STAT3, and analyzed by flow cytometry. Western blot analysis of (C) IL-22-stimulated CMT93 cells, or (D) IL-22-stimuated colon fragments isolated from the indicated mice, for the expression of the indicated proteins. (E) Quantitative real-time PCR analysis of IL-22R1 and IL-10R2 mRNA levels in freshly isolated ileum crypts from mice. (F) Flow cytometry analysis of IL-22R1 in freshly isolated ileum crypt cells gated on the CD45 - EpCAM + population. (G,H) Western blot analysis of unstimulated or IL-22-stimulated CMT93 cells for the indicated proteins. ATF3 -/- CMT93 cells with SHP2 knockdown (ATF3 -/- SHP2 KD ) were indicated. Images were representative of four independent experiments (G-H) . Results were from two independent experiments (A-F) . ""n"" refers to the number of mice analyzed (A,B,E,F) . Statistical analysis was done by multiple comparison in Two-way ANOVA test using Prism software. * P < 0.05, ** P < 0.005, *** P < 0.0005.
- Submitted by
- Invitrogen Antibodies (provider)
- Main image
- Experimental details
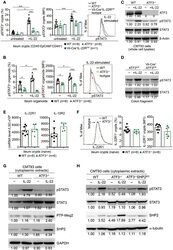
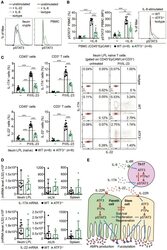
- Figure 8 ATF3 regulates IL-6-pSTAT3 signaling in intestinal Th17 cells. Flow cytometry analysis of phospho-STAT3 in (A) IL-6 or IL-22 stimulated freshly isolated ileum crypts or IL-6-stimulated peripheral blood mononuclear cell (PBMC) from wild-type mice, or in (B) IL-6-stimulated PBMC from wild-type and ATF3-deficient mice. (C) Flow cytometry analysis of intracellular IL-17A and IL-22 expression in naive lamina propria T cells from the indicated mice. Cells were treated with PMA, ionomycin and IL-23 in the presence of BFA for 4 h before analysis and gated on live CD45 + EpCAM - Lin - CD3 + population as shown. (D) Quantitative real-time PCR analysis of IL-17A and IL-22 mRNA levels in freshly isolated lamina propria (LPL) cells, mesenteric lymph nodes (mLN), or splenocytes. (E) Model of ATF3-mediated mucosal immunity via cross-regulation between IL-22-pSTAT3 signaling in epithelium (associated with AMP production and epithelial fucosylation) and IL-6-pSTAT3 signaling in Th17 cells (associated with signature IL-17A and IL-22 production). ""n"" refers to the number of mice analyzed. Statistical analysis was done by multiple comparison in Two-way ANOVA test using Prism software. * P < 0.05, ** P < 0.005, *** P < 0.0005.