Explore
 Validate
 Learn
Learn Western blot
 ELISA
ELISA Immunocytochemistry
Antibody data
- Antibody Data
- Antigen structure
- References [1]
- Comments [0]
- Validations
- Immunocytochemistry [2]
- Flow cytometry [5]
- Other assay [1]
Submit
Validation data
Reference
Comment
Report error
- Product number
- MA5-23917 - Provider product page

- Provider
- Invitrogen Antibodies
- Product name
- Folate Receptor alpha Monoclonal Antibody (548908)
- Antibody type
- Monoclonal
- Antigen
- Recombinant full-length protein
- Description
- In direct ELISAs, no cross-reactivity with recombinant human FOLR2, 3 or 4 is observed. Reconstitute at 0.5 mg/mL in sterile PBS.
- Reactivity
- Human
- Host
- Mouse
- Isotype
- IgG
- Antibody clone number
- 548908
- Vial size
- 100 μg
- Concentration
- 0.5 mg/mL
- Storage
- -20°C, Avoid Freeze/Thaw Cycles
Submitted references Clinically translatable quantitative molecular photoacoustic imaging with liposome-encapsulated ICG J-aggregates.
Wood CA, Han S, Kim CS, Wen Y, Sampaio DRT, Harris JT, Homan KA, Swain JL, Emelianov SY, Sood AK, Cook JR, Sokolov KV, Bouchard RR
Nature communications 2021 Sep 13;12(1):5410
Nature communications 2021 Sep 13;12(1):5410
No comments: Submit comment
Supportive validation
- Submitted by
- Invitrogen Antibodies (provider)
- Main image

- Experimental details
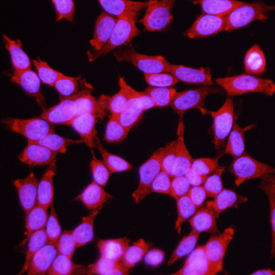
- Immunocytochemistry analysis of Folate Receptor alpha in immersion fixed MCF-7 human breast cancer cell line. Samples were incubated in Folate Receptor alpha monoclonal antibody (Product # MA5-23917) using a dilution of 10 µg/mL for 3 hours at room temperature followed by NorthernLights™ 557-conjugated Anti-Mouse IgG Secondary Antibody (red) and counterstained with DAPI (blue).
- Submitted by
- Invitrogen Antibodies (provider)
- Main image
- Experimental details
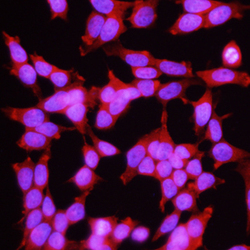
- Immunocytochemistry analysis of Folate Receptor alpha in immersion fixed MCF-7 human breast cancer cell line. Samples were incubated in Folate Receptor alpha monoclonal antibody (Product # MA5-23917) using a dilution of 10 µg/mL for 3 hours at room temperature followed by NorthernLights™ 557-conjugated Anti-Mouse IgG Secondary Antibody (red) and counterstained with DAPI (blue).

Supportive validation
- Submitted by
- Invitrogen Antibodies (provider)
- Main image
- Experimental details
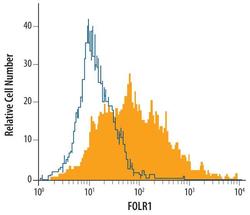
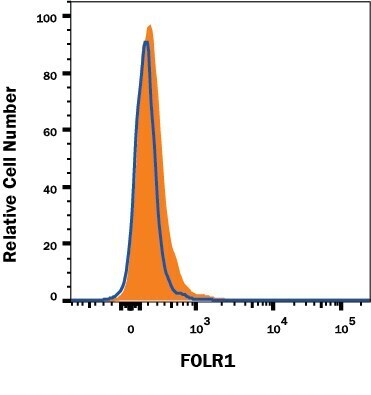
- Flow cytometric analysis of MCF-7 human breast cancer cell line was stained with mouse Anti-human FOLR1 Monoclonal Antibody (Product # MA5-23917, filled histogram) or isotype control antibodyopen histogram), followed by Phycoerythrin-conjugated Anti-mouse IgG Secondary Antibody.

- Submitted by
- Invitrogen Antibodies (provider)
- Main image

- Experimental details
- Flow cytometry of Folate Receptor alpha in MCF‚7 human breast cancer cell line. Samples were incubated in Folate Receptor alpha monoclonal antibody (Product # MA5-23917) or isotype control antibody followed by Phycoerythrin-conjugated Anti-Mouse IgG Secondary Antibody.

- Submitted by
- Invitrogen Antibodies (provider)
- Main image

- Experimental details
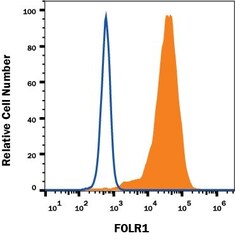
- Knockdown validation by Flow cytometry of Folate Receptor alpha in FOLR1 knockout MCF-7 human breast cancer cell line. Samples were incubated in Folate Receptor alpha monoclonal antibody (Product # MA5-23917) followed by a anti-Mouse IgG PE-conjugated secondary antibody. Cell line was stained with monoclonal antibody or isotype control antibody. No staining in the FOLR1 knockout MCF-7 cell line was observed.
- Submitted by
- Invitrogen Antibodies (provider)
- Main image
- Experimental details
- Flow cytometry of Folate Receptor alpha in MCF‚7 human breast cancer cell line. Samples were incubated in Folate Receptor alpha monoclonal antibody (Product # MA5-23917) or isotype control antibody followed by Phycoerythrin-conjugated Anti-Mouse IgG Secondary Antibody.

- Submitted by
- Invitrogen Antibodies (provider)
- Main image

- Experimental details
- Knockdown validation by Flow cytometry of Folate Receptor alpha in FOLR1 knockout MCF-7 human breast cancer cell line. Samples were incubated in Folate Receptor alpha monoclonal antibody (Product # MA5-23917) followed by a anti-Mouse IgG PE-conjugated secondary antibody. Cell line was stained with monoclonal antibody or isotype control antibody. No staining in the FOLR1 knockout MCF-7 cell line was observed.

Supportive validation
- Submitted by
- Invitrogen Antibodies (provider)
- Main image
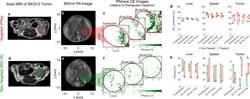
- Experimental details
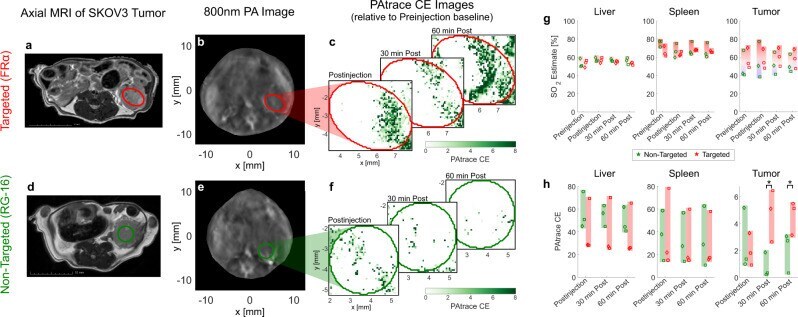
- Fig. 6 In vivo PA imaging specificity of targeted FRalpha-PAtrace in orthotopic ovarian cancer model. Results for targeted FRalpha-PAtrace (red) and non-targeted RG-16-PAtrace (green). Representative a , d axial MRI and b , e 800 nm PA image of SKOV3 tumors with ROIs indicated by red/green ellipses. MRI volumes were used to establish the position and size of tumors in PA images for ROI placement. Representative PAtrace contrast enhancement (CE) images thru postinjection time-points of c targeted FRalpha-PAtrace and f non-targeted RG-16-PAtrace. g PA-based SO 2 estimates for liver (left), spleen (middle), tumor (right) ROIs show that SO 2 does not change significantly through time, indicating no substantial physiological changes occurred during imaging. h PAtrace CE in the liver (left) and spleen (middle) ROIs suggest no significant difference between FRalpha-PAtrace and RG-16-PAtrace liver or spleen accumulation. PAtrace CE in tumor ROIs (right) presents positive enhancement for both targeted and non-targeted PAtrace immediately postinjection, but with targeted enhancement significantly greater 30 min ( p = 0.017) and 60 min ( p = 0.044) postinjection. Error bars indicate mean +- SD across three independent subjects.