Explore
 Validate
 Learn
Learn Western blot
 Immunocytochemistry
Antibody data
- Antibody Data
- Antigen structure
- References [2]
- Comments [0]
- Validations
- Immunocytochemistry [2]
- Immunohistochemistry [5]
- Other assay [2]
Submit
Validation data
Reference
Comment
Report error
- Product number
- PA5-52334 - Provider product page

- Provider
- Invitrogen Antibodies
- Product name
- USP10 Polyclonal Antibody
- Antibody type
- Polyclonal
- Antigen
- Recombinant protein fragment
- Description
- Immunogen sequence: KITPDGITKE ASYGSIDCQY PGSALALDGS SNVEAEVLEN DGVSGGLGQR ERKKKKKRPP GYYSYLKDGG DDSISTEALV NGHANSAVPN SVSAEDAEFM GDMPPPLTPR TCNSPQNSTD S Highest antigen sequence identity to the following orthologs: Mouse - 64%, Rat - 67%.
- Reactivity
- Human
- Host
- Rabbit
- Isotype
- IgG
- Vial size
- 100 μL
- Concentration
- 0.4 mg/mL
- Storage
- Store at 4°C short term. For long term storage, store at -20°C, avoiding freeze/thaw cycles.
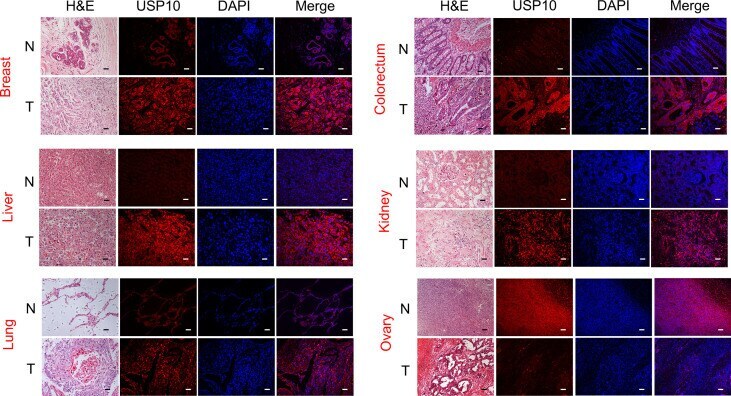
Submitted references The Prognostic Value and Immune Infiltration of USP10 in Pan-Cancer: A Potential Therapeutic Target.
Proximity-dependent biotinylation detects associations between SARS coronavirus nonstructural protein 1 and stress granule-associated proteins.
Gao D, Zhang Z, Xu R, He Z, Li F, Hu Y, Chen H, Lu J, Cao X, Liu Y, Xu Z
Frontiers in oncology 2022;12:829705
Frontiers in oncology 2022;12:829705
Proximity-dependent biotinylation detects associations between SARS coronavirus nonstructural protein 1 and stress granule-associated proteins.
Gerassimovich YA, Miladinovski-Bangall SJ, Bridges KM, Boateng L, Ball LE, Valafar H, Nag A
The Journal of biological chemistry 2021 Dec;297(6):101399
The Journal of biological chemistry 2021 Dec;297(6):101399
No comments: Submit comment
Supportive validation
- Submitted by
- Invitrogen Antibodies (provider)
- Main image

- Experimental details
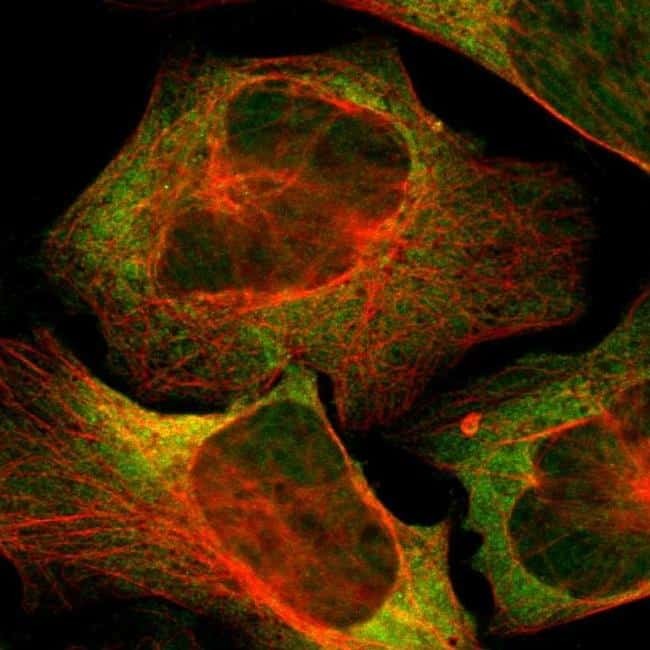
- Immunofluorescent staining of USP10 in human cell line U-2 OS shows positivity in cytoplasm & nucleus but excluded from the nucleoli. Samples were probed using an USP10 Polyclonal Antibody (Product # PA5-52334).
- Submitted by
- Invitrogen Antibodies (provider)
- Main image
- Experimental details
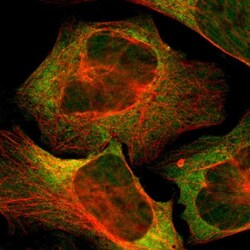
- Immunofluorecent analysis of USP10 in human cell line U-2 OS using USP10 Polyclonal Antibody (Product # PA5-52334). Staining shows localization to nucleoplasm and cytosol.

Supportive validation
- Submitted by
- Invitrogen Antibodies (provider)
- Main image
- Experimental details
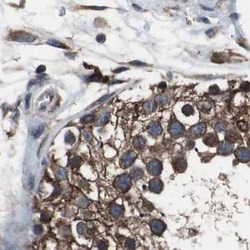
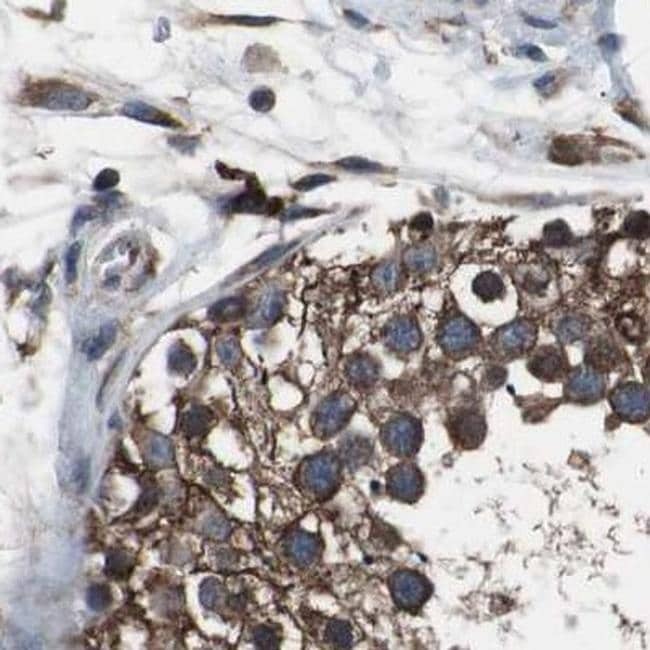
- Immunohistochemical staining of USP10 in human testis using USP10 Polyclonal Antibody (Product # PA5-52334).
- Submitted by
- Invitrogen Antibodies (provider)
- Main image
- Experimental details
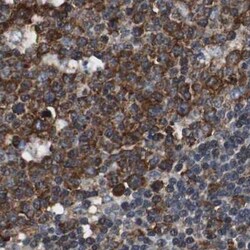
- Immunohistochemical staining of USP10 in human lymph node using USP10 Polyclonal Antibody (Product # PA5-52334).

- Submitted by
- Invitrogen Antibodies (provider)
- Main image
- Experimental details
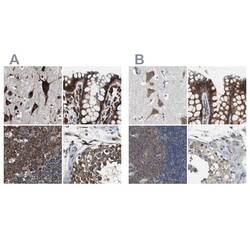
- Immunohistochemical staining of USP10 in human cerebral cortex, colon, lymph node and testis using USP10 Polyclonal Antibody (Product # PA5-52334) (A) shows similar protein distribution across tissues to an independent USP10 Polyclonal Antibody (B).

- Submitted by
- Invitrogen Antibodies (provider)
- Main image

- Experimental details
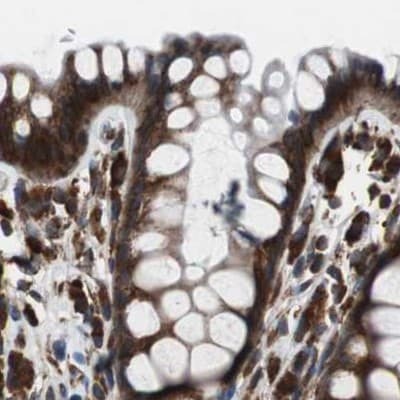
- Immunohistochemical staining of USP10 in human colon using USP10 Polyclonal Antibody (Product # PA5-52334).
- Submitted by
- Invitrogen Antibodies (provider)
- Main image
- Experimental details
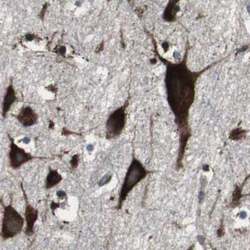
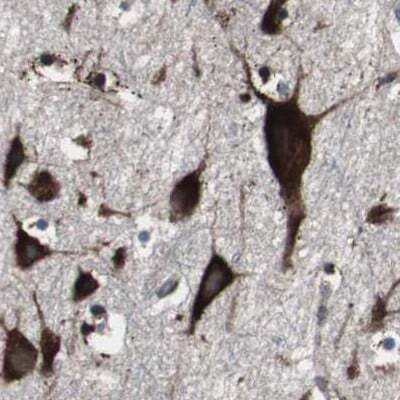
- Immunohistochemical staining of USP10 in human cerebral cortex using USP10 Polyclonal Antibody (Product # PA5-52334).
Supportive validation
- Submitted by
- Invitrogen Antibodies (provider)
- Main image

- Experimental details
- NULL
- Submitted by
- Invitrogen Antibodies (provider)
- Main image
- Experimental details
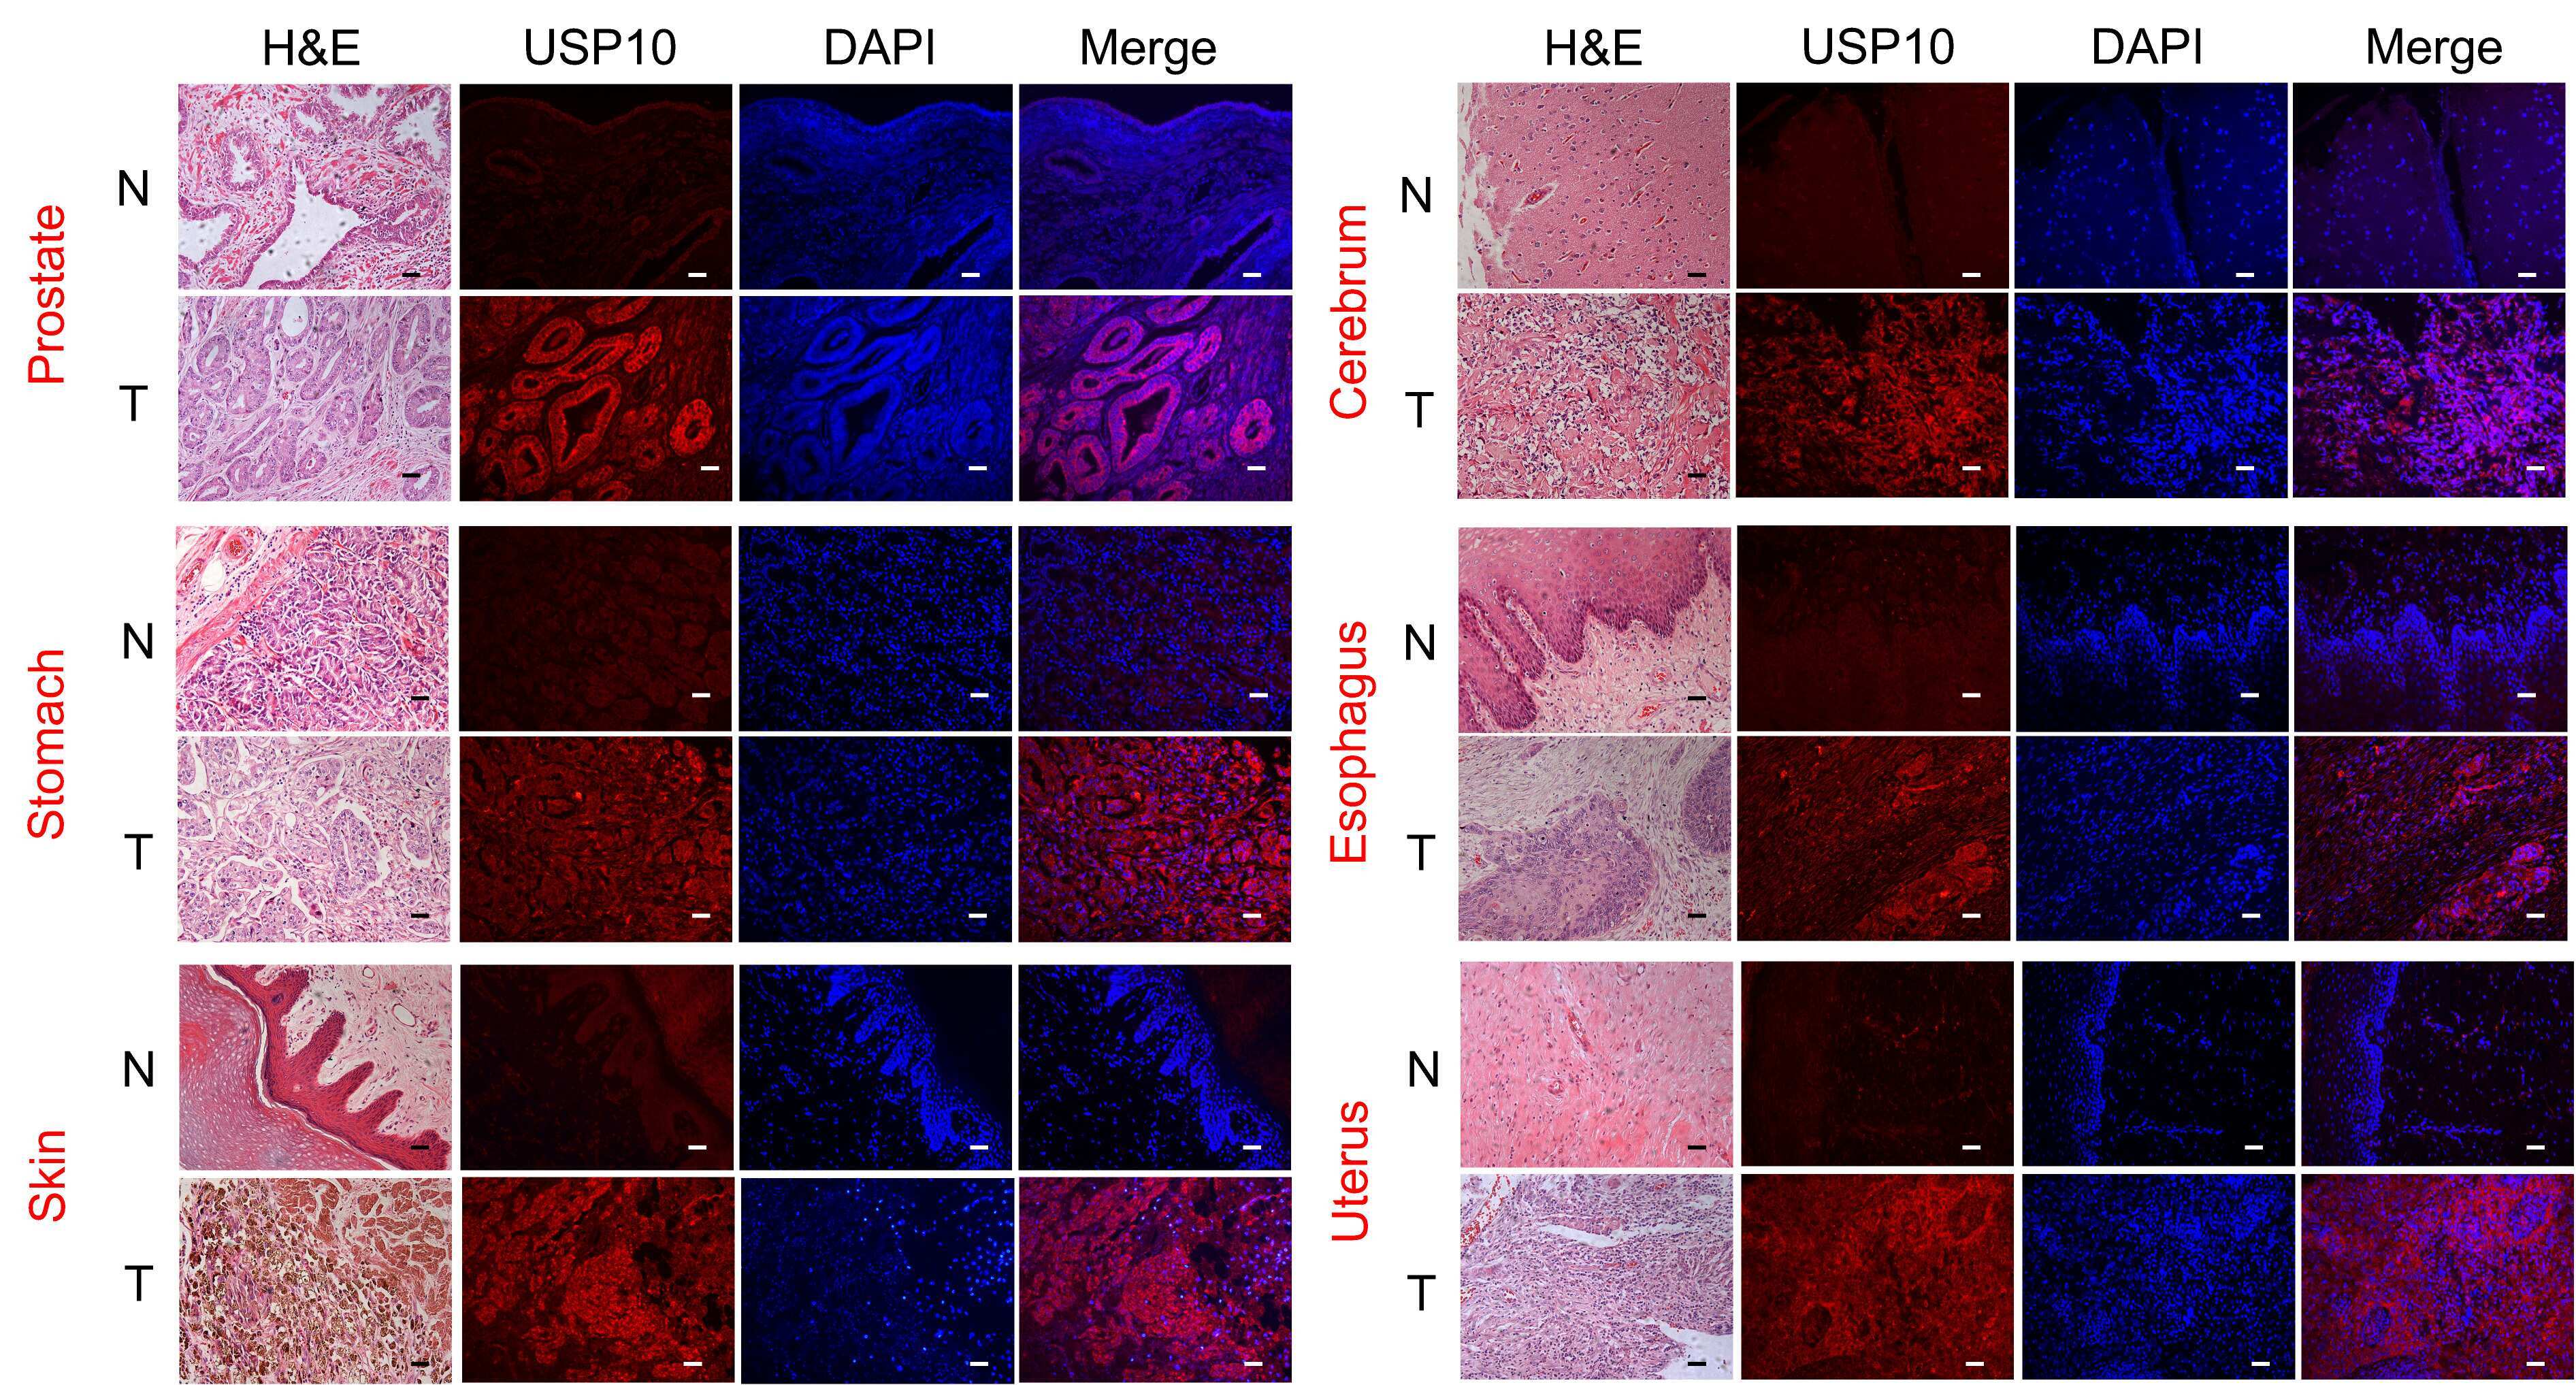
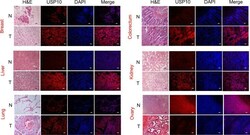
- The protein level of USP10 in different types of cancer. Representative images of H&E stained normal and tumor slides (left 1st). Immunofluorescence staining analysis (left 2nd to 4th) showing that an evident fluorescent signal in the tumor tissue sections compared with that in the control group. However, in ovarian cancer, normal tissue has a stronger fluorescent signal than tumor tissue. All scale bars = 50 mum. H&E, hematoxylin-eosin staining. N, normal tissues; T, tumor tissues.