Explore
 Validate
 Learn
Learn Immunocytochemistry
Antibody data
- Antibody Data
- Antigen structure
- References [1]
- Comments [0]
- Validations
- Immunocytochemistry [1]
- Other assay [2]
Submit
Validation data
Reference
Comment
Report error
- Product number
- PA5-66720 - Provider product page

- Provider
- Invitrogen Antibodies
- Product name
- USP42 Polyclonal Antibody
- Antibody type
- Polyclonal
- Antigen
- Recombinant protein fragment
- Description
- Immunogen sequence: TIVDKASESSD PSAYQNQPGS SEAVSPGDMD AGSASWGAVS SLNDVSNHTL SLGPVPGAVV YSSSSVPDKS KPSPQKDQAL GDGIAPPQKV L Highest antigen sequence identity to the following orthologs - mouse 83%, rat 85%.
- Reactivity
- Human
- Host
- Rabbit
- Isotype
- IgG
- Vial size
- 100 μL
- Concentration
- 0.6 mg/mL
- Storage
- Store at 4°C short term. For long term storage, store at -20°C, avoiding freeze/thaw cycles.
Submitted references USP42 drives nuclear speckle mRNA splicing via directing dynamic phase separation to promote tumorigenesis.
Liu S, Wang T, Shi Y, Bai L, Wang S, Guo D, Zhang Y, Qi Y, Chen C, Zhang J, Zhang Y, Liu Q, Yang Q, Wang Y, Liu H
Cell death and differentiation 2021 Aug;28(8):2482-2498
Cell death and differentiation 2021 Aug;28(8):2482-2498
No comments: Submit comment
Supportive validation
- Submitted by
- Invitrogen Antibodies (provider)
- Main image

- Experimental details
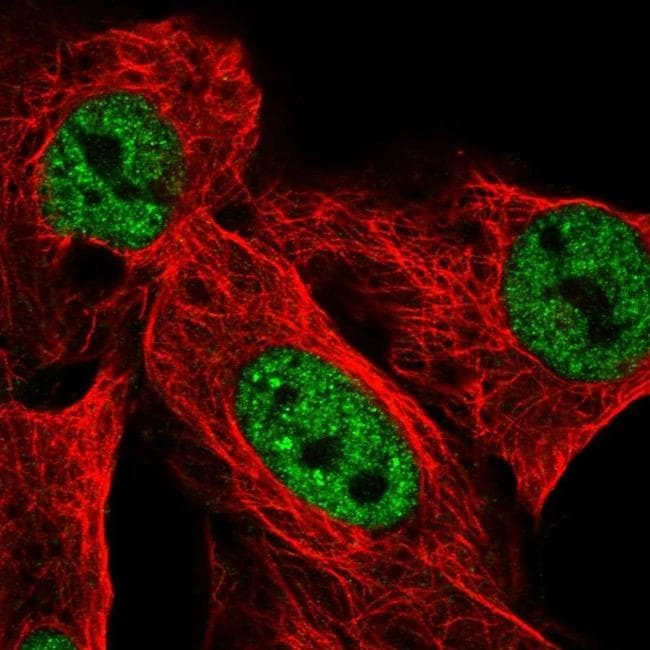
- Immunofluorescent staining of USP42 in human cell line U-2 OS shows localization to nucleoplasm. Samples were probed using an USP42 Polyclonal Antibody (Product # PA5-66720).
Supportive validation
- Submitted by
- Invitrogen Antibodies (provider)
- Main image
- Experimental details
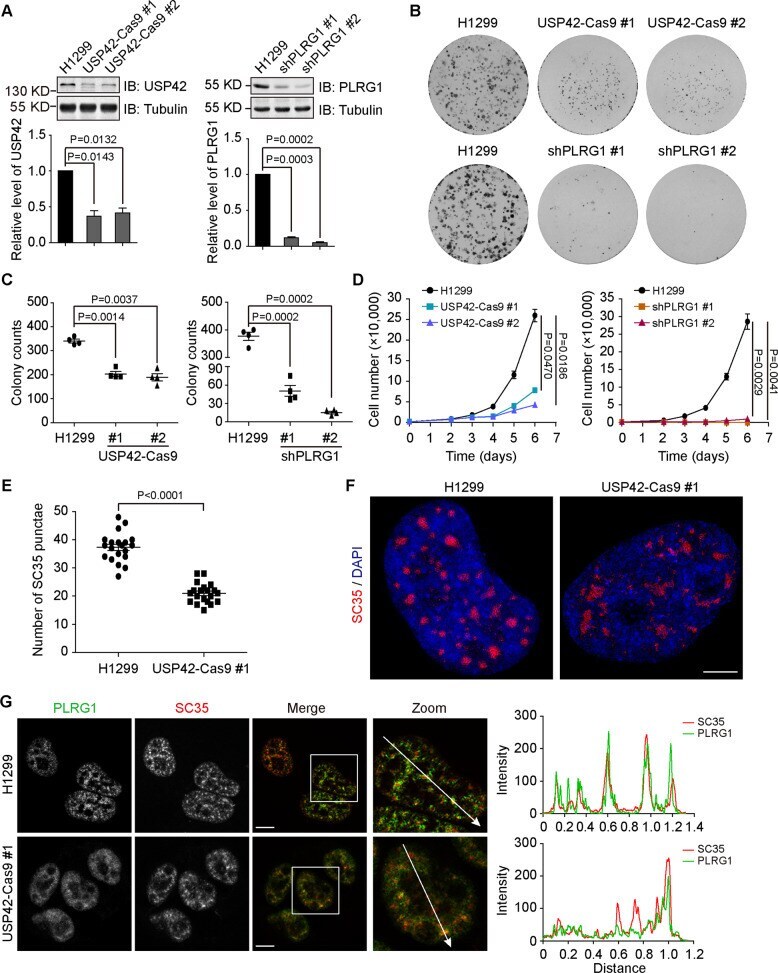
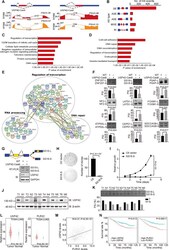
- Fig. 6 USP42 depletion influences cell growth, nuclear speckles, and PLRG1 distribution. A The efficiency of USP42 and PLRG1 depletion was determined by immunoblotting in indicated stable H1299 cell lines. Tubulin blots confirm equal loading. Below column charts show quantification data of band intensities ( n = 3). P values were calculated by paired t -test. Error bars represent standard error of the mean. B Colony formation assays of parental H1299 cells and stable clones with USP42 and PLRG1 depletion as indicated. C Quantification data show colony numbers from indicated cell lines. P values were calculated by performing two-tailed Student's t -test. Error bars represent standard error of the mean, n = 4. D Cell proliferation assays of control and stable H1299 cells with USP42 depletion (USP42-Cas9 #1 and USP42-Cas9 #2) and PLRG1 knockdown (shPLRG1 #1 and shPLRG1 #2). Cell numbers over a 6-day incubation period were recorded and plotted ( n = 3). Error bars represent the standard error of the mean, with P value calculated by Student's t -test. E The numbers of SC35 foci in parental and USP42-depleted H1299 cells were quantified and plotted ( n = 3). P value was calculated by performing two-tailed Student's t test. Error bars represent standard error of the mean. F Super-resolution microscopy (SIM) images showing the morphology of nuclear speckles marked with SC35 in parental and USP42-depleted H1299 cells. Nucleus was stained with DAPI. Scale bar = 5 mum. G Immunofluoresce
- Submitted by
- Invitrogen Antibodies (provider)
- Main image
- Experimental details
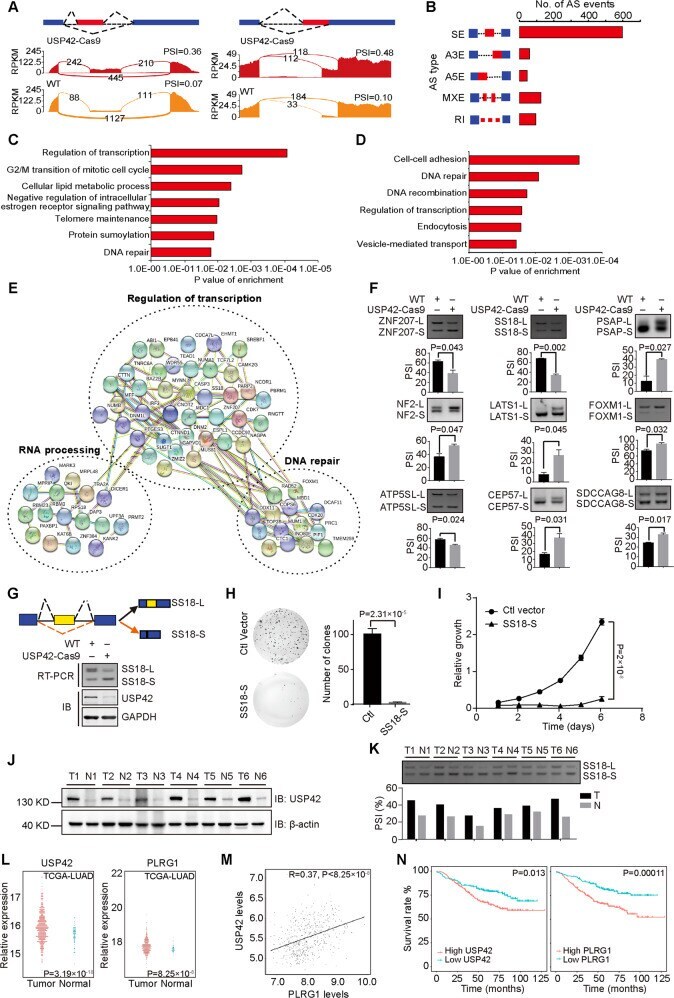
- Fig. 7 USP42 modulates alternative splicing of cancer-related genes through regulating PLRG1. A Examples of alternative exon and alternative use of 3' ss affected by USP42. Numbers of exon-junction reads and PSI were indicated. B Quantification of different AS events affected by USP42. C Gene-ontology of USP42-regulated AS targets. Fisher exact P values were plotted. D Gene ontology of AS targets regulated by both USP42 and PLRG1. Fisher exact P values were plotted. E Functional association network of USP42- and PLRG1-regulated AS targets. F Validation of candidate AS events by semi-quantitative RT-PCR using parental and USP42-Cas9 H1299 cells. The PSI means from three independent experiments were plotted ( P values obtained from paired t -test). Error bars represent standard error of the mean. G The splicing change of SS18 was measured with parental and USP42-Cas9 H1299 cells. The protein levels of USP42 were examined by immunoblotting. GAPDH was also probed as loading control. H The proliferation of H1299 cells stably transfected with SS18-S-expressing or control vector was determined by colony formation assays. All experiments were performed with three biological repeats, with quantified relative colony numbers plotted. P value was calculated by Student's t test. Error bars represent standard error of the mean. I H1299 cells stably expressing SS18-S or control were grown for 6 days, with cell numbers measured every day. The changes of cell numbers were compared to day 0. T