 Explore
 Validate
 Learn
Learn Western blot
 Immunocytochemistry
Antibody data
- Antibody Data
- Antigen structure
- References [1]
- Comments [0]
- Validations
- Immunocytochemistry [1]
- Immunohistochemistry [1]
- Flow cytometry [1]
- Chromatin Immunoprecipitation [2]
- Other assay [1]
Submit
Validation data
Reference
Comment
Report error
- Product number
- 700226 - Provider product page

- Provider
- Invitrogen Antibodies
- Product name
- IRF2 Recombinant Rabbit Monoclonal Antibody (B-80 H53L46)
- Antibody type
- Monoclonal
- Antigen
- Recombinant full-length protein
- Description
- This antibody is predicted to react with bovine based on sequence homology. Intact IgG appears on a non-reducing gel as ~150 kDa band and upon reduction generating a ~25 kDa light chain band and a ~50 kDa heavy chain. Recombinant rabbit monoclonal antibodies are produced using in vitro expression systems. The expression systems are developed by cloning in the specific antibody DNA sequences from immunoreactive rabbits. Then, individual clones are screened to select the best candidates for production. The advantages of using recombinant rabbit monoclonal antibodies include: better specificity and sensitivity, lot-to-lot consistency, animal origin-free formulations, and broader immunoreactivity to diverse targets due to larger rabbit immune repertoire.
- Reactivity
- Human, Mouse, Rat
- Host
- Rabbit
- Isotype
- IgG
- Antibody clone number
- B-80 H53L46
- Vial size
- 100 μg
- Concentration
- 0.5 mg/mL
- Storage
- Store at 4°C short term. For long term storage, store at -20°C, avoiding freeze/thaw cycles.
Submitted references Cryptotanshinone Protects Cartilage against Developing Osteoarthritis through the miR-106a-5p/GLIS3 Axis.
Ji Q, Qi D, Xu X, Xu Y, Goodman SB, Kang L, Song Q, Fan Z, Maloney WJ, Wang Y
Molecular therapy. Nucleic acids 2018 Jun 1;11:170-179
Molecular therapy. Nucleic acids 2018 Jun 1;11:170-179
No comments: Submit comment
Supportive validation
- Submitted by
- Invitrogen Antibodies (provider)
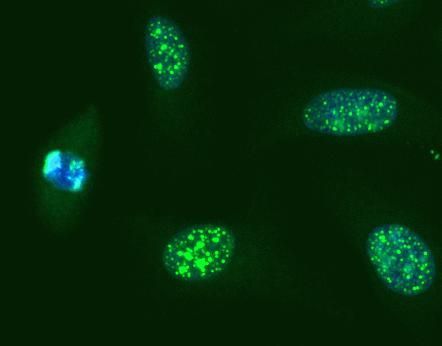
- Main image

- Experimental details
- Immunofluorescent analysis of IRF-2 in HeLa cells using an IRF-2 recombinant rabbit monoclonal antibody (Product # 700226) at a dilution of 5 µg/mL followed by detection using an Alexa Fluor 488-conjugated goat anti-rabbit secondary antibody at a dilution of 1:1000. Cells were fixed using methanol fixation. The nuclear localization of IRF2 is shown in green, while nuclei were stained using SlowFade GOLD with DAPI (Product # S36938), shown in blue.
Supportive validation
- Submitted by
- Invitrogen Antibodies (provider)
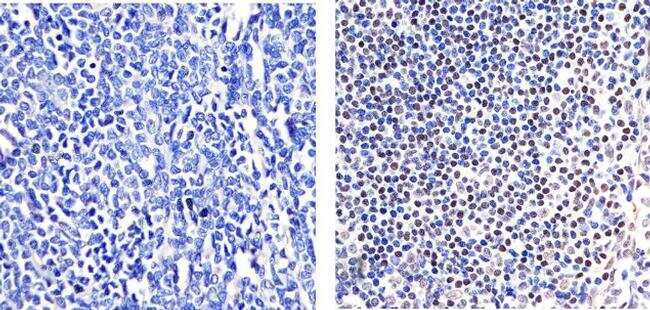
- Main image
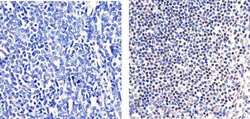
- Experimental details
- Immunohistochemistry analysis of IRF2 showing staining in the nucleus of paraffin-embedded human T cell lymphoma (right) compared to a negative control without primary antibody (left). To expose target proteins, antigen retrieval was performed using 10mM sodium citrate (pH 6.0), microwaved for 8-15 min. Following antigen retrieval, tissues were blocked in 3% H2O2-methanol for 15 min at room temperature, washed with ddH2O and PBS, and then probed with a IRF2 Recombinant Rabbit Monoclonal Antibody (Product # 700226) diluted in 3% BSA-PBS at a dilution of 1:20 overnight at 4°C in a humidified chamber. Tissues were washed extensively in PBST and detection was performed using an HRP-conjugated secondary antibody followed by colorimetric detection using a DAB kit. Tissues were counterstained with hematoxylin and dehydrated with ethanol and xylene to prep for mounting.
Supportive validation
- Submitted by
- Invitrogen Antibodies (provider)
- Main image
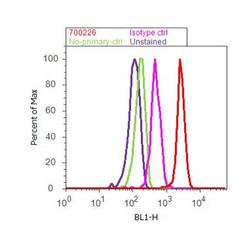
- Experimental details
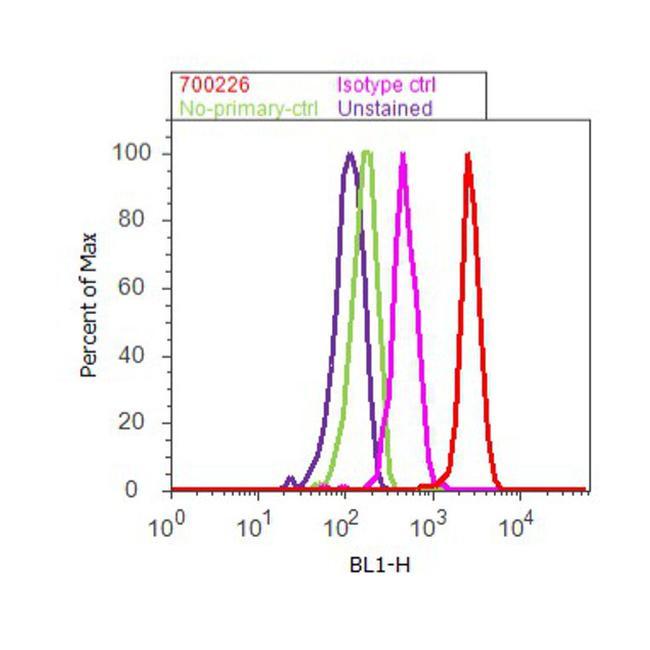
- Flow cytometry analysis of IRF-2 was done on MCF7 cells treated with IFN alpha (100ng/mL, 30 minutes). Cells were fixed with 70% ethanol for 10 minutes, permeabilized with 0.25% Triton™ X-100 for 20 minutes, and blocked with 5% BSA for 30 minutes at room temperature. Cells were labeled with ABfinity™ IRF-2 Recombinant Rabbit Monoclonal Antibody (700226, red histogram) or with rabbit isotype control (pink histogram) at 3-5 ug/million cells in 2.5% BSA. After incubation at room temperature for 2 hours, the cells were labeled with Alexa Fluor® 488 Goat Anti-Rabbit Secondary Antibody (A11008) at a dilution of 1:400 for 30 minutes at room temperature. The representative 10,000 cells were acquired and analyzed for each sample using an Attune® Acoustic Focusing Cytometer. The purple histogram represents unstained control cells and the green histogram represents no-primary-antibody control.
Supportive validation
- Submitted by
- Invitrogen Antibodies (provider)
- Main image

- Experimental details
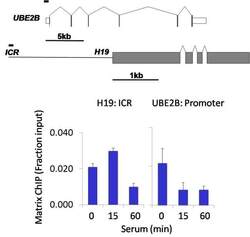
- Chromatin immunoprecipitation analysis of IRF-2 was performed using cross-linked chromatin from 1 x 10^6 HCT116 human colon carcinoma cells treated with serum for 0, 15, and 60 minutes. Immunoprecipitation was performed using a multiplex microplate Matrix ChIP assay (see reference for Matrix ChIP protocol: http://www.ncbi.nlm.nih.gov/pubmed/22098709) with 1.0 µL/100 µL well volume of an IRF-2 rabbit monoclonal antibody (Product # 700226). Chromatin aliquots from ~1 x 10^5 cells were used per ChIP pull-down. Quantitative PCR data were done in quadruplicate using 1 µL of eluted DNA in 2 µL SYBR real-time PCR reactions containing primers to amplify the promoter region of human UBE2B, or the imprinting control region (ICR) of the human H19 locus. PCR calibration curves were generated for each primer pair from a dilution series of sheared total genomic DNA. Quantitation of immunoprecipitated chromatin is presented as signal relative to the total amount of input chromatin. Results represent the mean +/- SEM for three experiments. A schematic representation of the human UBE2B and H19 loci are shown above the data where boxes represent exons (grey boxes = translated regions, white boxes = untranslated regions), the zigzag lines represent introns, and the straight line represents upstream sequence. Regions amplified by UBE2B and H19 primers are represented by black bars. Data courtesy of the Innovators Program.

- Submitted by
- Invitrogen Antibodies (provider)
- Main image
- Experimental details
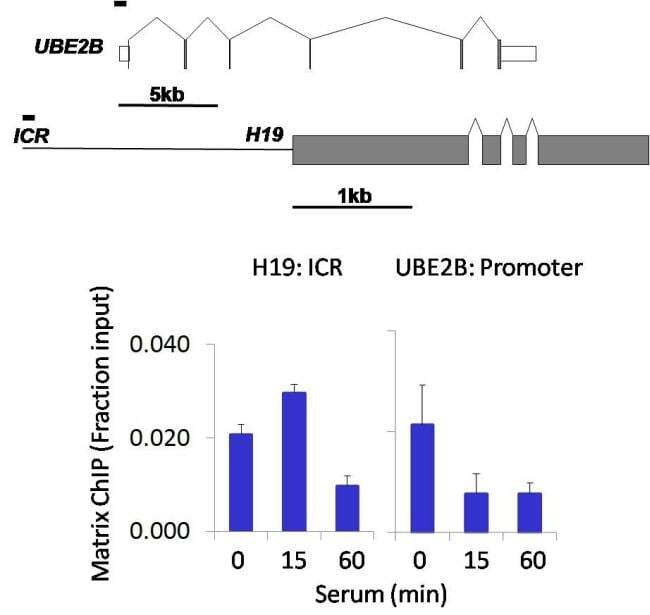
- Chromatin immunoprecipitation analysis of IRF-2 was performed using cross-linked chromatin from 1 x 10^6 HCT116 human colon carcinoma cells treated with serum for 0, 15, and 60 minutes. Immunoprecipitation was performed using a multiplex microplate Matrix ChIP assay (see reference for Matrix ChIP protocol: http://www.ncbi.nlm.nih.gov/pubmed/22098709) with 1.0 µL/100 µL well volume of an IRF-2 rabbit monoclonal antibody (Product # 700226). Chromatin aliquots from ~1 x 10^5 cells were used per ChIP pull-down. Quantitative PCR data were done in quadruplicate using 1 µL of eluted DNA in 2 µL SYBR real-time PCR reactions containing primers to amplify the promoter region of human UBE2B, or the imprinting control region (ICR) of the human H19 locus. PCR calibration curves were generated for each primer pair from a dilution series of sheared total genomic DNA. Quantitation of immunoprecipitated chromatin is presented as signal relative to the total amount of input chromatin. Results represent the mean +/- SEM for three experiments. A schematic representation of the human UBE2B and H19 loci are shown above the data where boxes represent exons (grey boxes = translated regions, white boxes = untranslated regions), the zigzag lines represent introns, and the straight line represents upstream sequence. Regions amplified by UBE2B and H19 primers are represented by black bars. Data courtesy of the Innovators Program.
Supportive validation
- Submitted by
- Invitrogen Antibodies (provider)
- Main image
- Experimental details
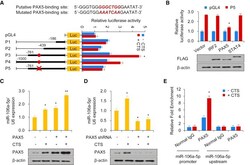
- Figure 4 CTS Promotes the Expression of miR-106a-5p through the Recruitment of PAX5 to the Promoter of miR-106a-5p (A) Luciferase activity of different miR-106a-5p promoter constructs in cultured human chondrocytes with or without CTS stimulation. P1, promoter (-186 bp); P2, promoter (-439 bp); P3, promoter (-761 bp); P4, promoter (-1,000 bp); P5, mutated promoter (-761 bp). (B) Luciferase assay in cultured human chondrocytes infected with FLAG-tagged IRF2 or PAX5 or STAT4 and P5. Immunoblot shows the expression of IRF2, PAX5, and STAT4 with anti-FLAG. (C and D) Cultured human chondrocytes were infected with the PAX5 plasmid (C) and the vector control or shRNA for PAX5 (D), followed by stimulation with CTS as described in the Methods section. Immunoblot indicates the expression of PAX5. (E) Chromatin immunoprecipitation (ChIP) assay for PAX5 occupancy on the miR-106a-5p promoter or upstream of the promoter in cultured human chondrocytes. Each bar represents the mean +- SD of at least three independent experiments performed in triplicate. *p < 0.05, **p < 0.01.
