Explore
 Validate
 Learn
Learn Western blot
Antibody data
- Antibody Data
- Antigen structure
- References [1]
- Comments [0]
- Validations
- Western blot [1]
- Other assay [3]
Submit
Validation data
Reference
Comment
Report error
- Product number
- PA5-30252 - Provider product page

- Provider
- Invitrogen Antibodies
- Product name
- PARN Polyclonal Antibody
- Antibody type
- Polyclonal
- Antigen
- Recombinant protein fragment
- Description
- Recommended positive controls: NIH-3T3, BCL-1.
- Concentration
- 1 mg/mL
Submitted references A feedback mechanism between PLD and deadenylase PARN for the shortening of eukaryotic poly(A) mRNA tails that is deregulated in cancer cells.
Miller TE, Gomez-Cambronero J
Biology open 2017 Feb 15;6(2):176-186
Biology open 2017 Feb 15;6(2):176-186
No comments: Submit comment
Supportive validation
- Submitted by
- Invitrogen Antibodies (provider)
- Main image

- Experimental details
- Western Blot using PARN Polyclonal Antibody (Product # PA5-30252). Sample (30 µg of whole cell lysate). Lane A: NIH-3T3. Lane B: BCL-1 . 7.5% SDS PAGE. PARN Polyclonal Antibody (Product # PA5-30252) diluted at 1:2,000.

Supportive validation
- Submitted by
- Invitrogen Antibodies (provider)
- Main image

- Experimental details
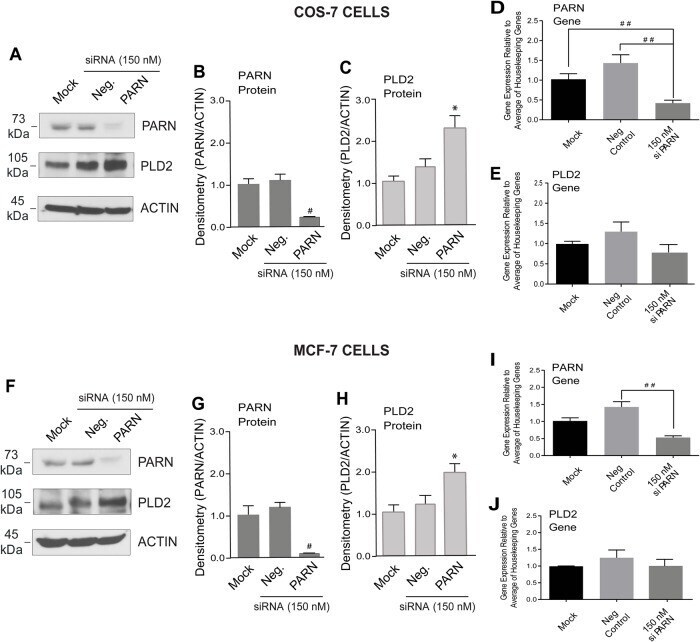
- Fig. 2. Silencing of PARN increased PLD2 protein expression. Cells were treated with transfection reagents only (Mock) or silenced with siRNA-negative control (Neg.) or with siRNA for PARN as indicated. Four days post-transfection, lysates were used for protein and gene expression analyses. (A-C) Protein expression for COS-7 cells and (F-H) for MCF-7 cells. Western blots are presented in A and F and the densitometry of PARN and PLD2 bands are shown in COS-7 cells (B-C) and MCF-7 cells (G-H). Actin was used as the equal protein loading control. (D,E) Gene expression for COS-7 cells and (I,J) for MCF-7 cells measured by RT-qPCR using the three housekeeping genes as indicated in the Fig. 1 legend. Data presented as bars are means+s.e.m. The difference between means was assessed by single-factor ANOVA. * P
- Submitted by
- Invitrogen Antibodies (provider)
- Main image

- Experimental details
- Fig. 3. PLD2 and PARN overexpression affects PARN and PLD2 protein and gene expression. (A) PARN overexpression of catalytically active or deadenylase-inactive (PARN-H377A) plasmids and their effect on PLD2 gene expression in COS-7 cells. (B) PLD2 overexpression of catalytically active or lipase-inactive (PLD2-K758R) plasmids and their effect of PARN gene expression in COS-7 cells. (C-H) Co-expression of PARN and PLD2 in two different cell lines: COS-7 (C,E,G) and MCF-7 (D,F,H). (C,D) Protein expression by western blot (actin was used as a gel loading control). Cells were left untransfected (mock) or transfected with PLD2 or PARN plasmids individually or in combination (PLD2+PARN). (E,F) PLD2 gene expression and (G,H) PARN gene expression, in either case detected by RT-qPCR. Data presented as bars are means+s.e.m. The difference between means was assessed by single-factor ANOVA. * P

- Submitted by
- Invitrogen Antibodies (provider)
- Main image

- Experimental details
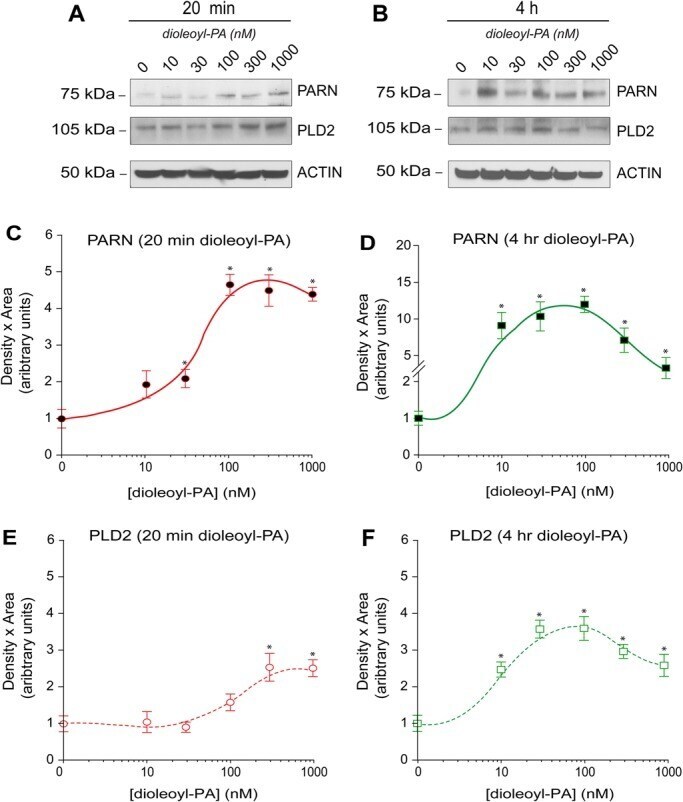
- Fig. 4. Exogenous dioleoyl-PA increases PARN protein expression. (A,B) Western blots showing endogenous levels of PARN, PLD2 and actin protein in COS-7 cells in response to 20 min (A) or 4 h (B) incubation with increasing concentrations of dioleoyl-PA as indicated. (C-F) Densitometry analyses of data shown in A,B. (C,D) Results of densitometry of PARN bands from western blots similar to the ones shown in A,B for 20 min (C) and 4 h (D). (E,F) Results of densitometry of PLD2 bands from western blots similar to the ones shown in A,B for 20 min (E) and 4 h (F). Data are presented as means+s.e.m. * P