Explore
 Validate
 Learn
Learn Western blot
 Immunoprecipitation
Antibody data
- Antibody Data
- Antigen structure
- References [4]
- Comments [0]
- Validations
- Western blot [2]
- Immunocytochemistry [1]
- Other assay [7]
Submit
Validation data
Reference
Comment
Report error
- Product number
- PA1-46018 - Provider product page

- Provider
- Invitrogen Antibodies
- Product name
- CIC Polyclonal Antibody
- Antibody type
- Polyclonal
- Antigen
- Synthetic peptide
- Description
- By Western blot, PA1-46018 is specific for the ~250 kDa CIC protein. CIC (~164 kDa) interacts with Ataxin 1 (~87 kDa). This may explain the band at 250 kDa (complex).Suggested positive control: Hela whole cell extract.
- Reactivity
- Human, Mouse, Rat, Canine
- Host
- Rabbit
- Isotype
- IgG
- Vial size
- 100 µg
- Concentration
- 1 mg/mL
- Storage
- Store at 4°C short term. For long term storage, store at -20°C, avoiding freeze/thaw cycles.
Submitted references Global and precise identification of functional miRNA targets in mESCs by integrative analysis.
Capicua Regulates Dendritic Morphogenesis Through Ets in Hippocampal Neurons in vitro.
Extracellular signal-regulated kinase mediates chromatin rewiring and lineage transformation in lung cancer.
Capicua regulates neural stem cell proliferation and lineage specification through control of Ets factors.
Schaefer M, Nabih A, Spies D, Hermes V, Bodak M, Wischnewski H, Stalder P, Ngondo RP, Liechti LA, Sajic T, Aebersold R, Gatfield D, Ciaudo C
EMBO reports 2022 Sep 5;23(9):e54762
EMBO reports 2022 Sep 5;23(9):e54762
Capicua Regulates Dendritic Morphogenesis Through Ets in Hippocampal Neurons in vitro.
Li K, Shao S, Ji T, Liu M, Wang L, Pang Y, Chen M, Xu S, Zhang K, Wang Q, Zhuang Z, Wei L, Zhang Y, Chen Y, Wang Y, Zhang J, Chen K, Lian H, Zhong C
Frontiers in neuroanatomy 2021;15:669310
Frontiers in neuroanatomy 2021;15:669310
Extracellular signal-regulated kinase mediates chromatin rewiring and lineage transformation in lung cancer.
Inoue Y, Nikolic A, Farnsworth D, Shi R, Johnson FD, Liu A, Ladanyi M, Somwar R, Gallo M, Lockwood WW
eLife 2021 Jun 14;10
eLife 2021 Jun 14;10
Capicua regulates neural stem cell proliferation and lineage specification through control of Ets factors.
Ahmad ST, Rogers AD, Chen MJ, Dixit R, Adnani L, Frankiw LS, Lawn SO, Blough MD, Alshehri M, Wu W, Marra MA, Robbins SM, Cairncross JG, Schuurmans C, Chan JA
Nature communications 2019 May 1;10(1):2000
Nature communications 2019 May 1;10(1):2000
No comments: Submit comment
Supportive validation
- Submitted by
- Invitrogen Antibodies (provider)
- Main image

- Experimental details
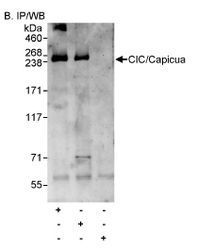
- Detection of Human CIC/Capicua by Western Blot and Immunoprecipitation. Affinity purified rabbit anti-CIC antibody used. CIC was also immunoprecipitated by rabbit anti-CIC antibody.
- Submitted by
- Invitrogen Antibodies (provider)
- Main image
- Experimental details
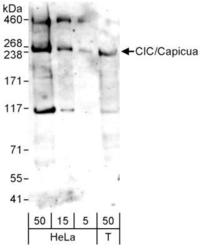
- Western blot analysis of CIC in HeLa: 5, 15, and 50 µg; 293T: 50 µg whole cell lysates of HeLa and 293T. Samples were incubated in CIC polyclonal antibody (Product # PA1-46018) using a dilution of 1 µg/mL.

Supportive validation
- Submitted by
- Invitrogen Antibodies (provider)
- Main image

- Experimental details
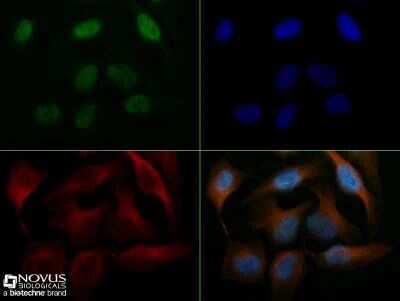
- Immunocytochemistry analysis of CIC in HeLa cells fixed for 10 minutes using 10% formalin and then permeabilized for 5 minutes using 1X TBS + 0.5% Triton X-100. Samples were incubated in CIC polyclonal antibody (Product # PA1-46018) using a dilution of 5 µg/mL overnight at 4 °C followed by anti-rabbit DyLight 488 (Green) with a dilution of 1:500. Alpha tubulin (DM1A) was used as a co-stain at a 1:1000 dilution and detected with an anti-mouse DyLight 550 (Red) at a 1:500 dilution. Nuclei were counterstained with DAPI (Blue). Cells were imaged using a 40X objective.
Supportive validation
- Submitted by
- Invitrogen Antibodies (provider)
- Main image

- Experimental details
- Immunoprecipitation of CIC was performed using HeLa cells. Antigen-antibody complexes were formed by incubating 1 mg (20% of IP loaded) whole cell lysate from HeLa cells with CIC polyclonal antibody (Product # PA1-46018) using a dilution of 3 µg/mg lysate. Capicua/CIC was immunoprecipitated by BSA Free Capicua Antibody also, which recognizes an upstream epitope. Detection: Chemiluminescence with exposure times of 3 minutes.

- Submitted by
- Invitrogen Antibodies (provider)
- Main image
- Experimental details
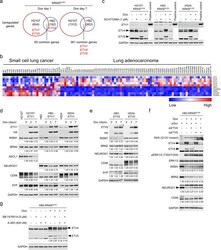
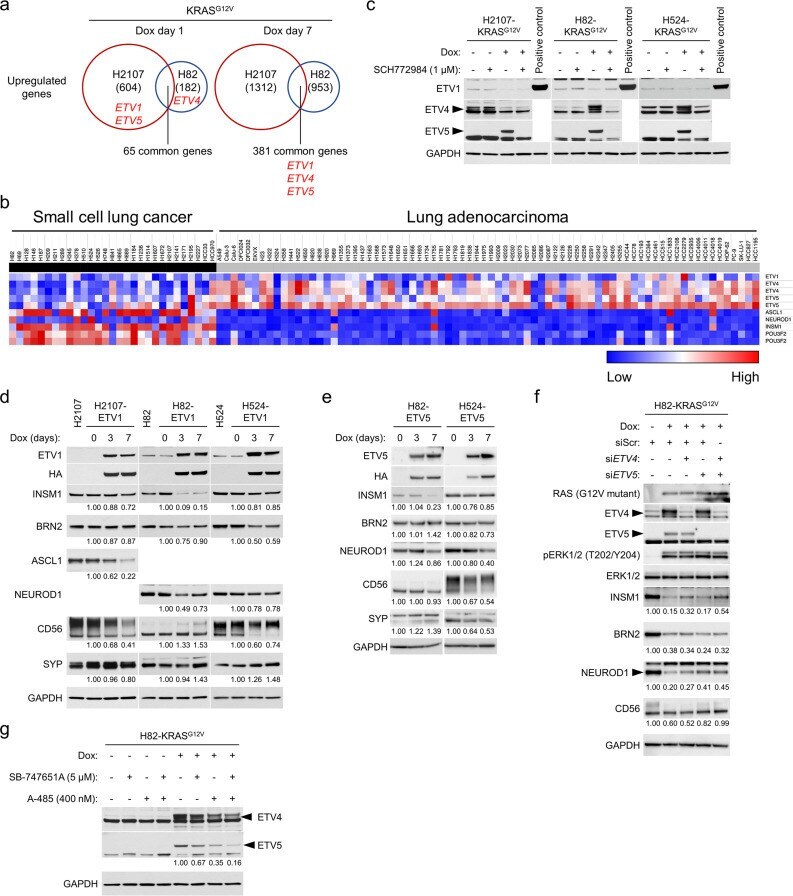
- Figure 6. The roles of ETS family transcription factors in the regulation of neuroendocrine differentiation in small cell lung cancer cell lines. ( a ) Upregulated genes by KRAS G12V overexpression for 1 day and 7 days in comparison with a GFP overexpression control in H2107 and H82 cells. The numbers of genes upregulated (>1.5 fold) are indicated. ETV1 , ETV4 , and ETV5 are shown in red. ( b ) Heat map of the PEA3 family ETS transcription factors ( ETV1 , ETV4 , and ETV5 ) and neuroendocrine transcription factors ( ASCL1 , NEUROD1 , INSM1 , and POU3F2 [ BRN2 ]) in small cell lung cancer and lung adenocarcinoma cell lines. Red and blue denote high and low expression, respectively. ( c ) Western blot showing the effects of ERK inhibition using 1 muM SCH772984 on the expression of ETV1, ETV4, and ETV5 with or without KRAS G12V transduction for 72 hr. Lysates from HA-tagged ETV1-overexpressing H524 cells were used as a positive control for ETV1. GAPDH was used as a loading control. ( d ) Effects of HA-tagged ETV1 induction as assessed by western blot in H2107, H82, and H524 cells, upon treatment with 100 ng/mL doxycycline (dox) for 3 and 7 days. GAPDH was used as a loading control. Numbers below blots show the amounts of each band relative to the corresponding non-dox-treated control values (set to two in each panel) after normalization to GAPDH. ( e ) Effects of HA-tagged ETV5 induction as assessed by western blot in H82 and H524 cells, upon treatment with 100 ng/mL dox for 3 a
- Submitted by
- Invitrogen Antibodies (provider)
- Main image

- Experimental details
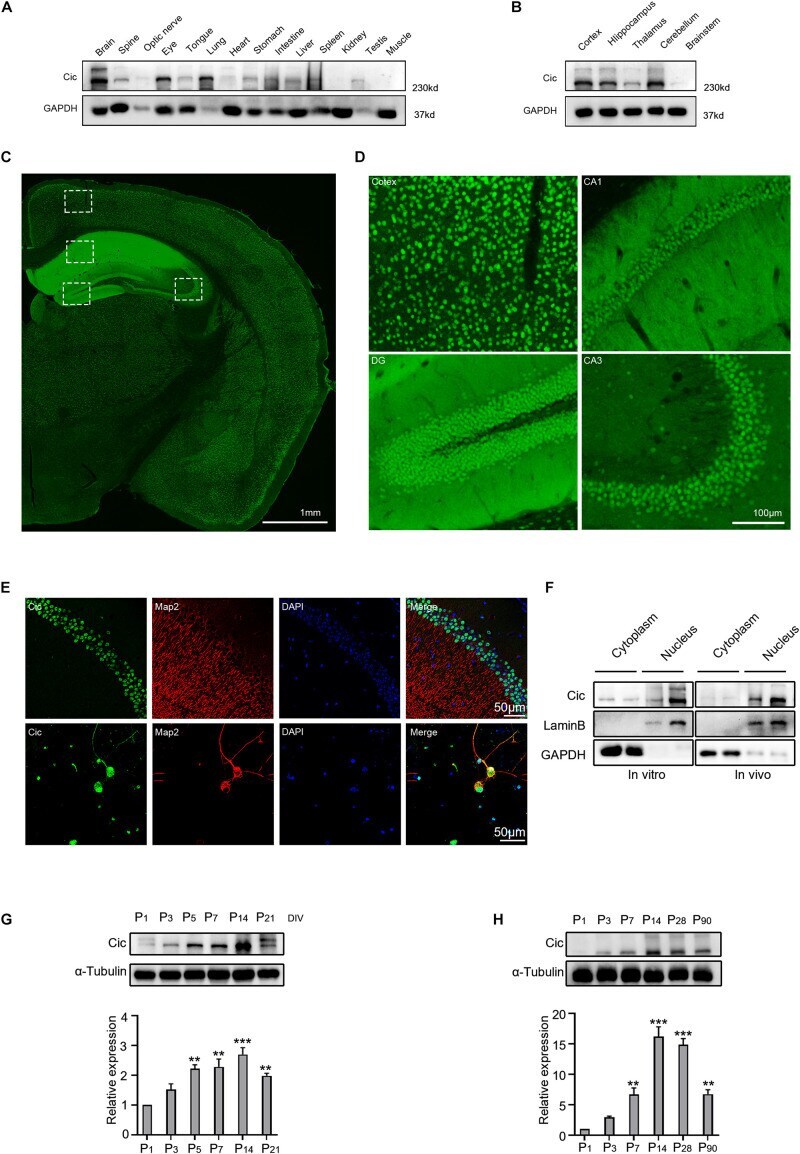
- FIGURE 1 Detection of Cic expression in hippocampal neurons. (A,B) The expression of Cic in different tissues and different regions of the brain was analyzed by western blot. (C) The expression of Cic in the brain was analyzed by immunofluorescence. (D) Higher magnification view of the boxes in (C) . (E) Expression of Cic (green) with the neuron dendritic marker Map2 (red), as shown by immunofluorescence in brain slices and cultured hippocampal neurons after DIV 14. Nuclear staining with DAPI is also shown. The last panel shows merged images. (F) The nuclear and cytoplasmic expression of Cic in cultured hippocampal neurons at DIV 14 ( in vitro ) and in the hippocampus ( in vivo ) was detected by western blot. (G) Hippocampal culture lysates from DIV 1 to 21 were immunoblotted to detect Cic, and alpha-tubulin was used as a loading control. The bottom panel shows the quantification of Cic levels in western blots as in (G) , normalized to alpha-tubulin; n = 3 independent hippocampal cultures. ** p < 0.01, *** p < 0.001 versus the P1 group. (H) Mouse hippocampal homogenates obtained at the indicated stages were immunoblotted to detect Cic, and alpha-tubulin was used as a loading control. The lower panel shows the quantification of Cic levels in western blots as in (H) , normalized to alpha-tubulin; n = 3 independent homogenates. ** P < 0.01, *** p < 0.001 versus the P1 group.
- Submitted by
- Invitrogen Antibodies (provider)
- Main image

- Experimental details
- FIGURE 2 Knockdown of Cic reveals roles in dendrite morphogenesis and the growth of dendritic spines. (A) Knockdown of Cic by lenti-shRNA infection of hippocampal neurons cultured in vitro from DIV 6-7 for 6-7 days was confirmed by WB. The right panel shows quantification of WB. (B) Hippocampal neurons cultured in vitro were transfected on DIV 7 for 6 days with either scramble ShSCR-GFP or ShRNA against Cic. Afterward, the cells were stained with an antibody against Cic, the arrow indicates transfected neurons, and the arrowhead indicates non-transfected cells. (C) Representative images of hippocampal neurons transfected at DIV6-7 with ShSCR, ShCic-1 or ShCic-2 for 6-7 days. (D) Sholl analysis of neurons transfected with ShSCR, ShCic-1 or ShCic-2 (ShSCR: n = 52; ShCic-1: n = 52; ShCic-2: n = 52). (E,F) TNDT and TDL of neurons after Cic knockdown (ShSCR: n = 52; ShCic-1: n = 52; ShCic-2: n = 52). (G) Representative images of neurons transfected on DIV 7 with ShSCR, ShCic-1 or ShCic-2 for 14 days. (H) Quantification of dendritic spine densities (ShSCR: n = 52; ShCic-1: n = 52; ShCic-2: n = 52). Data are shown as the mean +- SE and are representative of n = 3 independent experiments. *** p < 0.001; ** p < 0.01; * p < 0.05.

- Submitted by
- Invitrogen Antibodies (provider)
- Main image

- Experimental details
- FIGURE 3 Overexpression of Cic in hippocampal neurons suppresses dendrite and dendritic spine growth in vitro . (A) The Cic protein expression level in HT22 cells after Cic-OE or empty vector transfection was detected by western blot. (B) Hippocampal neurons cultured in vitro were transfected on DIV 7 for 6 days with either control vector or Cic-OE-GFP. Afterward, the cells were stained with antibodies against Cic and Flag, the arrow indicates transfected neurons, and the arrowhead indicates untransfected cells. (C) Representative images of deisolated neurons transfected on DIV 7 for 7 days with vector-GFP or Cic-OE-GFP. (D-F) Sholl analysis, TNDT and TDL of deisolated neurons transfected with vector or Cic (vector: n = 50; Cic-OE: n = 50). (G) Representative images of deisolated neurons transfected on DIV 7 for 14 days with vector or Cic-OE. (H) Quantification of dendritic spine densities (vector: n = 36; Cic-OE: n = 36). Cell images were obtained from three independent culture batches. Error bars indicate SE. *** p < 0.001; ** p < 0.01; * p < 0.05.

- Submitted by
- Invitrogen Antibodies (provider)
- Main image
- Experimental details
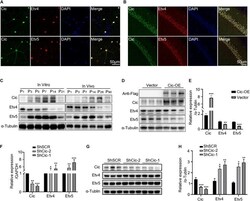
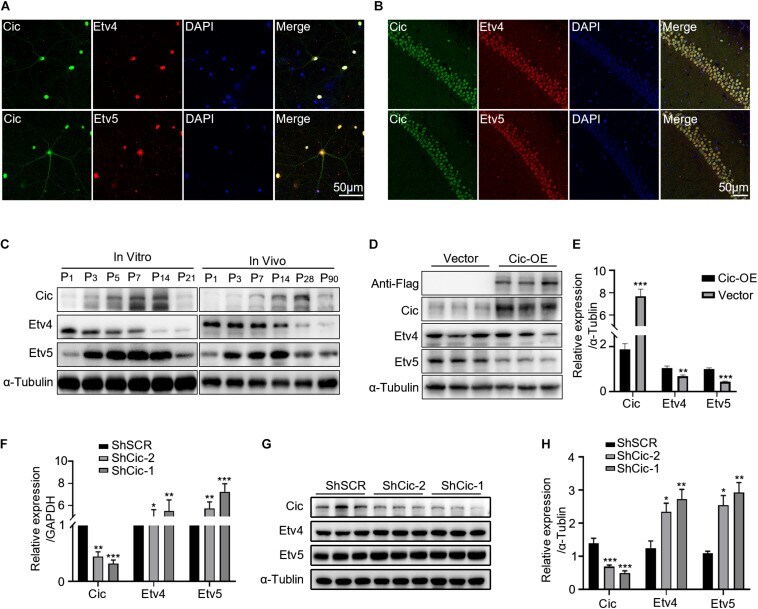
- FIGURE 4 Cic represses Ets factor expression in the dendritic growth of hippocampal neurons. (A) Localization of Cic (green) and Etv4 (top) (red) or Etv5 (bottom) (red) in dissociated mouse hippocampal neurons after DIV13. Nuclear staining with DAPI is also shown. Last panel showed merged images. (B) Localization of Cic (green) and Etv4 (top) (red) or Etv5 (bottom) (red) in coronal sections of the mouse hippocampus. (C) Hippocampal culture lysates from DIV 1 to 21 and mouse hippocampal homogenates obtained at the indicated stages were immunoblotted to detect Cic, Etv4, and Etv5. alpha-Tubulin was used as a loading control. (D) HT22 cells were infected for 3 days with either lenti-control vector or lenti-Cic-OE, and WB was used to ascertain the change in Cic and Ets following overexpression of Cic in HT22 cells. (E) shows quantification of WB in d. (F-H) Hippocampal neurons cultured in vitro were infected on DIV 7 for 7 days with either lenti-scramble ShSCR or lenti-ShRNA against Cic (ShCic-1, ShCic-2). (F) mRNA levels of Ets were assessed by qPCR following Cic knockdown in hippocampal neurons. (G) The expression of Ets following Cic knockdown in neurons was detected by WB. (H) Quantification of the WB in G. The error bars indicate the SE. *** p < 0.001; ** p < 0.01; * p < 0.05.
- Submitted by
- Invitrogen Antibodies (provider)
- Main image

- Experimental details
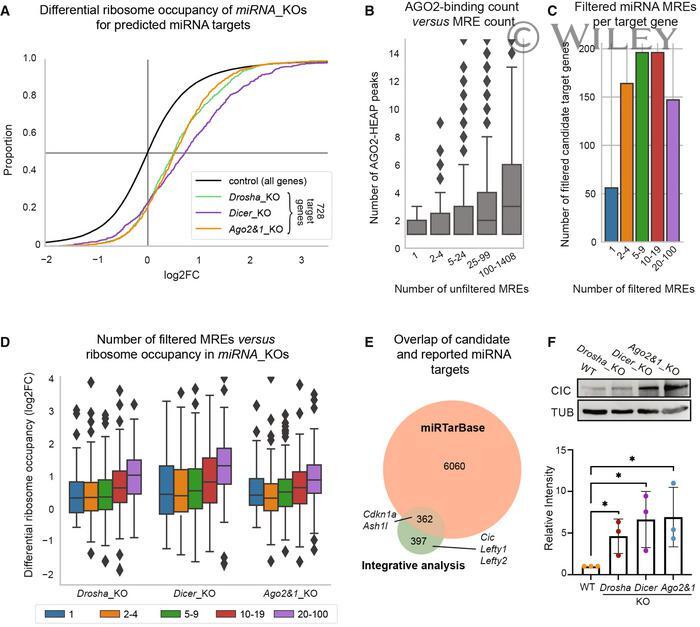
- 2 Figure Characterization of predicted miRNA interactions A Cumulative distribution function of differential ribosome occupancy as detected by ribosome profiling in miRNA _KO mutants versus WT. Of 759 predicted miRNA target genes, 728 (96%) were detectable in the ribosome profiling data and appear in the plot. B Boxplot of number of Argonaute2 (AGO2) HEAP peaks for genes grouped by the number of seed match-based miRNA response elements (MRE) in their 3' untranslated regions (UTRs). "Outliers" with more than 15 peaks are not shown. C Number of genes with different numbers of filtered MREs/interactions. D Differential ribosome occupancy in miRNA _KO mutants versus WT of genes grouped by MRE/interaction counts. Groups (colors) correspond to Fig 2C. Shown y-axis range has been limited and some outliers are hidden. E Overlap of candidate miRNA targets with previously reported miRNA targets as collected by the miRTarBase database. Selected genes described in the literature are labeled. F Top: Immunoblot analysis of CIC in WT, Drosha _KO, Dicer _KO, and Ago2&1 _KO mESCs. TUBULIN was used as a loading control. Blot is a representative image of three biological replicates. Bottom: Bar graph showing quantification of CIC intensity, normalized to TUBULIN and relative to the WT sample in three biological replicates. Data information: In (A), Student's t -test was applied to assess the significance for the increase in ribosome occupancy of the 728/759 miRNA targets ( P -value