Explore
 Validate
 Learn
Learn703809
antibody from Invitrogen Antibodies
Targeting: TP63
EEC3, KET, NBP, OFC8, p51, p53CP, p63, p73H, p73L, SHFM4, TP53CP, TP53L, TP73L
 Western blot
 Immunocytochemistry
Antibody data
- Antibody Data
- Antigen structure
- References [2]
- Comments [0]
- Validations
- Immunocytochemistry [4]
- Other assay [2]
Submit
Validation data
Reference
Comment
Report error
- Product number
- 703809 - Provider product page

- Provider
- Invitrogen Antibodies
- Product name
- TP63 Recombinant Rabbit Monoclonal Antibody (10H7L17)
- Antibody type
- Monoclonal
- Antigen
- Other
- Description
- This antibody is predicted to react with Monkey, Mouse, Rat, Bovine.
- Reactivity
- Human
- Host
- Rabbit
- Isotype
- IgG
- Antibody clone number
- 10H7L17
- Vial size
- 100 μg
- Concentration
- 0.5 mg/mL
- Storage
- Store at 4°C short term. For long term storage, store at -20°C, avoiding freeze/thaw cycles.
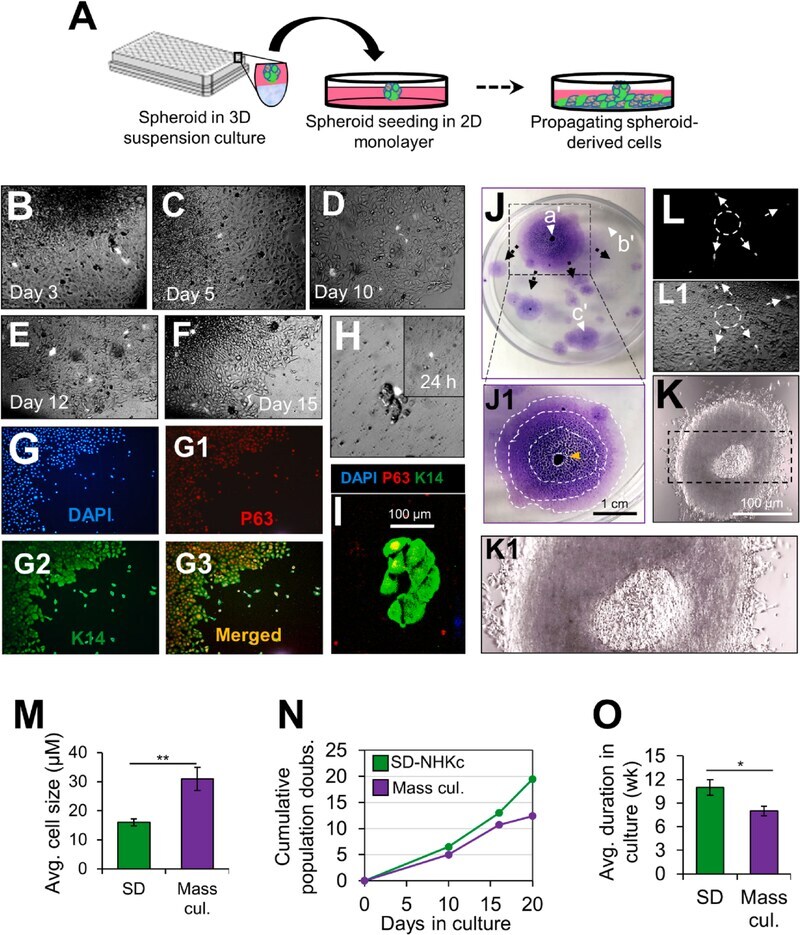
Submitted references Self-assembling 3D spheroid cultures of human neonatal keratinocytes have enhanced regenerative properties.
Analysis of the Transcriptome: Regulation of Cancer Stemness in Breast Ductal Carcinoma In Situ by Vitamin D Compounds.
Woappi Y, Altomare D, Creek KE, Pirisi L
Stem cell research 2020 Dec;49:102048
Stem cell research 2020 Dec;49:102048
Analysis of the Transcriptome: Regulation of Cancer Stemness in Breast Ductal Carcinoma In Situ by Vitamin D Compounds.
Shan NL, Minden A, Furmanski P, Bak MJ, Cai L, Wernyj R, Sargsyan D, Cheng D, Wu R, Kuo HD, Li SN, Fang M, Maehr H, Kong AN, Suh N
Cancer prevention research (Philadelphia, Pa.) 2020 Aug;13(8):673-686
Cancer prevention research (Philadelphia, Pa.) 2020 Aug;13(8):673-686
No comments: Submit comment
Supportive validation
- Submitted by
- Invitrogen Antibodies (provider)
- Main image
- Experimental details
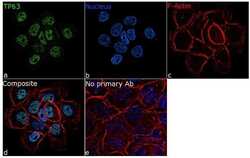
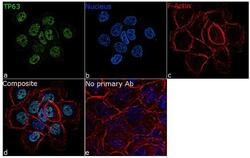
- For immunofluorescence analysis, A431 cells were fixed and permeabilized for detection of endogenous TP63 using Anti-TP63 Recombinant Rabbit Monoclonal Antibody (Product # 703809, 1:100 dilution) and labeled with Goat anti-Rabbit IgG (H+L) Superclonal™ Secondary Antibody, Alexa Fluor® 488 conjugate (Product # A27034, 1:2000). Panel a) shows representative cells that were stained for detection and localization of TP63 protein (green), Panel b) is stained for nuclei (blue) using ProLong™ Diamond Antifade Mountant with DAPI (Product # P36962). Panel c) represents cytoskeletal F-actin staining using Rhodamine Phalloidin (Product # R415, 1:300). Panel d) is a composite image of Panels a, b and c clearly demonstrating nuclear localization of TP63. Panel e) represents control cells with no primary antibody to assess background. The images were captured at 60X magnification.

- Submitted by
- Invitrogen Antibodies (provider)
- Main image
- Experimental details
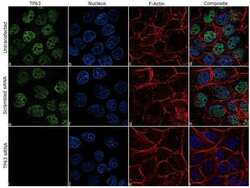
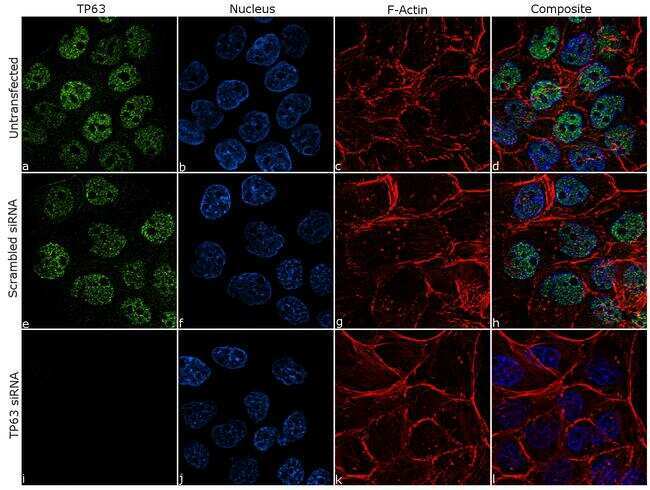
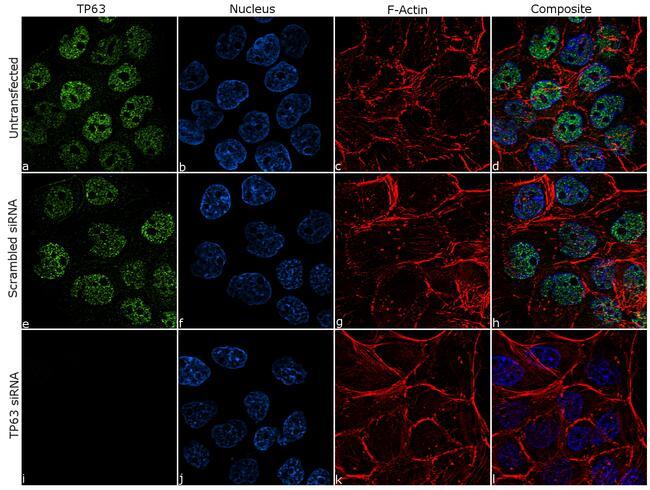
- Knockdown of TP63 was achieved by transfecting A431 cells with specific siRNA (Silencer® select Product # s13309, s13311). Immunofluorescence analysis was performed on A431 cells (untransfected, panel a-d), transfected with TP63 specific siRNA (panel i-l) or non-specific scrambled siRNA (panels e-h). Cells were fixed, permeabilized, and labeled with Anti-TP63 Recombinant Rabbit Monoclonal Antibody (Product # 703809, 1:100 dilution), followed by Goat anti-Rabbit IgG (H+L) Superclonal™ Secondary Antibody, Alexa Fluor® 488 conjugate (Product # A27034, 1:2000). Nuclei (blue) were stained using ProLong™ Diamond Antifade Mountant with DAPI (Product # P36962), and Rhodamine Phalloidin (Product # R415, 1:300) was used for cytoskeletal F-actin (red) staining. Significant reduction of the signal was observed upon siRNA mediated knockdown (panel i-l) confirming the specificity of the antibody to TP63 (green). The images were captured at 60X magnification.
- Submitted by
- Invitrogen Antibodies (provider)
- Main image

- Experimental details
- Knockdown of TP63 was achieved by transfecting A431 cells with specific siRNA (Silencer® select Product # s13309, s13311). Immunofluorescence analysis was performed on A431 cells (untransfected, panel a-d), transfected with TP63 specific siRNA (panel i-l) or non-specific scrambled siRNA (panels e-h). Cells were fixed, permeabilized, and labeled with Anti-TP63 Recombinant Rabbit Monoclonal Antibody (Product # 703809, 1:100 dilution), followed by Goat anti-Rabbit IgG (Heavy Chain) Superclonal™ Secondary Antibody, Alexa Fluor® 488 conjugate (Product # A27034, 1:2000). Nuclei (blue) were stained using ProLong™ Diamond Antifade Mountant with DAPI (Product # P36962), and Rhodamine Phalloidin (Product # R415, 1:300) was used for cytoskeletal F-actin (red) staining. Significant reduction of the signal was observed upon siRNA mediated knockdown (panel i-l) confirming the specificity of the antibody to TP63 (green). The images were captured at 60X magnification.
- Submitted by
- Invitrogen Antibodies (provider)
- Main image
- Experimental details
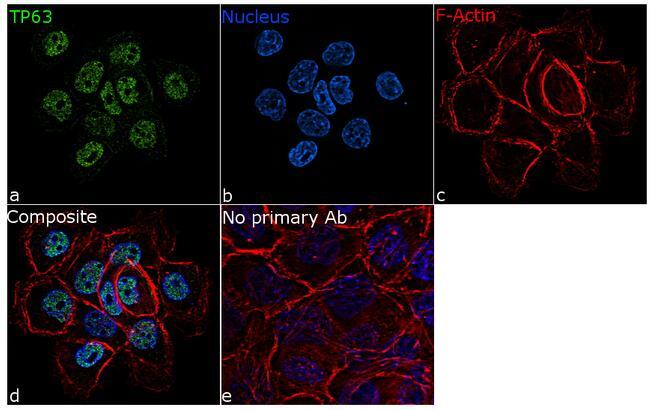
- For immunofluorescence analysis, A431 cells were fixed and permeabilized for detection of endogenous TP63 using Anti-TP63 Recombinant Rabbit Monoclonal Antibody (Product # 703809, 1:100 dilution) and labeled with Goat anti-Rabbit IgG (Heavy Chain) Superclonal™ Secondary Antibody, Alexa Fluor® 488 conjugate (Product # A27034, 1:2000). Panel a) shows representative cells that were stained for detection and localization of TP63 protein (green), Panel b) is stained for nuclei (blue) using ProLong™ Diamond Antifade Mountant with DAPI (Product # P36962). Panel c) represents cytoskeletal F-actin staining using Rhodamine Phalloidin (Product # R415, 1:300). Panel d) is a composite image of Panels a, b and c clearly demonstrating nuclear localization of TP63. Panel e) represents control cells with no primary antibody to assess background. The images were captured at 60X magnification.
Supportive validation
- Submitted by
- Invitrogen Antibodies (provider)
- Main image
- Experimental details
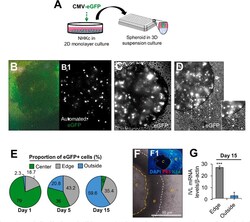
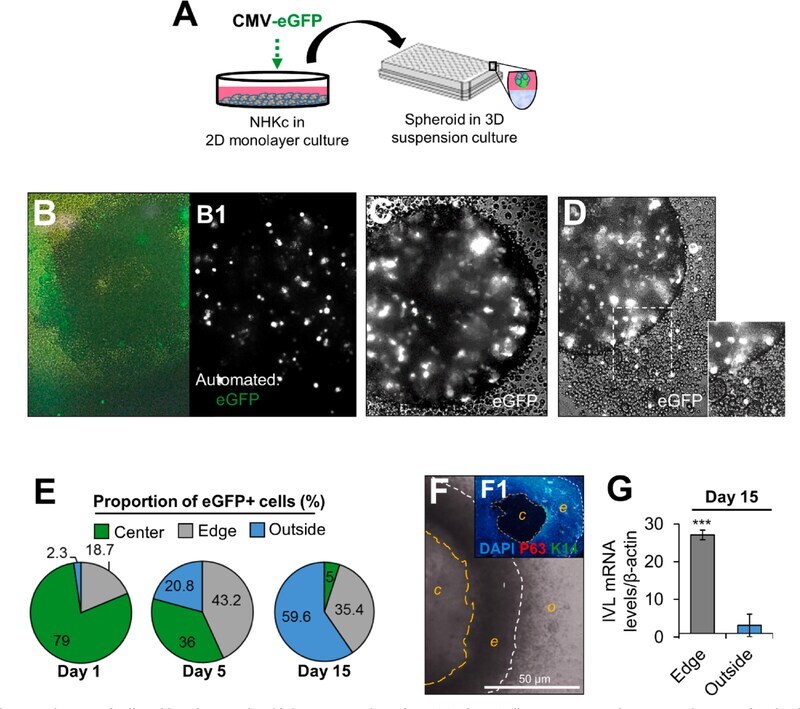
- Fig. 2. Spatiotemporal cell tracking of NHKc spheroids in 3-D suspension culture. (A) Schematic illustrating 2-D monolayer NHKc cultures transfected with an eGFP reporter plasmid and employed for epidermal spheroid formation assay. (B) Manual image of eGFP-expressing SF-NHKc after 6 h in 3-D suspension culture. (B1) Automated image of eGFP-tagged NHKc suspensions (white dots) at 6 h. (C) Bright phase image of eGFP-expressing keratinocytes within a multicellular spheroid after 24 h in suspension culture. (D) eGFP-labeled cells are seen out of a spheroid after 36 h in suspension culture. (E) Fluorescent tracking of eGFP-labelled cells after 15 days in suspension culture. The proportion of eGFP-expressing cells in each spheroid compartment (i.e. center, edge, or outside) was quantified at distinct time points by ImageJ analysis. (F) Compact ring of cells generated from a single spheroid after 15 days in suspension. White contour lines delineate the outer edge of the spheroid ( o ); orange contour lines delineate the spheroid's center ( c ) from the spheroid's inner edge ( e ). (F1) Dense ring of cells immunostained with DAPI, antibodies against pan-tumor protein 63 targeting all TP63 isoforms (P63, red), and basal cytokeratin 14 (K14, green). Scale bar = 50 muM. (G) Expression levels of mRNAs encoding involucrin in cells within the dense floating ring compared to cells located outside the ring, relative to corresponding monolayer mass cultures as determined by Real-time RT-PCR.
- Submitted by
- Invitrogen Antibodies (provider)
- Main image
- Experimental details
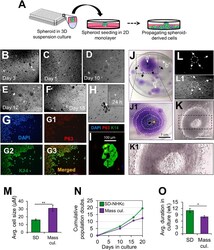
- Fig. 3. 2-D Time-lapse imaging of spheroid-derived cells in 2-D monolayer culture. (A) Schematic illustrating an eGFP-positive NHKc spheroid plated into 2-D monolayer culture as part of the epidermal spheroid re-playing assay. (B-E) Monitoring eGFP-labelled spheroid-derived (SD) cells moving from a spheroid over the course of 12 days in monolayer 2-D culture. (F) SD EGFP cells positioned along the edge of monolayer sheets by day 15. (G) SD-NHKc located along the edge of monolayer sheets were immunostained against DAPI (blue) and antibodies against (G1) P63 (red), (G2) K14 (green), and (G3) overlaid image. (H) A single SD GFP cell forming a dividing colony after 10 days in 2-D adherent culture. (I) Immunostaining of a SD-NHKc colony with antibodies against K14 (green), P63 (red), and DAPI (blue). (J) Colony renewal visible by Giemsa staining 20 days after a single spheroid is plated back into 2-D monolayer culture. Black arrows depict the radial migratory patterns of SD cells as they travel from (a') the adherent spheroid to (b'-c') open spaces throughout the dish. (J1) Configuration mapping of progressively expanding epidermal sheets from the attached spheroid. Contour lines delineate each new sheet layer. Orange arrow indicates the location of the 2-D attached spheroid. (K) Bright-field microscopic image of an adherent spheroid 15 h after attachment in 2-D culture. (K1) Magnified image depicting epidermal sheets forming underneath the adherent spheroid. (L-L1) Automated imag