Explore
 Validate
 Learn
LearnMA1-23296
antibody from Invitrogen Antibodies
Targeting: TSG101
TSG10, VPS23
 Western blot
 ELISA Immunocytochemistry
 Immunoprecipitation Immunohistochemistry Flow cytometry Immunoelectron microscopy Other assay
Antibody data
- Antibody Data
- Antigen structure
- References [20]
- Comments [0]
- Validations
- ELISA [2]
- Immunocytochemistry [2]
- Immunohistochemistry [4]
- Flow cytometry [2]
- Other assay [14]
Submit
Validation data
Reference
Comment
Report error
- Product number
- MA1-23296 - Provider product page

- Provider
- Invitrogen Antibodies
- Product name
- TSG101 Monoclonal Antibody (4A10)
- Antibody type
- Monoclonal
- Antigen
- Other
- Description
- Suggested positive controls for this product are MOLT4 and HeLa.
- Reactivity
- Human, Mouse, Rat, Canine, Hamster, Porcine
- Host
- Mouse
- Isotype
- IgG
- Antibody clone number
- 4A10
- Vial size
- 100 μL
- Concentration
- 1.8 mg/mL
- Storage
- Store at 4°C short term. For long term storage, store at -20°C, avoiding freeze/thaw cycles.
Submitted references Neural stem cell-derived exosome as a nano-sized carrier for BDNF delivery to a rat model of ischemic stroke.
Excess fatty acids induce pancreatic acinar cell pyroptosis through macrophage M1 polarization.
TKI-Resistant Renal Cancer Secretes Low-Level Exosomal miR-549a to Induce Vascular Permeability and Angiogenesis to Promote Tumor Metastasis.
Generation and Application of a Reporter Cell Line for the Quantitative Screen of Extracellular Vesicle Release.
Porphyromonas gingivalis Provokes Exosome Secretion and Paracrine Immune Senescence in Bystander Dendritic Cells.
Cancer-secreted miRNAs regulate amino-acid-induced mTORC1 signaling and fibroblast protein synthesis.
Cancer Alters the Metabolic Fingerprint of Extracellular Vesicles.
Cutaneous T-Cell Lymphoma (CTCL) Cell Line-Derived Extracellular Vesicles Contain HERV-W-Encoded Fusogenic Syncytin-1.
Detection of Viral RNA Fragments in Human iPSC-Cardiomyocytes following Treatment with Extracellular Vesicles from SARS-CoV-2 Coding-Sequence-Overexpressing Lung Epithelial Cells.
Inhalation of lung spheroid cell secretome and exosomes promotes lung repair in pulmonary fibrosis.
Evidence for Enhanced Exosome Production in Aromatase Inhibitor-Resistant Breast Cancer Cells.
Effective Visualization and Easy Tracking of Extracellular Vesicles in Glioma Cells.
Alpha-synuclein is strategically positioned for afferent modulation of midbrain dopamine neurons and is essential for cocaine preference.
Hypoxia preconditioned renal tubular epithelial cell-derived extracellular vesicles alleviate renal ischaemia-reperfusion injury mediated by the HIF-1α/Rab22 pathway and potentially affected by microRNAs.
Exosomes From Astrocyte Processes: Signaling to Neurons.
Biodistribution of Mesenchymal Stem Cell-Derived Extracellular Vesicles in a Radiation Injury Bone Marrow Murine Model.
Human pancreatic cancer cell exosomes, but not human normal cell exosomes, act as an initiator in cell transformation.
Extracellular vesicles from symbiotic vaginal lactobacilli inhibit HIV-1 infection of human tissues.
Polarized Secretion of Extracellular Vesicles by Mammary Epithelia.
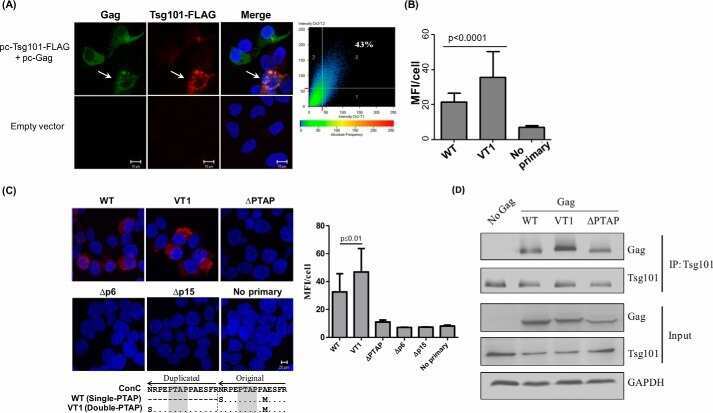
PTAP motif duplication in the p6 Gag protein confers a replication advantage on HIV-1 subtype C.
Zhu ZH, Jia F, Ahmed W, Zhang GL, Wang H, Lin CQ, Chen WH, Chen LK
Neural regeneration research 2023 Feb;18(2):404-409
Neural regeneration research 2023 Feb;18(2):404-409
Excess fatty acids induce pancreatic acinar cell pyroptosis through macrophage M1 polarization.
Xia W, Lu Z, Chen W, Zhou J, Zhao Y
BMC gastroenterology 2022 Feb 19;22(1):72
BMC gastroenterology 2022 Feb 19;22(1):72
TKI-Resistant Renal Cancer Secretes Low-Level Exosomal miR-549a to Induce Vascular Permeability and Angiogenesis to Promote Tumor Metastasis.
Xuan Z, Chen C, Tang W, Ye S, Zheng J, Zhao Y, Shi Z, Zhang L, Sun H, Shao C
Frontiers in cell and developmental biology 2021;9:689947
Frontiers in cell and developmental biology 2021;9:689947
Generation and Application of a Reporter Cell Line for the Quantitative Screen of Extracellular Vesicle Release.
Shpigelman J, Lao FS, Yao S, Li C, Saito T, Sato-Kaneko F, Nolan JP, Shukla NM, Pu M, Messer K, Cottam HB, Carson DA, Corr M, Hayashi T
Frontiers in pharmacology 2021;12:668609
Frontiers in pharmacology 2021;12:668609
Porphyromonas gingivalis Provokes Exosome Secretion and Paracrine Immune Senescence in Bystander Dendritic Cells.
Elsayed R, Elashiry M, Liu Y, El-Awady A, Hamrick M, Cutler CW
Frontiers in cellular and infection microbiology 2021;11:669989
Frontiers in cellular and infection microbiology 2021;11:669989
Cancer-secreted miRNAs regulate amino-acid-induced mTORC1 signaling and fibroblast protein synthesis.
Fong MY, Yan W, Ghassemian M, Wu X, Zhou X, Cao M, Jiang L, Wang J, Liu X, Zhang J, Wang SE
EMBO reports 2021 Feb 3;22(2):e51239
EMBO reports 2021 Feb 3;22(2):e51239
Cancer Alters the Metabolic Fingerprint of Extracellular Vesicles.
Palviainen M, Laukkanen K, Tavukcuoglu Z, Velagapudi V, Kärkkäinen O, Hanhineva K, Auriola S, Ranki A, Siljander P
Cancers 2020 Nov 6;12(11)
Cancers 2020 Nov 6;12(11)
Cutaneous T-Cell Lymphoma (CTCL) Cell Line-Derived Extracellular Vesicles Contain HERV-W-Encoded Fusogenic Syncytin-1.
Laukkanen K, Saarinen M, Mallet F, Aatonen M, Hau A, Ranki A
The Journal of investigative dermatology 2020 Jul;140(7):1466-1469.e4
The Journal of investigative dermatology 2020 Jul;140(7):1466-1469.e4
Detection of Viral RNA Fragments in Human iPSC-Cardiomyocytes following Treatment with Extracellular Vesicles from SARS-CoV-2 Coding-Sequence-Overexpressing Lung Epithelial Cells.
Kwon Y, Nukala SB, Srivastava S, Miyamoto H, Ismail NI, Rehman J, Ong SB, Lee WH, Ong SG
bioRxiv : the preprint server for biology 2020 Jul 1;
bioRxiv : the preprint server for biology 2020 Jul 1;
Inhalation of lung spheroid cell secretome and exosomes promotes lung repair in pulmonary fibrosis.
Dinh PC, Paudel D, Brochu H, Popowski KD, Gracieux MC, Cores J, Huang K, Hensley MT, Harrell E, Vandergriff AC, George AK, Barrio RT, Hu S, Allen TA, Blackburn K, Caranasos TG, Peng X, Schnabel LV, Adler KB, Lobo LJ, Goshe MB, Cheng K
Nature communications 2020 Feb 28;11(1):1064
Nature communications 2020 Feb 28;11(1):1064
Evidence for Enhanced Exosome Production in Aromatase Inhibitor-Resistant Breast Cancer Cells.
Augimeri G, La Camera G, Gelsomino L, Giordano C, Panza S, Sisci D, Morelli C, Győrffy B, Bonofiglio D, Andò S, Barone I, Catalano S
International journal of molecular sciences 2020 Aug 14;21(16)
International journal of molecular sciences 2020 Aug 14;21(16)
Effective Visualization and Easy Tracking of Extracellular Vesicles in Glioma Cells.
Mondal A, Ashiq KA, Phulpagar P, Singh DK, Shiras A
Biological procedures online 2019;21:4
Biological procedures online 2019;21:4
Alpha-synuclein is strategically positioned for afferent modulation of midbrain dopamine neurons and is essential for cocaine preference.
Trubetckaia O, Lane AE, Qian L, Zhou P, Lane DA
Communications biology 2019;2:418
Communications biology 2019;2:418
Hypoxia preconditioned renal tubular epithelial cell-derived extracellular vesicles alleviate renal ischaemia-reperfusion injury mediated by the HIF-1α/Rab22 pathway and potentially affected by microRNAs.
Zhang L, Liu H, Xu K, Ling Z, Huang Y, Hu Q, Lu K, Liu C, Wang Y, Liu N, Zhang X, Xu B, Wu J, Chen S, Zhang G, Chen M
International journal of biological sciences 2019;15(6):1161-1176
International journal of biological sciences 2019;15(6):1161-1176
Exosomes From Astrocyte Processes: Signaling to Neurons.
Venturini A, Passalacqua M, Pelassa S, Pastorino F, Tedesco M, Cortese K, Gagliani MC, Leo G, Maura G, Guidolin D, Agnati LF, Marcoli M, Cervetto C
Frontiers in pharmacology 2019;10:1452
Frontiers in pharmacology 2019;10:1452
Biodistribution of Mesenchymal Stem Cell-Derived Extracellular Vesicles in a Radiation Injury Bone Marrow Murine Model.
Wen S, Dooner M, Papa E, Del Tatto M, Pereira M, Borgovan T, Cheng Y, Goldberg L, Liang O, Camussi G, Quesenberry P
International journal of molecular sciences 2019 Nov 2;20(21)
International journal of molecular sciences 2019 Nov 2;20(21)
Human pancreatic cancer cell exosomes, but not human normal cell exosomes, act as an initiator in cell transformation.
Stefanius K, Servage K, de Souza Santos M, Gray HF, Toombs JE, Chimalapati S, Kim MS, Malladi VS, Brekken R, Orth K
eLife 2019 May 28;8
eLife 2019 May 28;8
Extracellular vesicles from symbiotic vaginal lactobacilli inhibit HIV-1 infection of human tissues.
Ñahui Palomino RA, Vanpouille C, Laghi L, Parolin C, Melikov K, Backlund P, Vitali B, Margolis L
Nature communications 2019 Dec 11;10(1):5656
Nature communications 2019 Dec 11;10(1):5656
Polarized Secretion of Extracellular Vesicles by Mammary Epithelia.
Chin AR, Yan W, Cao M, Liu X, Wang SE
Journal of mammary gland biology and neoplasia 2018 Sep;23(3):165-176
Journal of mammary gland biology and neoplasia 2018 Sep;23(3):165-176
PTAP motif duplication in the p6 Gag protein confers a replication advantage on HIV-1 subtype C.
Sharma S, Arunachalam PS, Menon M, Ragupathy V, Satya RV, Jebaraj J, Aralaguppe SG, Rao C, Pal S, Saravanan S, Murugavel KG, Balakrishnan P, Solomon S, Hewlett I, Ranga U
The Journal of biological chemistry 2018 Jul 27;293(30):11687-11708
The Journal of biological chemistry 2018 Jul 27;293(30):11687-11708
No comments: Submit comment
Supportive validation
- Submitted by
- Invitrogen Antibodies (provider)
- Main image

- Experimental details
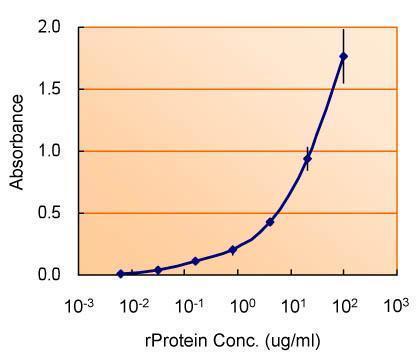
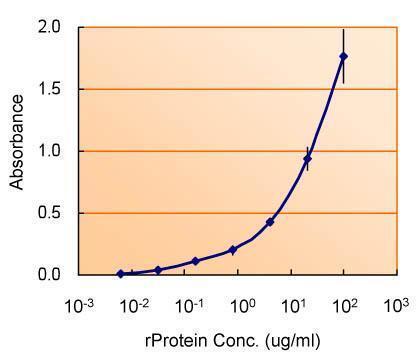
- ELISA detection of TSG101 using TSG101 Polyclonal Antibody (Product # PA5-31260) for capture at a concentration of 5 µg/mL and TSG101 Monoclonal Antibody (4A10) (Product # MA1-23296) for detection at a concentration of 1.5 µg/mL.
- Submitted by
- Invitrogen Antibodies (provider)
- Main image

- Experimental details
- ELISA detection of TSG101 using TSG101 Polyclonal Antibody (Product # PA5-31260) for capture at a concentration of 5 µg/mL and TSG101 Monoclonal Antibody (4A10) (Product # MA1-23296) for detection at a concentration of 1.5 µg/mL.
Supportive validation
- Submitted by
- Invitrogen Antibodies (provider)
- Main image
- Experimental details
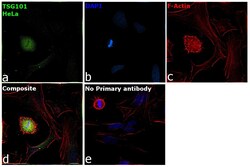
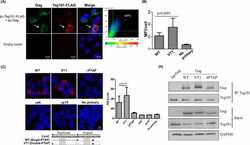
- Immunofluorescence analysis of Tsg101 was performed using 70% confluent log phase HeLa cells. The cells were fixed with 4% paraformaldehyde for 10 minutes, permeabilized with 0.1% Triton™ X-100 for 15 minutes, and blocked with 2% BSA for 1 hour at room temperature. The cells were labeled with TSG101 Monoclonal Antibody (4A10) (Product # MA1-23296, 1:500) in 0.1% BSA, incubated at 4 degree celsius overnight and then labeled with Donkey anti-Mouse IgG (H+L) Highly Cross-Adsorbed Secondary Antibody, Alexa Fluor™ Plus 488 (Product # A32766, 1:2000), for 45 minutes at room temperature (Panel a: Green). Nuclei (Panel b:Blue) were stained with ProLong™ Diamond Antifade Mountant with DAPI (Product # P36962). F-actin (Panel c: Red) was stained with Rhodamine Phalloidin (Product # R415, 1:300). Panel d represents the merged image showing centrosome and microtubule organizing center localization. Panel e represents control cells with no primary antibody to assess background. The images were captured at 60X magnification.

- Submitted by
- Invitrogen Antibodies (provider)
- Main image

- Experimental details
- Immunofluorescence analysis of Tsg101 was performed using 70% confluent log phase HeLa cells. The cells were fixed with 4% paraformaldehyde for 10 minutes, permeabilized with 0.1% Triton™ X-100 for 15 minutes, and blocked with 2% BSA for 1 hour at room temperature. The cells were labeled with TSG101 Monoclonal Antibody (4A10) (Product # MA1-23296, 1:500) in 0.1% BSA, incubated at 4 degree celsius overnight and then labeled with Donkey anti-Mouse IgG (H+L) Highly Cross-Adsorbed Secondary Antibody, Alexa Fluor™ Plus 488 (Product # A32766, 1:2000), for 45 minutes at room temperature (Panel a: Green). Nuclei (Panel b:Blue) were stained with ProLong™ Diamond Antifade Mountant with DAPI (Product # P36962). F-actin (Panel c: Red) was stained with Rhodamine Phalloidin (Product # R415, 1:300). Panel d represents the merged image showing centrosome and microtubule organizing center localization. Panel e represents control cells with no primary antibody to assess background. The images were captured at 60X magnification.

Supportive validation
- Submitted by
- Invitrogen Antibodies (provider)
- Main image
- Experimental details
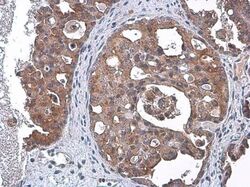
- Immunohistochemistry (Paraffin) analysis of TSG101 was performed in paraffin-embedded human ovarian cancer tissue using TSG101 Monoclonal Antibody (4A10) (Product # MA1-23296) at a dilution of 1:100. Antigen Retrieval: Citrate buffer, pH 6.0, 15 min.

- Submitted by
- Invitrogen Antibodies (provider)
- Main image
- Experimental details
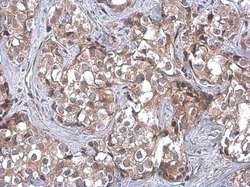
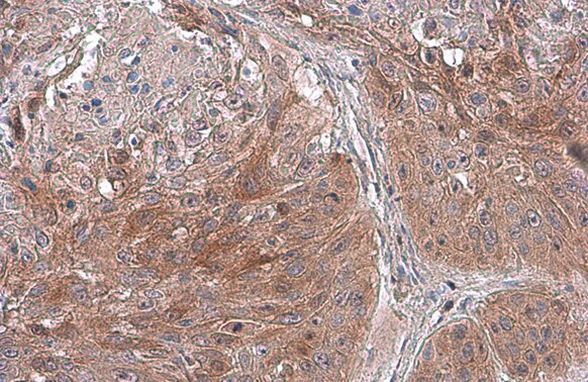
- Immunohistochemistry (Paraffin) analysis of TSG101 was performed in paraffin-embedded human breast carcinoma tissue using TSG101 Monoclonal Antibody (4A10) (Product # MA1-23296) at a dilution of 1:100. Antigen Retrieval: Citrate buffer, pH 6.0, 15 min.
- Submitted by
- Invitrogen Antibodies (provider)
- Main image
- Experimental details
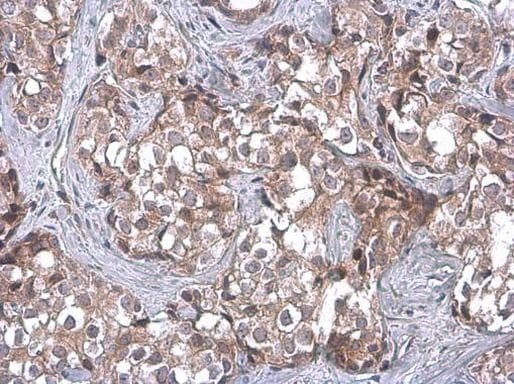
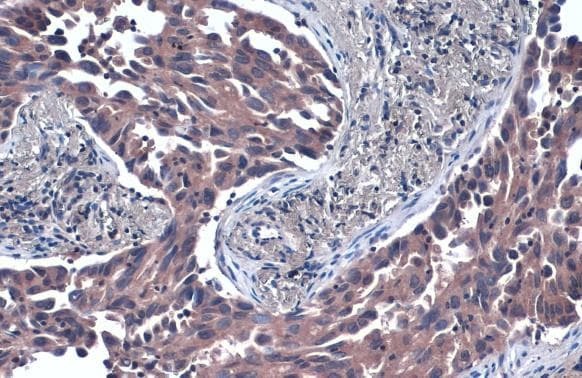
- Immunohistochemistry (Paraffin) analysis of TSG101 was performed in paraffin-embedded human lung cancer tissue using TSG101 Monoclonal Antibody (4A10) (Product # MA1-23296) at a dilution of 1:100. Antigen Retrieval: Citrate buffer, pH 6.0, 15 min.
- Submitted by
- Invitrogen Antibodies (provider)
- Main image

- Experimental details
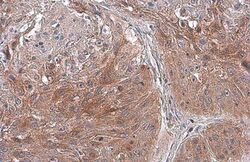
- TSG101 Monoclonal Antibody (4A10) detects TSG101 protein at cytoplasm by immunohistochemical analysis. Sample: Paraffin-embedded human lung cancer. TSG101 stained by TSG101 Monoclonal Antibody (4A10) (Product # MA1-23296) diluted at 1:50. Antigen Retrieval: Citrate buffer, pH 6.0, 15 min.
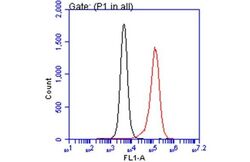
Supportive validation
- Submitted by
- Invitrogen Antibodies (provider)
- Main image
- Experimental details
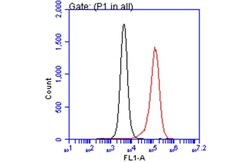
- Flow Cytometry analysis of RACGAP1 was performed in THP-1 cells using RACGAP1 Polyclonal Antibody (Product # PA1-31510) (red) at a dilution of 1:25. Black: Unlabelled sample was used as a control. Acquisition of 20,000 events were collected using a Dylight 488-conjugated secondary antibody for FACS analysis.
- Submitted by
- Invitrogen Antibodies (provider)
- Main image
- Experimental details
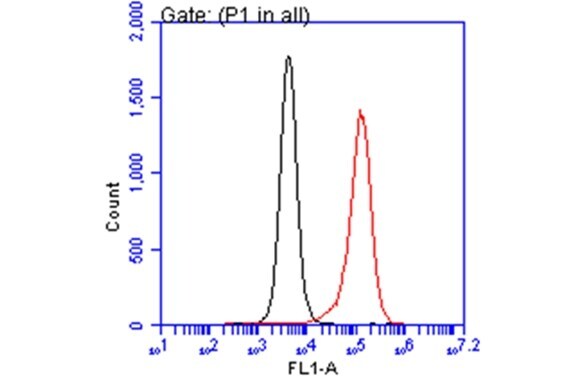
- Flow Cytometry analysis of RACGAP1 was performed in THP-1 cells using RACGAP1 Polyclonal Antibody (Product # PA1-31510) (red) at a dilution of 1:25. Black: Unlabelled sample was used as a control. Acquisition of 20,000 events were collected using a Dylight 488-conjugated secondary antibody for FACS analysis.
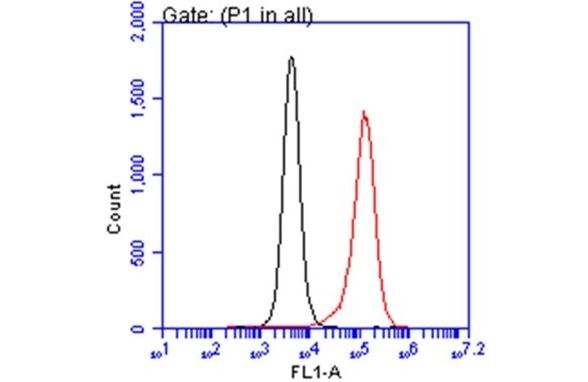
Supportive validation
- Submitted by
- Invitrogen Antibodies (provider)
- Main image
- Experimental details
- NULL
- Submitted by
- Invitrogen Antibodies (provider)
- Main image
- Experimental details
- NULL
- Submitted by
- Invitrogen Antibodies (provider)
- Main image
- Experimental details
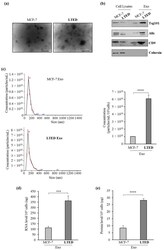
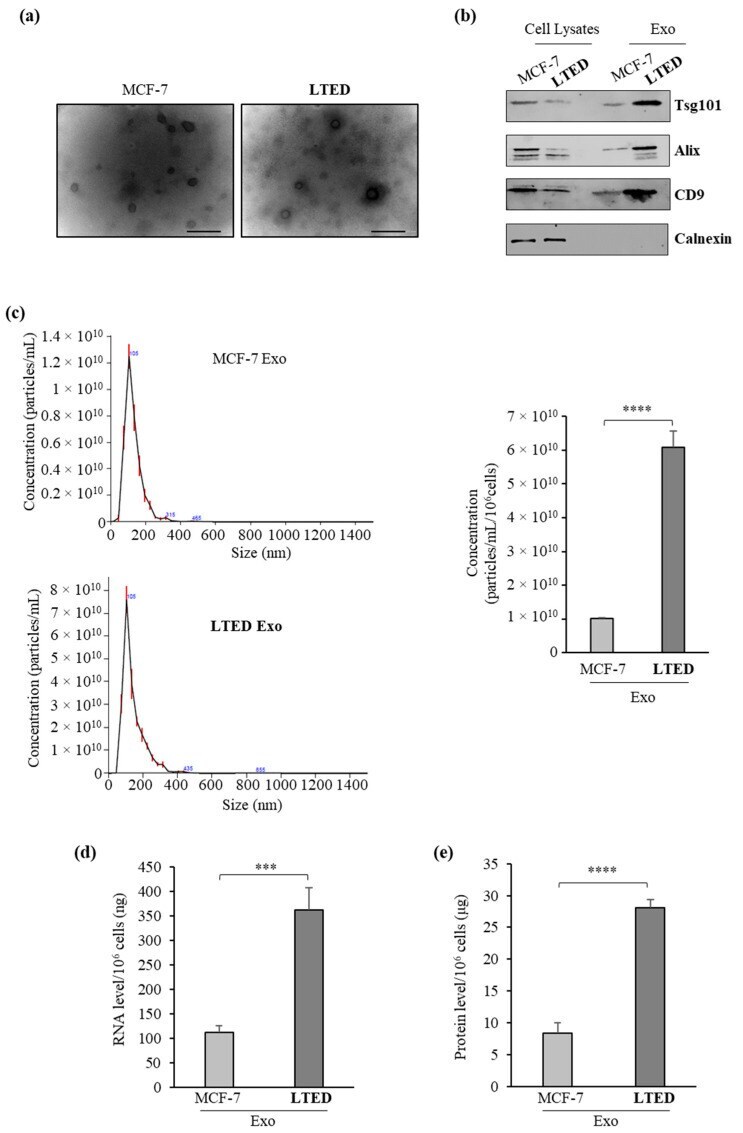
- Figure 1 Increased release of exosomes from MCF-7 LTED cells compared to MCF-7 cells. ( a ) Representative micrograph of transmission electron microscopy (TEM) of exosomes from conditioned medium of MCF-7 (MCF-7 Exo) and MCF-7 LTED (LTED Exo) breast cancer cells. Scale bar, 100 nm; ( b ) Immunoblotting showing expression of the exosome hallmarks Tsg101, Alix and CD9 in equal amount (4 µg) of exosome lysates (Exo) and whole cell lysates of MCF-7 and MCF-7 LTED cells. Calnexin was used to ensure that exosome samples were not contaminated with endoplasmic reticulum proteins; ( c ) Size distribution and concentration profiles of exosomes (Exo) recovered from MCF-7 and MCF-7 LTED breast cancer cell conditioned media (CM), measured by nanoparticle tracking analysis (NTA). The hystogram represents the mean +- S.D. of exosome concentration (particles/mL/10 6 cells) of 5 analyses; ( d ) Quantitation of average total amount of exosomal RNA per 10 6 cells; ( e ) Quantitation of average total amount of exosomal proteins per 10 6 cells. ***, p < 0.0005; ****, p < 0.0001.
- Submitted by
- Invitrogen Antibodies (provider)
- Main image

- Experimental details
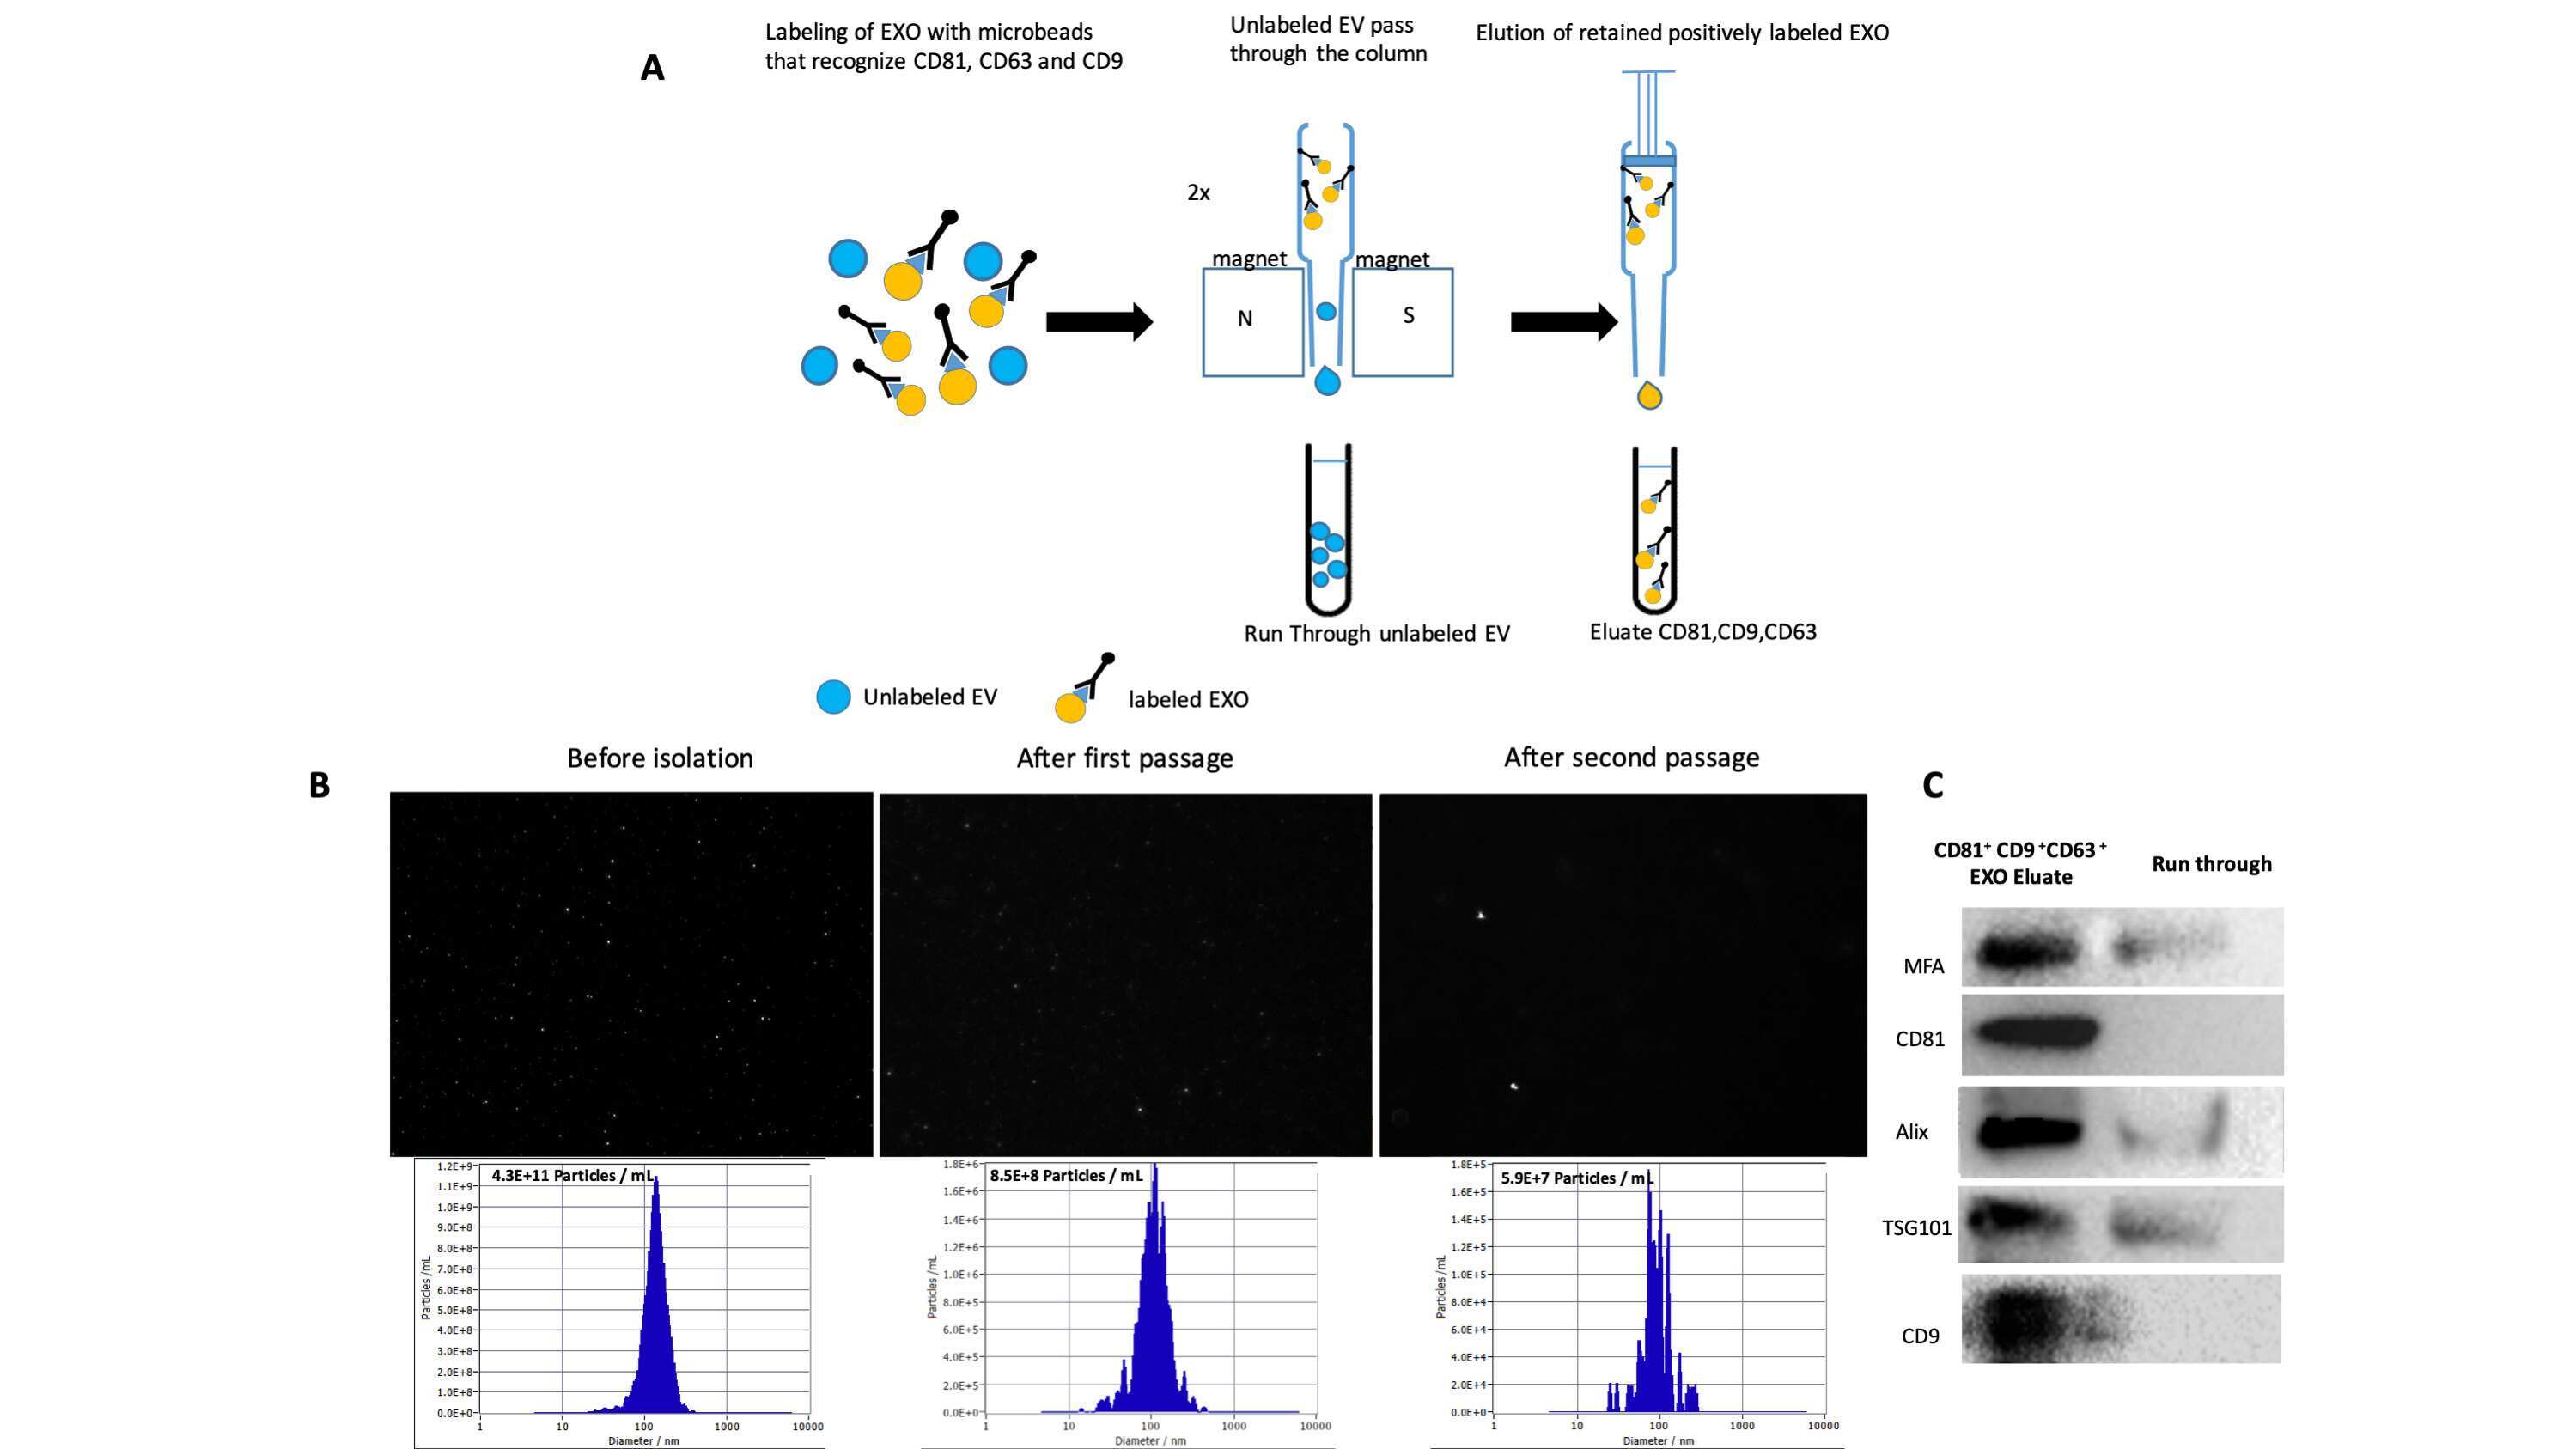
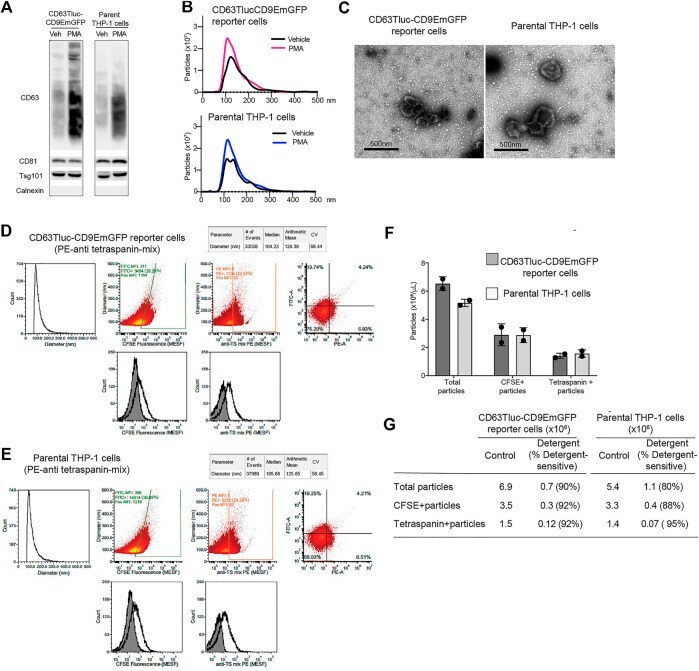
- FIGURE 4 Comparison of EVs released from CD63Tluc-CD9EmGFP reporter cells and parental THP-1 cells. (A-C) 0.5 x 10 6 cells/ml CD63Tluc-CD9EmGFP reporter cells or parental THP-1 cells were treated with 50 ng/ml PMA, 5 uM compounds 81, or 5 for 48 h. EVs were isolated using ExoQuick and were resuspended in particle-free PBS to 1/500 of the original volume of culture supernatant. (A) Immunoblot of EVs isolated from CD63Tluc-CD9EmGFP reporter cells and parental THP-1 cells. EVs (30 ug protein/well) were separated in a 4-12% NuPAGE gel. Blots were probed with anti-CD63, anti-CD81, anti-Tsg101, or anti-Calnexin Abs. The images shown are representative of three independent experiments. The original blots are presented in Supplementary Figure S4 . (B) Size distributions of isolated EVs released from CD63Tluc-CD9EmGFP reporter cells (top) and parental THP-1 cells following treatment with PMA (50 ng/ml) or vehicle as measured by NanoSight. (C) Morphological examination of EVs from vehicle-treated CD63Tluc-CD9EmGFP reporter cells and parental THP-1 cells by transmission electron microscopy. Scale bars represent 500 nm. (D-G) Vesicle flow cytometric (vFC) analysis of EVs isolated from CD63Tluc-CD9EmGFP reporter cells (D,F,G) or parental THP-1 cells (E-G) using differential ultracentrifugation. EVs were stained with vFRed(tm), CFSE, or a mixture of anti-TS antibodies. The gating strategy, positive and negative control samples and isotype staining are presented in Supplementary Figure S8 .
- Submitted by
- Invitrogen Antibodies (provider)
- Main image
- Experimental details
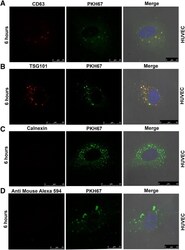
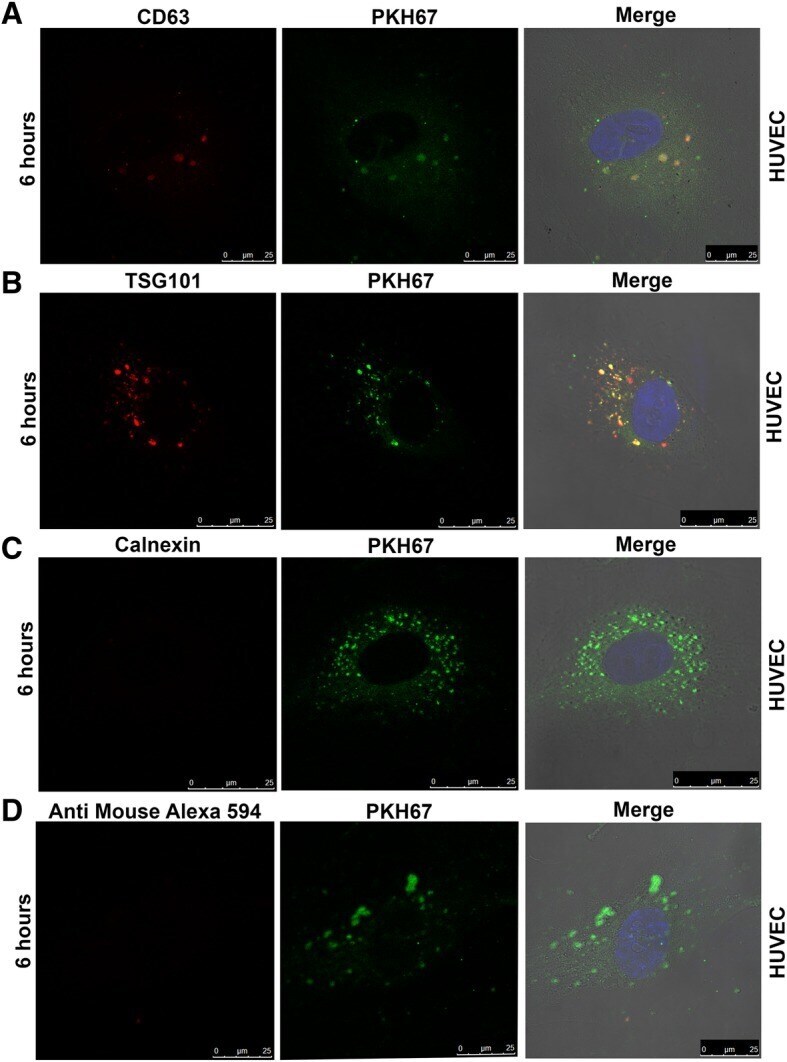
- Fig. 5 Cellular uptake assay in HUVECs. Confocal imaging of EVs labeled with antibodies to CD63, TSG101, calnexin along with PKH67 dye. The uptake of CD63 (upper panel) and TSG101 antibodies (lower panel) labeled EVs along with PKH67 dye molecules were analysed in HUVECs after 6 h of incubation with EVs ( a and b ). Calnexin and PKH67 dual staining served as a negative control to ensure specificity of signal ( c ). EVs labeled with only secondary antibody and PKH67 dye served as negative control ( d )
- Submitted by
- Invitrogen Antibodies (provider)
- Main image
- Experimental details
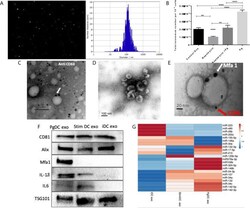
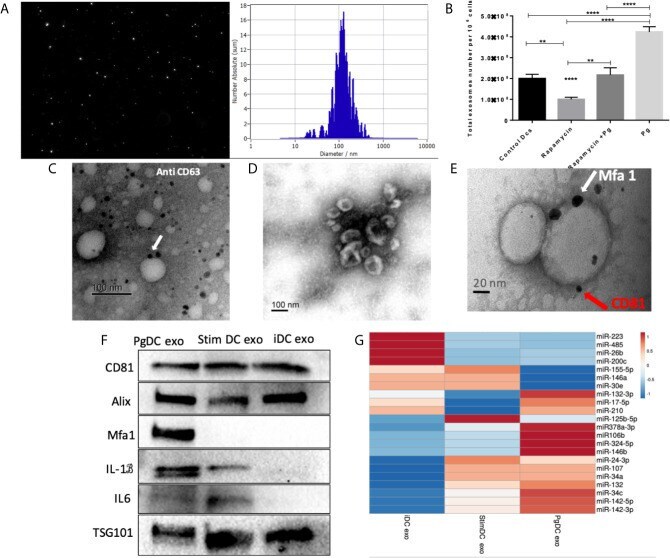
- Figure 4 Characterization of exosomes released from DCs infected with P.gingivalis (PgDCexo): (A) Nano tracking analysis (NTA) to determine Exo number and size distribution in nanometer (nm). (B) Total number of Exo released per 10 6 cells as determined by NTA from DCs treated or non-treated with Pg and/or Rapamycin (C) Immuno-gold TEM showing EXO marker, tetraspanin CD63. (D) SEM showing characteristic Exo morphology. (E) Co-localization of Mfa1 bacterial protein (large- sized gold Nano particle indicated with white arrow) with the eukaryotic cellular exosomal marker, CD81 (small-sized gold Nano particle indicated with red arrow) using TEM immune-gold double labeling (F) Western blot showing Exo-related markers TSG101, Alix, and tetraspanin CD81 and proinflammatory cytokines IL6, TNFa and IL-1b and Mfa1 in exosomes released from control immature DCs (iDCs), Ecoli LPS-stimulated mature DCs (StimDCexo) and Pg infected DCs (PgDCexo). (G) miRNA analysis of Pg or Ecoli LPS-induced DCs Exo (PgDC exo and StimDCexo respectively) compared to immature control DCs exo; (iDCexo). (iDCs), control immature DCs exo, (StimDCexo), Ecoli LPS-stimulated mature DCs exo; (PgDCexo), Pg-infected DCs. **p
- Submitted by
- Invitrogen Antibodies (provider)
- Main image
- Experimental details
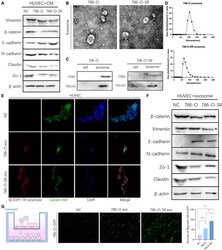
- FIGURE 2 Exosomes derived from Clear cell renal cell carcinoma cells increase the permeability of the endothelial cells. (A) Western blot analysis of Vimentin, beta-catenin, E -cadherin, N -cadherin, Zo-1, Claudin expression in HUVECs incubated with CM of 786-O and 786-O-SR. (B) Transmission electron microscopy of exosomes derived from 786-O and 786-O-SR. Scale bar, 100 nm. (C) Western blotting analysis of CD81 and TSG101 in 786-O, 786-O-SR and their exosomes. (D) Nanoparticle tracking analysis of the size distribution and median diameter of particles per mug exosomes from 786-O and 786-O-SR. (E) The presence of BODIPY TR ceramide fluorescence in HUVECs after adding dye-labeled exosomes derived from 786-O and 786-O-SR cells for 48 h. HUVECs incubated with PBS were used as a negative control. Red: BODIPY TR ceramide; Green: Calcein AM; Blue: DAPI. (F) Western blot analysis of beta-catenin, Vimentin, E -cadherin, N -cadherin, Zo-1, Claudin expression in HUVECs incubated with exosomes of 786-O and 786-O-SR. (G) Transendothelial invasion assay analysis of the number of GFP-expressing 786-O cells that invaded through HUVECs monolayers cultured with exosome derived from 786-O or 786-O-SR. Mean +- SEM are provided ( n = 3). ** P < 0.01, *** P < 0.001, according to two-tailed Student's t -test. exo, exosomes; NC, negative control.
- Submitted by
- Invitrogen Antibodies (provider)
- Main image
- Experimental details
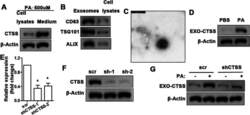
- Fig. 3 CTSS is produced in macrophage and transported by exosomes. Western blot analysis of CTSS in macrophage cell lysates and medium after PA (500 muM) stimulation for 24 h ( A ). Western blot analysis of exosome-specific proteins in exosomes and cell lysates detected 24 h after palmitic acid (PA, 500 muM) stimulation of macrophage ( B ). Electron microscopy of exosomes ( C ). (Scale bars = 500 nm) Exosome-derived CTSS from PA (500 muM) stimulated macrophage ( D ). QRT-PCR ( E ) and western blot ( F ) analysis of CTSS gene knockdown efficiency in macrophage. Data are shown as the mean +- SEM, n = 3, ANOVA. * P < 0.05. Detection of CTSS in exosomes from PA (500 muM) stimulated macrophage; macrophage were transfected with shCTSS, scr transfection as the control ( G )

- Submitted by
- Invitrogen Antibodies (provider)
- Main image
- Experimental details
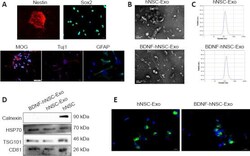
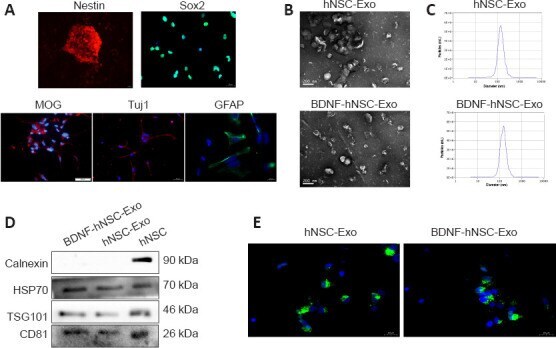
- The features of hNSCs and engineered exosomes (Exo) . (A) Immunofluorescence showed the expression of Nestin (red), Sox2 (green), MOG (red), Tuj1 (red), and GFAP (green). Nuclei were stained by DAPI (blue). Scale bars: 100 mum in the MOG panel; 50 mum in the Tuj1 panel; 20 mum in Nestin, Sox2 and GFAP panels. (B) hNSC-Exo and BDNF-hNSC-Exo showed cup-shaped exosome morphology under TEM. Scale bars: 200 mum. (C) NTA analysis indicated a similar size range for hNSC-Exo and BDNF-hNSC-Exo. (D) Western blot analysis of exosomal marker proteins including CD81, HSP70, and TSG101 and calnexin (as a negative control). (E) Representative micrographs of exosome uptake in NSCs incubated with PKH67-labeled exosomes (green) for 48 hours. Nuclei were stained by DAPI (blue). Scale bars: 20 mum. BDNF: Brain-derived neurotrophic factor; GFAP: glial fibrillary acidic protein; hNSC: human neural stem cell; HSP70: heat shock protein 70; MOG: myelin oligodendrocyte glycoprotein; TSG101: tumor susceptibility 101; Tuj1: beta-tubulin III.
- Submitted by
- Invitrogen Antibodies (provider)
- Main image

- Experimental details
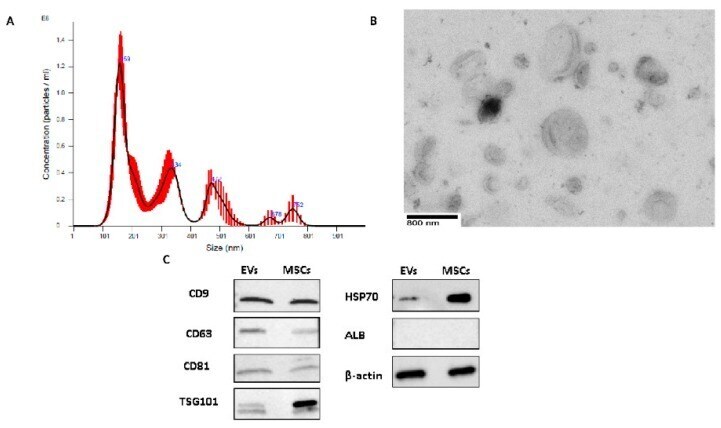
- Figure 1 Extracellular vesicle (EV) characterizations. ( A ) A typical profile of human MSC-EV fractions by NanoSight analysis. ( B ) A typical profile of electron micrographs of human MSC-EVs (scale bar = 800 nm; magnification: 14,000x). ( C ) Representative western blot analyses of CD81, CD63, CD9, TSG101, HSP70 ALB, and GAPDH expressions in the lysate of mesenchymal stem cell (MSC)-EVs and MSCs.
- Submitted by
- Invitrogen Antibodies (provider)
- Main image
- Experimental details
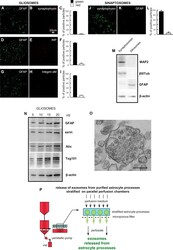
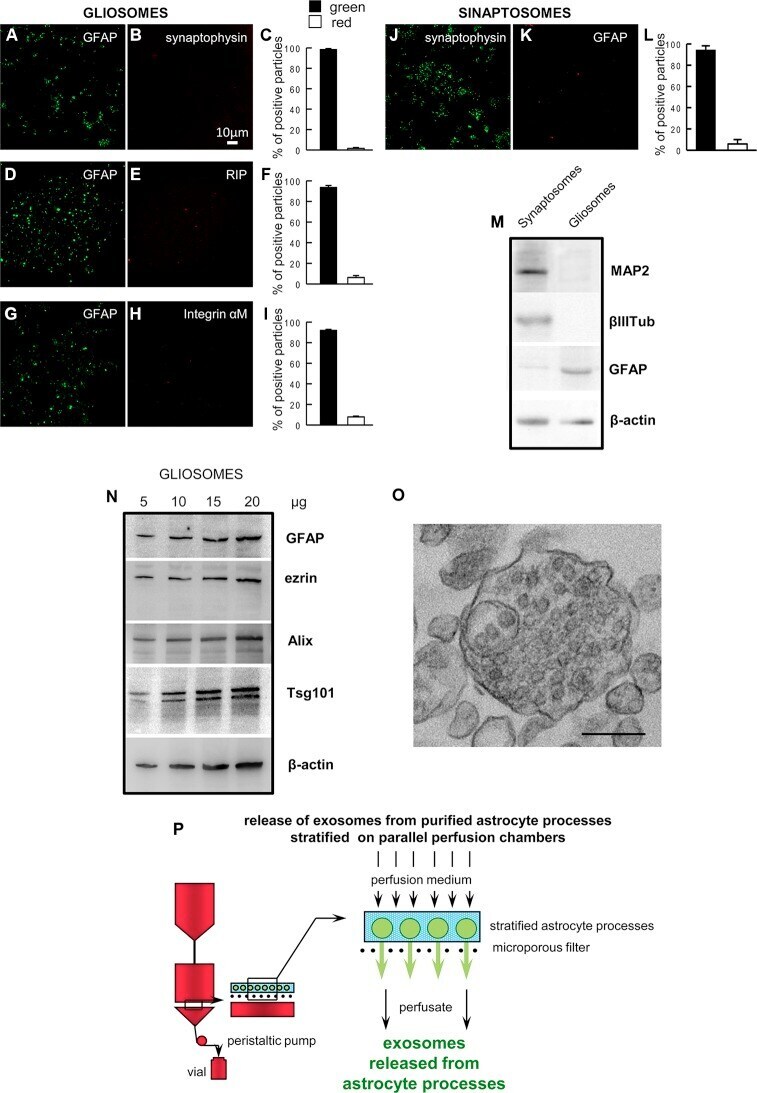
- Figure 1 Astrocyte processes obtained from adult rat cerebral cortex. Negligible contamination of gliosomes, positive for the specific glial marker GFAP (A , D , G) , by subcellular no-astrocytic particles. Immunofluorescent assay for synaptophysin (B) , RIP (E) or integrin-alphaM (H) markers for nerve terminals, microglia, and oligodendrocytes, respectively. As a positive control, the immunofluorescent assay for synaptophysin (J) was performed on cerebral cortical synaptosomes scarcely contaminated by subcellular GFAP-positive particles (K) . Bars (C , F , I , L) represent the percent of positive particles (% +- SEM of positive particles counted in three to five no-overlapping fields from n = 3 different preparations): GFAP (C, F, I, solid bars; L, empty bar), synaptophysin (C empty bar; L solid bar; L, empty bar), or RIP or integrin-alphaM (F or I, respectively; empty bar). Scale bars are indicated in the figures. Western blot analysis of gliosomes and synaptosomes (M , N) . The absence of cross-contamination of the astrocyte processes and nerve terminals is shown (M) : MAP2, beta III tubulin, and GFAP proteins were used as selective markers for the synaptosome or gliosome preparations. Presence of the astrocytic markers GFAP and ezrin, and of the exosome markers Alix and Tsg101 in the gliosomes (N) . Electron microscopy image of a cortical astrocyte processes. A single gliosome is shown containing vesicles scattered in the cytoplasm and a multivesicular body (O) . Scale ba
- Submitted by
- Invitrogen Antibodies (provider)
- Main image
- Experimental details
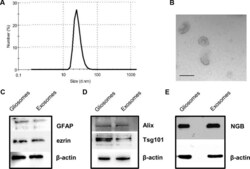
- Figure 2 Characterization of rat cerebrocortical astrocyte processes-released exosomes. Size distribution of exosomes released from the astrocyte processes, as assessed by the zetasizer nano ZS90 particle sizer. Curve shows a representative tracing (from three samples obtained from three different experiments with similar results) (A) . Electron microscopy images of vesicles released from astrocyte processes. Note the cup shape appearance and size, consistent with previously reported exosome electron microscopy images characteristics (B ; scale bar: 100 nm). Presence of astrocytic markers, exosomal markers, and of NGB (C - E) . Western blot for the astrocytic markers GFAP and ezrin in gliosome preparation and in exosomes released from gliosomes (C) . Western blot for the exosomal markers Alix and Tsg101 in gliosome preparation and in gliosome-released exosomes (D) . Western blot for NGB in gliosome preparation and in gliosome-released exosomes (E) . For other experimental details, see Materials and Methods .

- Submitted by
- Invitrogen Antibodies (provider)
- Main image
- Experimental details
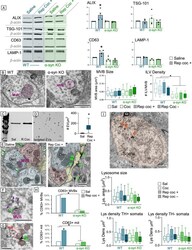
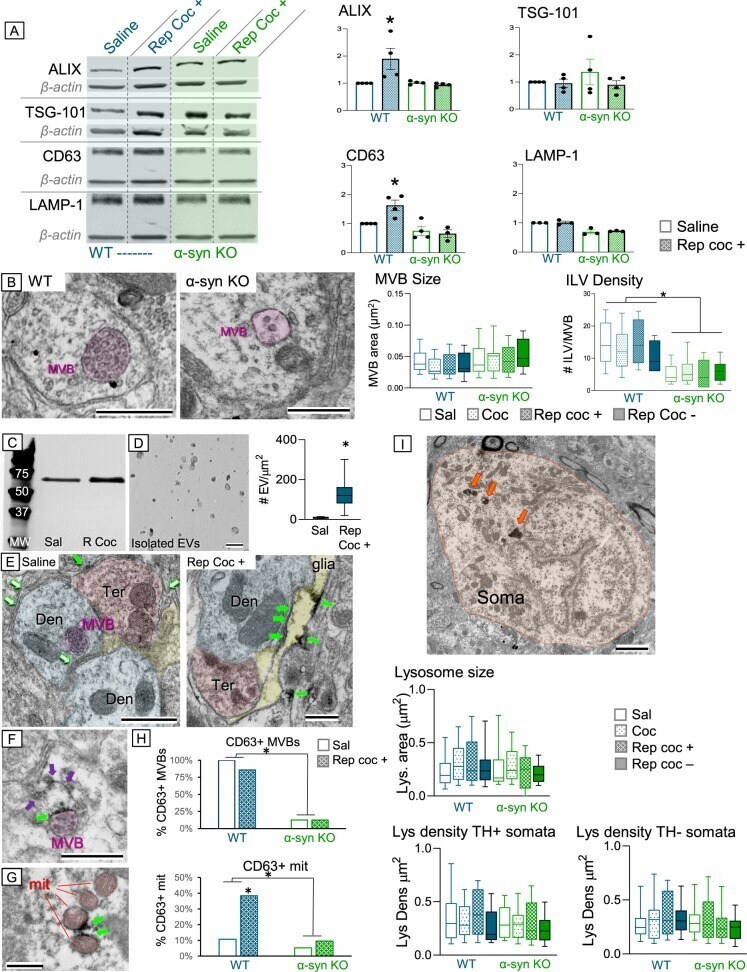
- Fig. 6 a Western Blots for ALIX, TSG-101, CD63, and LAMP-1 in midbrain lysates obtained from WT (blue) and alpha-syn KO (green) and bar charts of quantification showing increased ALIX and CD63 protein levels after repeated cocaine administration that was blocked in alpha-syn KO mice. b Electron micrographs and quantification (bar chart) showing that although neither cocaine administration nor alpha-syn deletion affects MVB size, alpha-syn is critical for cargo internalization and formation of intraluminal vesicles (ILVs) within MVBs. c Western blot of isolated EVs from mouse brain showing increased CD63 immunoreactivity after repeated cocaine administration. d Electron micrograph and quantification of isolated EVs from mouse brain showing increased vesicle density after repeated cocaine. e Electron micrographs of VTA tissue from saline-treated mice showing CD63 immunolabeling of ILVs in a MVB (magenta outline) but virtually no labeling in the extracellular spaces (open green arrows) of saline-treated mice. In contrast, after repeated cocaine administration (left), CD63 immunoperoxidase is evident in the extracellular space (green arrows) and in glia (yellow) within the VTA. f Electron micrograph of a MVB (magenta) showing CD63 immunolabeling on its surface (green arrow) and vesicles with CD63 labeling (purple arrows) along a membrane that attaches the MVB to the extracellular space between adjoining cells. g Electron micrograph of several mitochondria (red) showing CD63 label
- Submitted by
- Invitrogen Antibodies (provider)
- Main image
- Experimental details
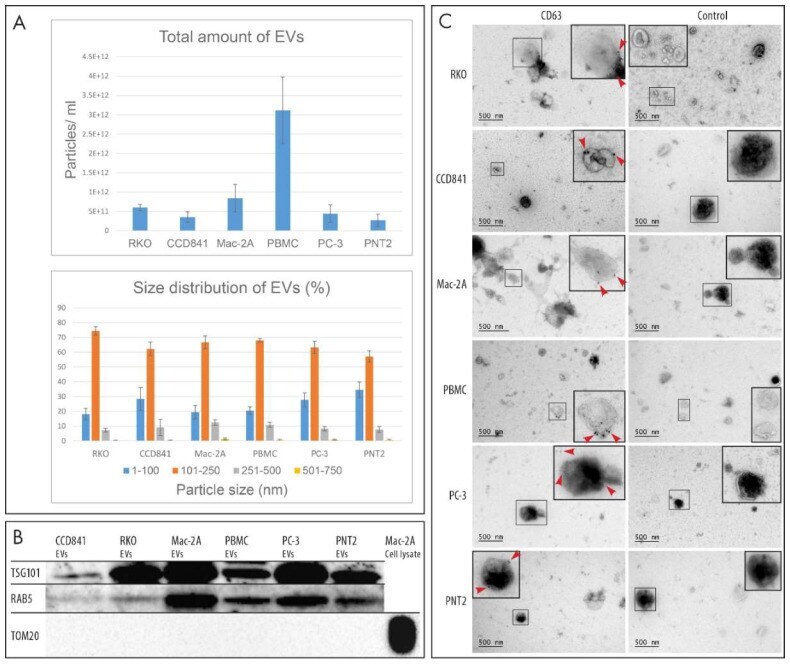
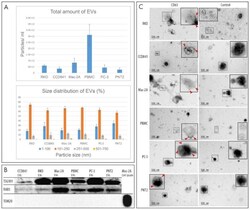
- Figure 2 Characterization of EVs. ( A ) Nanoparticle tracking analysis of total amount and size distribution of EVs. Four replicates of each EV type were analyzed. ( B ) Western blot analysis of TSG101 and RAB5 (conventional EV markers) revealed that these markers were present in all EV samples, while the mitochondrial protein TOM20 was present only in the cell lysate used as a control. Total of 1.0E10 EVs were loaded in each well. ( C ) Immunoelectron microscopy revealed the presence of the EV marker CD63 on the surface of EVs by 10-nm colloidal gold particles (red arrowheads). Immunostaining without the primary antibody was used as a negative control for CD63 immunoelectron microscopy.