 Explore
 Validate
 Learn
Learn Western blot
 ELISA
ELISAAntibody data
- Antibody Data
- Antigen structure
- References [10]
- Comments [0]
- Validations
- ELISA [2]
- Immunocytochemistry [3]
- Immunohistochemistry [2]
- Other assay [9]
Submit
Validation data
Reference
Comment
Report error
- Product number
- PA5-31260 - Provider product page

- Provider
- Invitrogen Antibodies
- Product name
- TSG101 Polyclonal Antibody
- Antibody type
- Polyclonal
- Antigen
- Recombinant full-length protein
- Description
- Recommended positive controls: 293T, A431, HeLa, HepG2, K562, THP-1, HL-60, Neuro 2A, C8D30, NIH-3T3, Raw264.7, C2C12, A549, H1299, HCT116, U87-MG, SK-N-SH, IMR32, SK-N-AS. Store product as a concentrated solution. Centrifuge briefly prior to opening the vial.
- Reactivity
- Human, Mouse, Rat
- Host
- Rabbit
- Isotype
- IgG
- Vial size
- 100 μL
- Concentration
- 1.42 mg/mL
- Storage
- Store at 4°C short term. For long term storage, store at -20°C, avoiding freeze/thaw cycles.
Submitted references Slingshot homolog-1 mediates the secretion of small extracellular vesicles containing misfolded proteins by regulating autophagy cargo receptors and actin dynamics.
Determining extracellular vesicles properties and miRNA cargo variability in bovine milk from healthy cows and cows undergoing subclinical mastitis.
Isolation and Characterization of Equine Uterine Extracellular Vesicles: A Comparative Methodological Study.
Proteomic profile of melanoma cell-derived small extracellular vesicles in patients' plasma: a potential correlate of melanoma progression.
Small Extracellular Vesicles in Pre-Therapy Plasma Predict Clinical Outcome in Non-Small-Cell Lung Cancer Patients.
Induction of a proliferative response in the zebrafish retina by injection of extracellular vesicles.
The Potential of CD16 on Plasma-Derived Exosomes as a Liquid Biomarker in Head and Neck Cancer.
JC Virus infected choroid plexus epithelial cells produce extracellular vesicles that infect glial cells independently of the virus attachment receptor.
Circulating Exosomes Inhibit B Cell Proliferation and Activity.
Enhanced generation of intraluminal vesicles in neuronal late endosomes in the brain of a Down syndrome mouse model with endosomal dysfunction.
Cazzaro S, Fang C, Khan H, Witas R, Kee TR, Woo JA, Kang DE
Frontiers in aging neuroscience 2022;14:933979
Frontiers in aging neuroscience 2022;14:933979
Determining extracellular vesicles properties and miRNA cargo variability in bovine milk from healthy cows and cows undergoing subclinical mastitis.
Saenz-de-Juano MD, Silvestrelli G, Bauersachs S, Ulbrich SE
BMC genomics 2022 Mar 7;23(1):189
BMC genomics 2022 Mar 7;23(1):189
Isolation and Characterization of Equine Uterine Extracellular Vesicles: A Comparative Methodological Study.
Almiñana C, Rudolf Vegas A, Tekin M, Hassan M, Uzbekov R, Fröhlich T, Bollwein H, Bauersachs S
International journal of molecular sciences 2021 Jan 19;22(2)
International journal of molecular sciences 2021 Jan 19;22(2)
Proteomic profile of melanoma cell-derived small extracellular vesicles in patients' plasma: a potential correlate of melanoma progression.
Pietrowska M, Zebrowska A, Gawin M, Marczak L, Sharma P, Mondal S, Mika J, Polańska J, Ferrone S, Kirkwood JM, Widlak P, Whiteside TL
Journal of extracellular vesicles 2021 Feb;10(4):e12063
Journal of extracellular vesicles 2021 Feb;10(4):e12063
Small Extracellular Vesicles in Pre-Therapy Plasma Predict Clinical Outcome in Non-Small-Cell Lung Cancer Patients.
Vetsika EK, Sharma P, Samaras I, Markou A, Georgoulias V, Whiteside TL, Kotsakis A
Cancers 2021 Apr 23;13(9)
Cancers 2021 Apr 23;13(9)
Induction of a proliferative response in the zebrafish retina by injection of extracellular vesicles.
Didiano D, Abner JJ, Hinger SA, Flickinger Z, Kent M, Clement MA, Balaiya S, Liu Q, Dai X, Levine EM, Patton JG
Experimental eye research 2020 Nov;200:108254
Experimental eye research 2020 Nov;200:108254
The Potential of CD16 on Plasma-Derived Exosomes as a Liquid Biomarker in Head and Neck Cancer.
Hofmann L, Ludwig S, Schuler PJ, Hoffmann TK, Brunner C, Theodoraki MN
International journal of molecular sciences 2020 May 26;21(11)
International journal of molecular sciences 2020 May 26;21(11)
JC Virus infected choroid plexus epithelial cells produce extracellular vesicles that infect glial cells independently of the virus attachment receptor.
O'Hara BA, Morris-Love J, Gee GV, Haley SA, Atwood WJ
PLoS pathogens 2020 Mar;16(3):e1008371
PLoS pathogens 2020 Mar;16(3):e1008371
Circulating Exosomes Inhibit B Cell Proliferation and Activity.
Schroeder JC, Puntigam L, Hofmann L, Jeske SS, Beccard IJ, Doescher J, Laban S, Hoffmann TK, Brunner C, Theodoraki MN, Schuler PJ
Cancers 2020 Jul 29;12(8)
Cancers 2020 Jul 29;12(8)
Enhanced generation of intraluminal vesicles in neuronal late endosomes in the brain of a Down syndrome mouse model with endosomal dysfunction.
D'Acunzo P, Hargash T, Pawlik M, Goulbourne CN, Pérez-González R, Levy E
Developmental neurobiology 2019 Jul;79(7):656-663
Developmental neurobiology 2019 Jul;79(7):656-663
No comments: Submit comment
Supportive validation
- Submitted by
- Invitrogen Antibodies (provider)
- Main image

- Experimental details
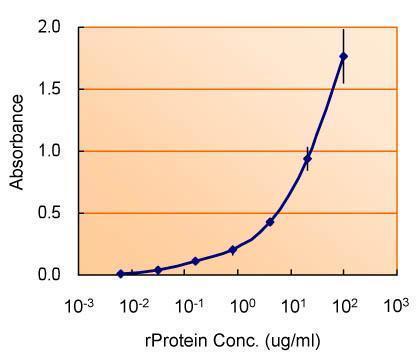
- ELISA detection of TSG101 using TSG101 Polyclonal Antibody (Product # PA5-31260) for capture at a concentration of 5 µg/mL and TSG101 Monoclonal Antibody (4A10) (Product # MA1-23296) for detection at a concentration of 1.5 µg/mL.
- Submitted by
- Invitrogen Antibodies (provider)
- Main image
- Experimental details
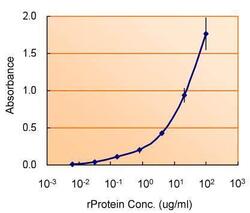
- ELISA detection of TSG101 using TSG101 Polyclonal Antibody (Product # PA5-31260) for capture at a concentration of 5 µg/mL and TSG101 Monoclonal Antibody (4A10) (Product # MA1-23296) for detection at a concentration of 1.5 µg/mL.

Supportive validation
- Submitted by
- Invitrogen Antibodies (provider)
- Main image
- Experimental details
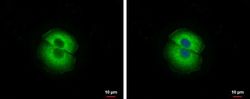
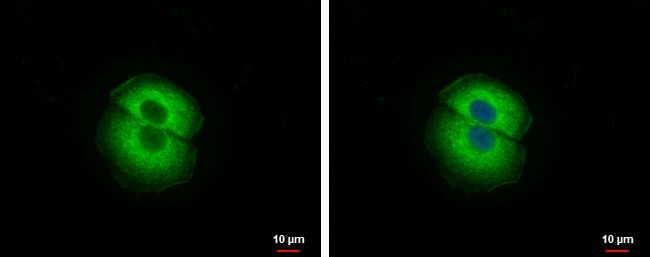
- Immunofluorescent analysis of TSG101 showing staining in the cytoplasm of A549 cells. A549 cells were fixed in 2% paraformaldehyde at RT for 15 min, and be permeabilized in 0.1% saponin, 10% NGS, 100mM glycine for 30 min and stained using a TSG101 polyclonal antibody (Product # PA5-31260) diluted at 1:500. Blue: Hoechst 33342 staining.
- Submitted by
- Invitrogen Antibodies (provider)
- Main image

- Experimental details
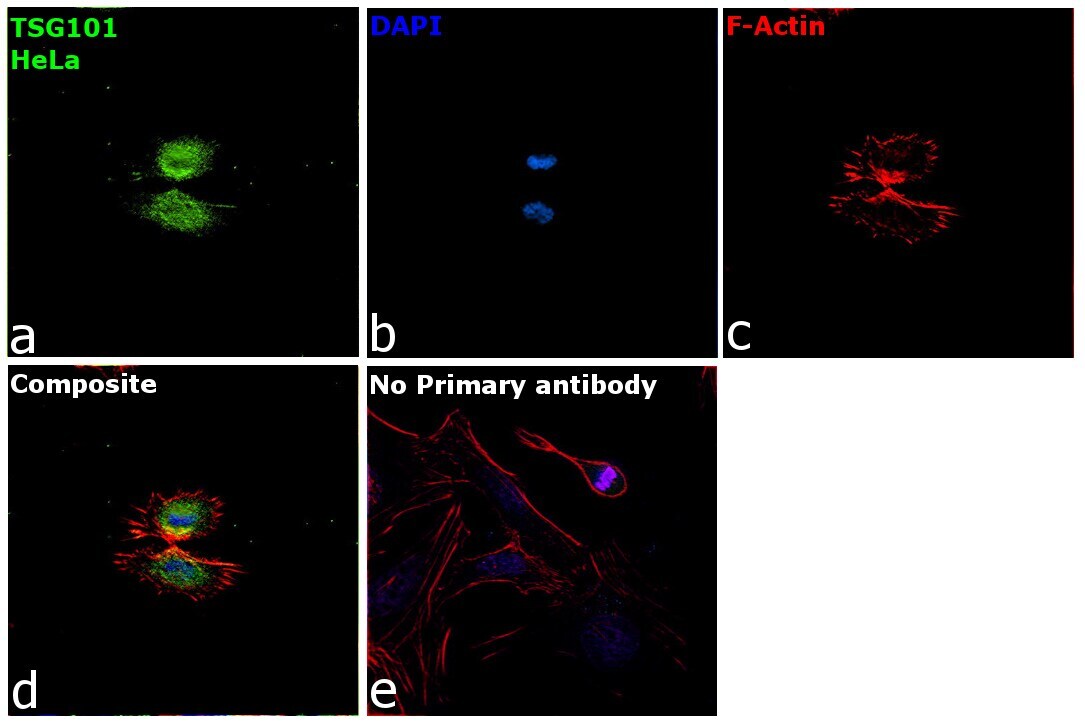
- Immunofluorescence analysis of Tsg101 was performed using 70% confluent log phase HeLa cells. The cells were fixed with 4% paraformaldehyde for 10 minutes, permeabilized with 0.1% Triton™ X-100 for 15 minutes, and blocked with 2% BSA for overnight at room temperature. The cells were labeled with TSG101 Polyclonal Antibody (Product # PA5-31260, 1:100( in 0.1% BSA, incubated at 4 degree celsius overnight and then labeled with Donkey anti-Rabbit IgG (H+L) Highly Cross-Adsorbed Secondary Antibody, Alexa Fluor™ Plus 488 (Product # A32790, 1:2000) for 45 minutes at room temperature (Panel a: Green). Nuclei (Panel b:Blue) were stained with ProLong™ Diamond Antifade Mountant with DAPI (Product # P36962). F-actin (Panel c: Red) was stained with Rhodamine Phalloidin (Product # R415, 1:300). Panel d represents the merged image showing centrosome and microtubule organizing center localization. Panel e represents control cells with no primary antibody to assess background. The images were captured at 40X magnification.
- Submitted by
- Invitrogen Antibodies (provider)
- Main image

- Experimental details
- Immunofluorescence analysis of Tsg101 was performed using 70% confluent log phase HeLa cells. The cells were fixed with 4% paraformaldehyde for 10 minutes, permeabilized with 0.1% Triton™ X-100 for 15 minutes, and blocked with 2% BSA for overnight at room temperature. The cells were labeled with TSG101 Polyclonal Antibody (Product # PA5-31260, 1:100( in 0.1% BSA, incubated at 4 degree celsius overnight and then labeled with Donkey anti-Rabbit IgG (H+L) Highly Cross-Adsorbed Secondary Antibody, Alexa Fluor™ Plus 488 (Product # A32790, 1:2000) for 45 minutes at room temperature (Panel a: Green). Nuclei (Panel b:Blue) were stained with ProLong™ Diamond Antifade Mountant with DAPI (Product # P36962). F-actin (Panel c: Red) was stained with Rhodamine Phalloidin (Product # R415, 1:300). Panel d represents the merged image showing centrosome and microtubule organizing center localization. Panel e represents control cells with no primary antibody to assess background. The images were captured at 40X magnification.

Supportive validation
- Submitted by
- Invitrogen Antibodies (provider)
- Main image

- Experimental details
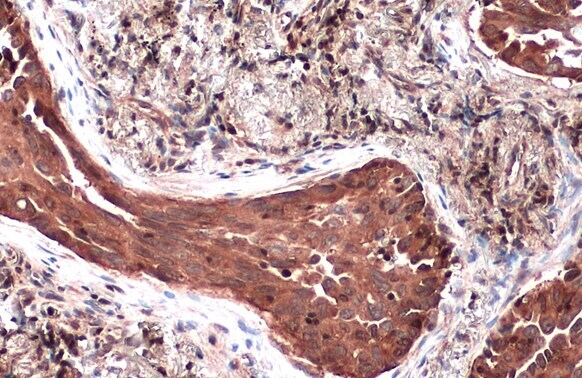
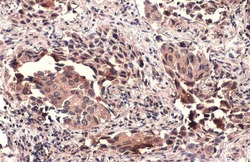
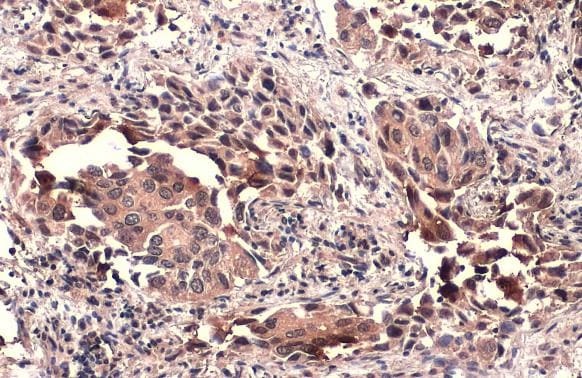
- Immunohistochemistry (Paraffin) analysis of TSG101 was performed in paraffin-embedded human lung cancer tissue using TSG101 Polyclonal Antibody (Product # PA5-31260) at a dilution of 1:500. Antigen Retrieval: Citrate buffer, pH 6.0, 15 min.
- Submitted by
- Invitrogen Antibodies (provider)
- Main image
- Experimental details
- TSG101 Polyclonal Antibody detects TSG101 protein at cytoplasm by immunohistochemical analysis. Sample: Paraffin-embedded human lung cancer. TSG101 stained by TSG101 Polyclonal Antibody (Product # PA5-31260) diluted at 1:500. Antigen Retrieval: Citrate buffer, pH 6.0, 15 min.
Supportive validation
- Submitted by
- Invitrogen Antibodies (provider)
- Main image
- Experimental details
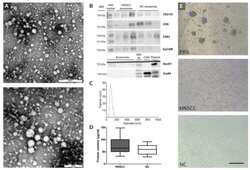
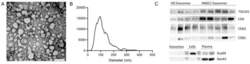
- Figure 2 Successful isolation of exosomes from blood plasma was verified by Transmission Electron Microscopy (TEM), Western Blot, and Nanoparticle tracking. ( A ) Two representative TEM graphs showing negatively stained exosomes isolated from an HNSCC patient. As indicated by the size bars, exosomes vary in diameter between 30 and 150 nm and have round to oval shapes. Size bar on the top TEM graph = 500 nm, size bar on the bottom TEM graph = 200 nm. ( B ) Western Blot analysis of exosomes was performed to confirm the expression of exosomal markers TSG101, CD9 and CD63 and the expression of epithelial cell marker EpCAM (upper frame). Exosomes were also analyzed for negative markers ApoA1 and Grp94 along with plasma (diluted 50x in PBS) and cell lysate samples as positive controls. MW marker, positive control molecular weight marker. ( C ) Size distribution of exosomes was measured by nanoparticle tracking. The mean diameter was 86.8 nm. The maximal and minimal diameters were 257.5 nm and 22.5 nm, respectively. The 90th and 10th percentile were at 121.2 and 53.6 nm, respectively. ( D ) Protein content of exosomes was determined by Bicinchoninic Acid (BCA) Assay. Average protein content: 80.9 g/mL (HNSCC exosomes), 69.2 g/mL (healthy volunteer exosomes). n = 23 (HNSCC), n = 10 (NC). HNSCC, exosomes from blood plasma of HNSCC patients. NC = no cancer, exosomes from blood plasma of healthy volunteers. ( E ) B cells that were not co-cultured with exosomes exhibited colony formation
- Submitted by
- Invitrogen Antibodies (provider)
- Main image
- Experimental details
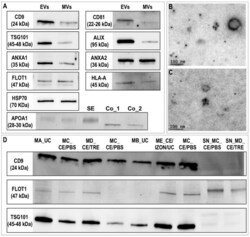
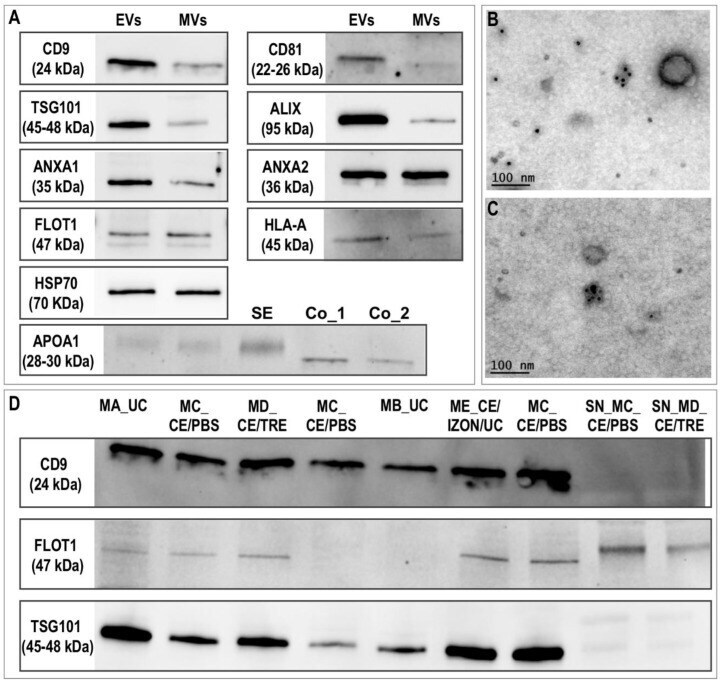
- Figure 4 Characterization of equine uterine extracellular vesicles (EVs) protein profile. ( A ) Western blotting characterization of EVs and microvesicles (MVs; pellet after centrifugation of uterine lavage at 12,000x g ) for known exosomal protein markers and apolipoprotein A1 (SE: Serum from mares; Co_1 and Co_2: Human apolipoprotein protein control 0.5 and 0.2 µg). ( B , C ) Representative images of electron microphotographs of CD9 immunogold labelling of EVs. ( D ) Western blotting comparison of EVs obtained by different methods for three known exosomal markers (CD9, FLOT1, and TSG101). MA_UC: EVs obtained by ultracentrifugation (UC) 100,000x g (2x) 90 min using fixed angle rotor and Beckman bottles; MB_UC: UC with swing-out rotor and Beckman tubes; MC_CE/PBS: ultrafiltration by using Centricon filters followed by a washing step with PBS; MD_CE/TRE: similar to before but washing step with PBS/25 mM trehalose; ME_CE/IZON/UC: obtained by the combination of CE, followed by SEC, Izon qEV columns and the collection of fractions enriched in EVs (7,8,9) and concentration of EVs fractions by UC; SN_MC_CE_PBS and SN_MD_CE_TRE: supernatant obtained after first UC from MC_CE/PBS and MD_CE/TRE.
- Submitted by
- Invitrogen Antibodies (provider)
- Main image
- Experimental details
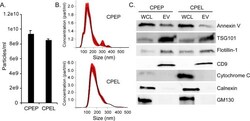
- Fig 2 Extracellular vesicles concentrated from CPEP and CPEL cells display similar characteristics and express extracellular vesicle markers. (A) Nanoparticle tracking analysis of extracellular vesicles (EV) produced by primary and immortalized choroid plexus epithelial cells. (B) EV size and distribution is similar between CPEP and CPEL cells. (C) Extracellular vesicles concentrated from CPEP and CPEL cells by differential centrifugation express the characteristic EV markers Annexin V, TSG101, Flotillin-1, and CD9. Markers of contaminating cellular organelles (cytochrome c, calnexin, GM130) were detected in whole cell lysates but not in EV fractions.

- Submitted by
- Invitrogen Antibodies (provider)
- Main image
- Experimental details
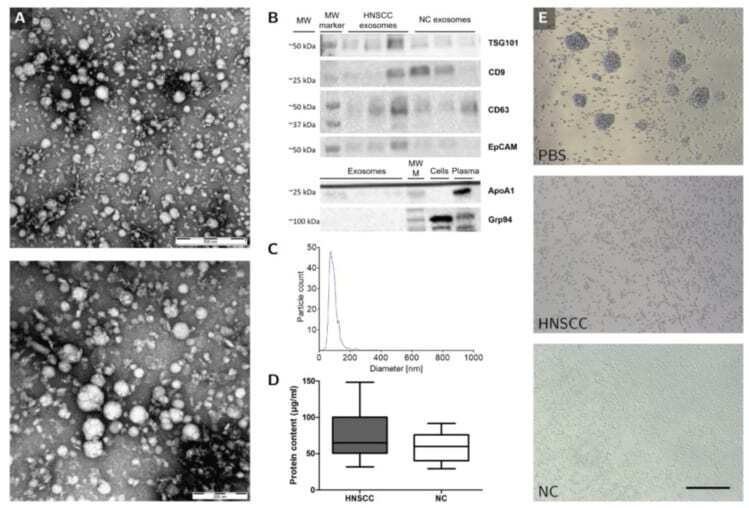
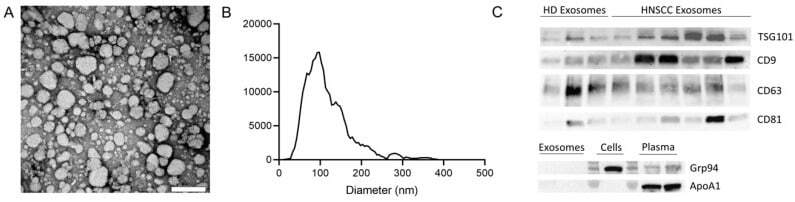
- Figure 1 Characterization of exosomes isolated from plasma. ( A ) Representative transmission electron microscopy (TEM) image of exosomes. Scalebar = 200 nm. ( B ) Representative size distribution of exosomes measured by nanoparticle tracking analysis (NTA). ( C ) Exosomes derived from plasma of healthy donors (HD) and head and neck squamous cell carcinoma (HNSCC) patients were analyzed by Western blot for the presence of exosome specific markers using antibodies against CD63 and CD81 under non-reducing conditions and antibodies against CD9 and TSG101 under reducing conditions. Western blot analysis for the negative marker Grp94 and the apolipoprotein Apo1A was also performed for exosomes, cells, and plasma.
- Submitted by
- Invitrogen Antibodies (provider)
- Main image
- Experimental details
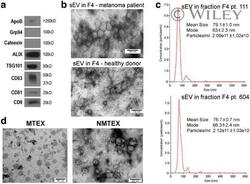
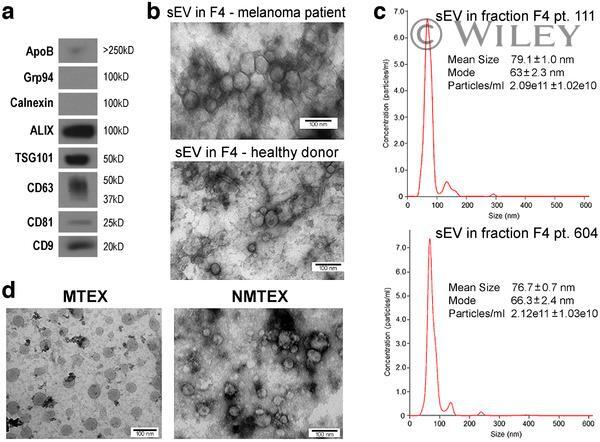
- 1 FIGURE Characterization of sEV isolated from plasma. Panel a - western blot characterization of exosome markers in sEV collected in fraction #4 as described in Materials and Methods. Panel b - a TEM image of sEV in fraction #4 obtained from plasma of a melanoma patient or healthy donor. Panel c - NanoSight profiles of EVs in fraction #4 of two patients with melanoma. Panel d - TEM of MTEX detached from anti-CSPG4 mAbs on beads and NMTEX that remain in suspension following immune capture
- Submitted by
- Invitrogen Antibodies (provider)
- Main image
- Experimental details
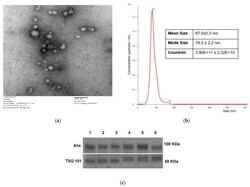
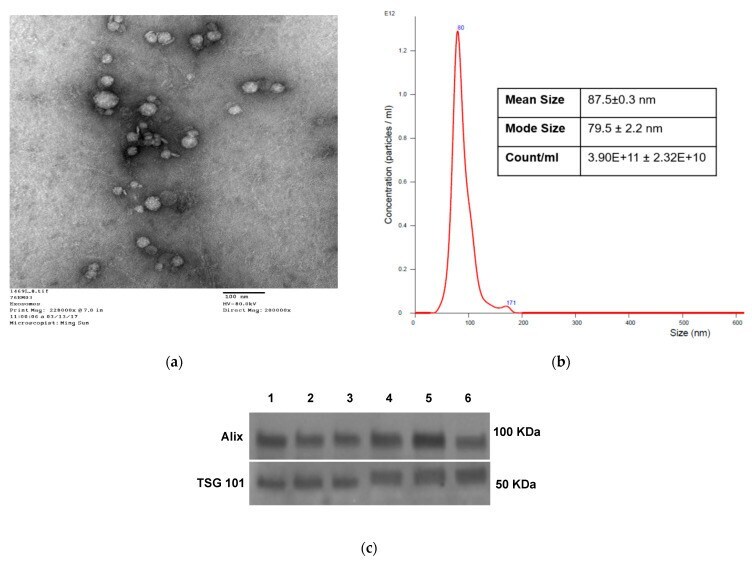
- Figure 1 Characteristics of sEV isolated from NSCLC plasma. ( a ) Transmission electron microscopy of isolated NSCLC exosomes. ( b ) Size and concentration of NSCLC exosomes as determined by tunable resistive sensing (TRPS). ( c ) TSG101 and ALIX detection by Western blots in sEV isolated from plasma of several different patients with NSCLC. Each lane was loaded with 10 ug sEV protein present in fraction #4.
- Submitted by
- Invitrogen Antibodies (provider)
- Main image
- Experimental details
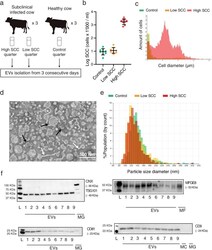
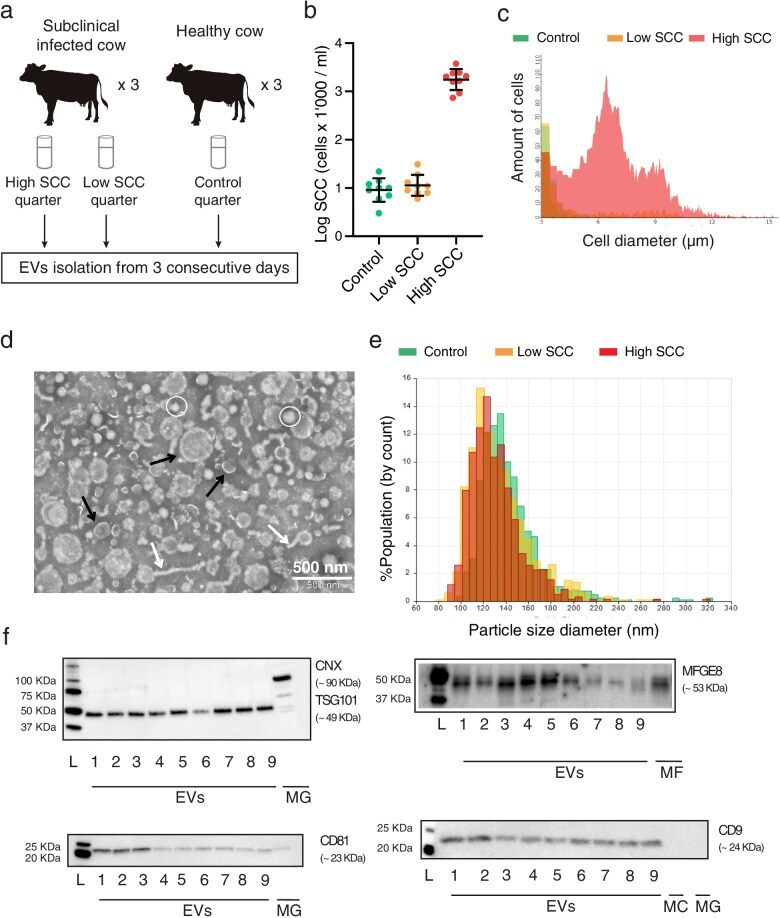
- Fig. 1 a Experimental design. EVs: Extracellular Vesicles b Scatterplot showing the somatic cell count (SCC) of the Control group, the Low SCC and the High SCC on a logarithmic scale. Lower-case letters denote significant differences ( P < 0.05) after applying non-parametric Kruskal-Wallis and Dunn's multiple comparisons tests. c Diameter distribution of milk cells in one High SCC (red), Low SCC (yellow) and Control (Green) sample, respectively. d Transmission electron microscopy (TEM) observation of isolated milk EVs. Black arrows indicate microvesicles and exosomes; white ovals highlight non-vesicles and white arrows point at shapeless aggregations with low electron density []. e Representative graphs of size distribution from three milk EVs samples measured with tunable resistive pulse sensing technology. f Western blot characterization for the EVs protein markers CXN, TSG101, CD81, CD9 and MFGE8. The absence of CXN suggests no contamination during the isolation with intracellular debris; L: Ladder; 1-9: Milk EVs pellets; MG: Mammary gland tissue; MF: Milk Fat; MC: Milk cells. Full-length blots are presented in Supplementary Fig. S 4
- Submitted by
- Invitrogen Antibodies (provider)
- Main image
- Experimental details
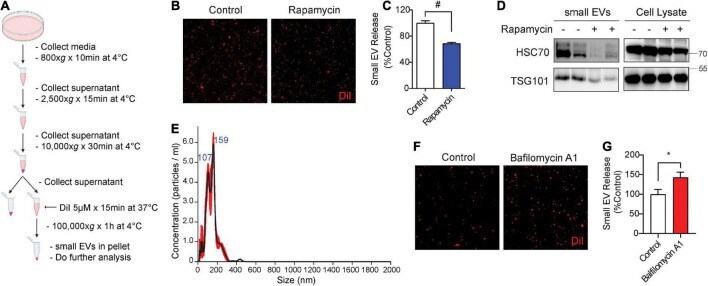
- FIGURE 1 Rapamycin decreases and bafilomycin A1 increases small EV secretion. (A) Schematic of small EV isolation method. (B) Representative images of DiI-stained small EVs secreted from NIH3T3 cells with or without 200 nM rapamycin treatment for 24 h. (C) Quantification of secreted small EVs for (B) . Data are presented as means +- SEM. n = 3 independent experiments, t -test, # P < 0.0001. (D) Representative immunoblots for the indicated proteins in secreted small EVs and cell lysates from NIH3T3 cells with or without 200 nM rapamycin treatment for 24 h. (E) Representative NTA analysis of small EVs isolated from NIH3T3 cells. The black line indicates concentration and size of particles, and the red line indicates standard error. (F) Representative images of DiI-stained small EVs secreted from NIH3T3 cells with or without 200 nM bafilomycin A1 treatment for 6 h. (G) Quantification of secreted small EVs for (F) . Data are presented as means +- SEM. n = 4 independent experiments, t -test, * P = 0.02.
- Submitted by
- Invitrogen Antibodies (provider)
- Main image
- Experimental details
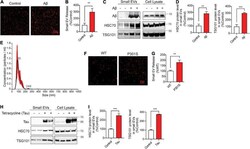
- FIGURE 5 Abeta42 oligomers (Abeta42) oligomers and misfolded tau increase small EV secretion and are associated with secreted small EVs. (A) Representative images of DiI-stained small EVs secreted from HT22 cells with or without 250 nM Abeta treatment for 24 h. (B) Quantification of secreted small EVs for (A) . Data are presented as means +- SEM. n = 3 independent experiments, t -test, ** P < 0.005. (C) Representative immunoblots for the indicated proteins in secreted small EVs and cell lysates from HT22 cells with or without 250 nM Abeta treatment for 24 h. (D) Quantification of Hsc70 and TSG101 (small EV markers) for (C) . Data are presented as means +- SEM. n = 4 independent experiments, t -test, *** P = 0.0007, ** P < 0.004. (E) Representative NTA analysis of vesicle size distribution of small EVs isolated from HT22 cells. The black line indicates concentration and size of particles, and the red line indicates standard error. (F) Representative images of DiI-stained small EVs secreted by DIV10 cortical primary neurons derived from C57BL6 (WT) or tau P 301 S (P301S) mice. (G) Quantification of secreted small EVs for (F) . Data are presented as means +- SEM. n = 3 independent experiments, t -test, ** P = 0.002. (H) Representative immunoblots for the indicated proteins in secreted small EVs and cell lysates from tet-inducible iHEK-P301L cells expressing tau P 301 L , with or without tetracycline. (I) Quantification of Hsc70 and TSG101 (small EV markers) for (H) . Data are pr
