Explore
 Validate
 Learn
Learn Western blot
 ELISA
ELISAAntibody data
- Antibody Data
- Antigen structure
- References [1]
- Comments [0]
- Validations
- Western blot [1]
- Other assay [2]
Submit
Validation data
Reference
Comment
Report error
- Product number
- PA5-96794 - Provider product page

- Provider
- Invitrogen Antibodies
- Product name
- BAG2 Polyclonal Antibody
- Antibody type
- Polyclonal
- Antigen
- Recombinant full-length protein
- Description
- Immunogen sequence: MAQAKINAKA NEGRFCRSSS MADRSSRLLE SLDQLELRVE ALREAATAVE QEKEILLEMI HSIQNSQDMR QISDGEREEL NLTANRLMGR TLTVEVSVET IRNPQQQESL KHATRIIDEV VNKFLDDLGN AKSHLMSLYS ACSSEVPHGP VDQKFQSIVI GCALEDQKKI KRRLETLLRN IENSDKAIKL LEHSKGAGSK TLQQNAESRF N; Positive Samples: HeLa, Jurkat, HepG2
- Reactivity
- Human
- Host
- Rabbit
- Isotype
- IgG
- Vial size
- 100 μL
- Concentration
- 1.23 mg/mL
- Storage
- -20°C, Avoid Freeze/Thaw Cycles
Submitted references Stress routes clients to the proteasome via a BAG2 ubiquitin-independent degradation condensate.
Carrettiero DC, Almeida MC, Longhini AP, Rauch JN, Han D, Zhang X, Najafi S, Gestwicki JE, Kosik KS
Nature communications 2022 Jun 2;13(1):3074
Nature communications 2022 Jun 2;13(1):3074
No comments: Submit comment
Supportive validation
- Submitted by
- Invitrogen Antibodies (provider)
- Main image
- Experimental details
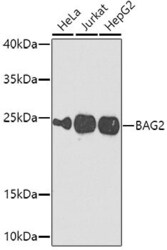
- Western blot analysis of BAG2 in extracts of various cell lines. Samples were incubated with BAG2 Polyclonal antibody (Product # PA5-96794) using a dilution of 1:1,000, followed by HRP Goat Anti-Rabbit IgG (H+L) at a dilution of 1:10,000. Lysates/proteins: 25 µg per lane. Blocking buffer: 3% nonfat dry milk in TBST. Detection: ECL Enhanced Kit. Exposure time: 60s.

Supportive validation
- Submitted by
- Invitrogen Antibodies (provider)
- Main image
- Experimental details
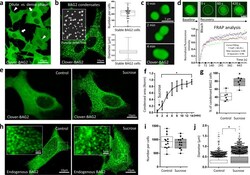
- Fig. 1 BAG2 condensation in response to stress. a Representative image of cells expressing BAG2 in both dilute (arrowhead) and dense phases (arrow) in SH-SY5Y cells stably expressing clover-BAG2. 49.7 +- 12.5% of the clover-BAG2 population contained condensates (915 cells, n = 5, mean +- SD). b Representative image of cells containing BAG2 condensates illustrating puncta detection (insert). Number of condensates per cell (45 cells, n = 3); condensate diameter (2798 condensates, 10 cells, n = 3). Box: 25th and 75th percentiles. Line: median. Whiskers: smallest to the largest values. Dots: individual cell. c Image over time (Supplementary Movie 1 ): fusion of two BAG2 condensates. d Condensates dynamically exchanged BAG2 molecules with the dilute phase as demonstrated by FRAP analysis. Images showing representation of pre-bleaching (baseline), bleaching and post-bleaching fluorescence recovery; graph: fluorescence recovery quantification over time. Colors: different condensates. Insert: Fitting curve mean values for exponential recovery. e Representative image of a clover-BAG2 stable cell before and after stress (Sucrose 125 mM, 15 min). f Quantification of the total BAG2 condensation area over time. Condensation area is shown as the total sum of clover-BAG2 area normalized by its highest value, * from p = 3 x 10 -2 (2 min) to p < 1.0 x 10 -4 (14 min); one-way ANOVA followed by the Dunnett's test, n = 3, 8 cells, mean +- SD. g Percentage of clover-BAG2 cells that contained cond

- Submitted by
- Invitrogen Antibodies (provider)
- Main image
- Experimental details
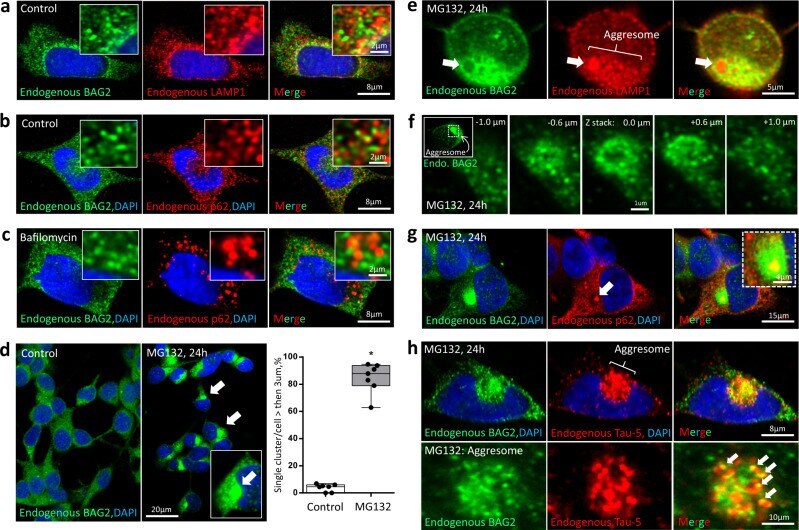
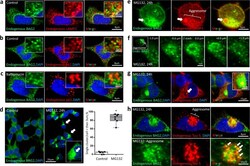
- Fig. 7 BAG2 condensates with UPS inhibition. Co-immunostaining of BAG2 and LAMP-1 ( a ) or BAG2 and p62/SQSTM1 ( b ) in control cells, showing no co-localization between markers (insert). c Bafilomycin (15 h, 50 nM), an autophagy inhibitor, did not change the endogenous BAG2 pattern. d Immunostaining of endogenous BAG2 in SH-SY5Y cells treated with MG132 (24 h, 10 uM) showing a robust increase in the percentage of BAG2 cells containing a single aggresome-like structure (>3 um) of endogenous BAG2 condensates, not observed in non-treated cells (273 cells, 7 independent replicates; * p = 3.2 x 10 -10 , two-sided Student's t test). Box and whiskers: the boxplots are centered around the median and extend from the 25th to 75th percentiles. The whiskers go down to the smallest value and up to the largest. Dots represent replicates. e Co-immunostaining for endogenous BAG2 and LAMP-1 after 24 h of MG132 treatment revealed intense staining of both markers in the aggresome; however, LAMP-1 showed strong staining at sites devoid of BAG2 signal (arrow). f Images showing a higher magnification of 5 different Z-stack acquisition (from -1 um to +1 um) of the aggresome (see insert) revealing multiple small BAG2 condensates (~0.2 um) surrounding a well-defined BAG2-negative core. g Co-immunostaining for endogenous BAG2 and p62/SQSTM1 after 24 h of MG132 revealed intense staining for both markers in the aggresome (see also Supplementary Fig 11b ). p62/SQSTM1 forms a well-defined region (arrow)