 Explore
 Validate
 Learn
Learn Western blot
 Immunocytochemistry
Antibody data
- Antibody Data
- Antigen structure
- References [1]
- Comments [0]
- Validations
- Immunocytochemistry [2]
- Chromatin Immunoprecipitation [2]
Submit
Validation data
Reference
Comment
Report error
- Product number
- 710190 - Provider product page

- Provider
- Invitrogen Antibodies
- Product name
- Rex1 Recombinant Superclonal™ Antibody (14HCLC)
- Antibody type
- Other
- Antigen
- Recombinant full-length protein
- Description
- Recombinant rabbit Superclonal™ antibodies are unique offerings from Thermo Fisher Scientific. They are comprised of a selection of multiple different recombinant monoclonal antibodies, providing the best of both worlds - the sensitivity of polyclonal antibodies with the specificity of monoclonal antibodies - all delivered with the consistency only found in a recombinant antibody. While functionally the same as a polyclonal antibody - recognizing multiple epitope sites on the target and producing higher detection sensitivity for low abundance targets - a recombinant rabbit Superclonal™ antibody has a known mixture of light and heavy chains. The exact population can be produced in every lot, circumventing the biological variability typically associated with polyclonal antibody production. Note: Formerly called “Recombinant polyclonal antibody”, this product is now rebranded as “Recombinant Superclonal™ antibody”. The physical product and the performance remain unchanged.
- Reactivity
- Human, Rat, Canine
- Host
- Rabbit
- Isotype
- IgG
- Antibody clone number
- 14HCLC
- Vial size
- 100 μg
- Concentration
- 0.5 mg/mL
- Storage
- Store at 4°C short term. For long term storage, store at -20°C, avoiding freeze/thaw cycles.
Submitted references Wnt- and glutamate-receptors orchestrate stem cell dynamics and asymmetric cell division.
Junyent S, Reeves JC, Szczerkowski J, Garcin CL, Trieu TJ, Wilson M, Lundie-Brown J, Habib SJ
eLife 2021 May 24;10
eLife 2021 May 24;10
No comments: Submit comment
Supportive validation
- Submitted by
- Invitrogen Antibodies (provider)
- Main image
- Experimental details
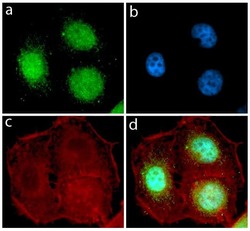
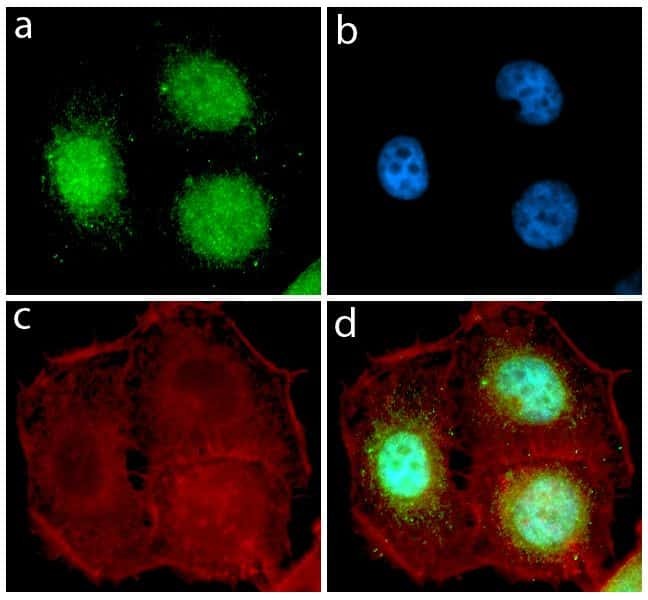
- Immunofluorescent analysis of Rex1 in HeLa cells using a Rex1 Recombinant Rabbit Polyclonal Antibody (Product # 710190) followed by detection using an Alexa Fluor 488-conjugated Goat anti-Rabbit secondary antibody (green) (Image A). Nuclei were stained using DAPI (Image B) and actin stained with Alexa Fluor 594 phalloidin (red) (image C). Image D is a composite image showing nuclear localization of Rex1.
- Submitted by
- Invitrogen Antibodies (provider)
- Main image

- Experimental details
- Immunofluorescent analysis of Rex1 in HeLa cells using a Rex1 Recombinant Rabbit Superclonal™ Antibody (Product # 710190) followed by detection using an Alexa Fluor 488-conjugated Goat anti-Rabbit secondary antibody (green) (Image A). Nuclei were stained using DAPI (Image B) and actin stained with Alexa Fluor 594 phalloidin (red) (image C). Image D is a composite image showing nuclear localization of Rex1.

Supportive validation
- Submitted by
- Invitrogen Antibodies (provider)
- Main image

- Experimental details
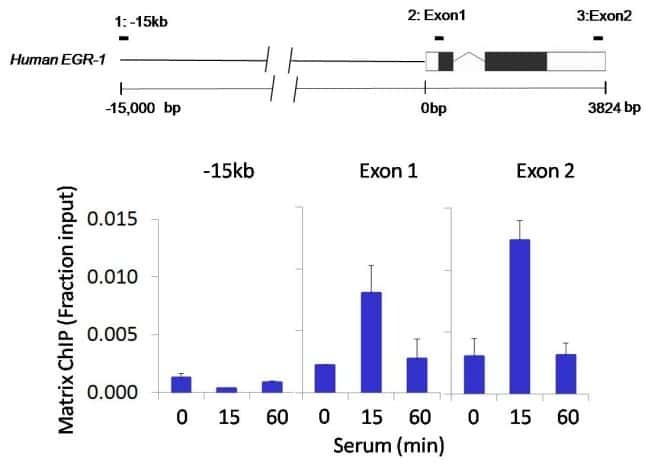
- Chromatin immunoprecipitation analysis of Rex1 performed using cross-linked chromatin from 1 x 10^6 HCT116 human colon carcinoma cells treated with serum for 0, 15, and 60 minutes. Immunoprecipitation was performed using a multiplex microplate Matrix ChIP assay (see reference for Matrix ChIP protocol: http://www.ncbi.nlm.nih.gov/pubmed/22098709) with 1.0 µL/100 µL well volume of a Rex1 Recombinant Rabbit Polyclonal Antibody (Product # 710190). Chromatin aliquots from ~1 x 10^5 cells were used per ChIP pull-down. Quantitative PCR data were done in quadruplicate using 1 µL of eluted DNA in 2 µL SYBR real-time PCR reactions containing primers to amplify -15kb upstream of the human Egr-1 locus, or exon-1 or exon-2 of Egr-1. PCR calibration curves were generated for each primer pair from a dilution series of sheared total genomic DNA. Quantitation of immunoprecipitated chromatin is presented as signal relative to the total amount of input chromatin. Results represent the mean +/- SEM for three experiments. A schematic representation of the Egr-1 locus is shown above the data where boxes represent exons (black boxes = translated regions, white boxes = untranslated regions), the zigzag line represents an intron, and the straight line represents upstream sequence. Regions amplified by Egr-1 primers are represented by black bars. Data courtesy of the Innovators Program.
- Submitted by
- Invitrogen Antibodies (provider)
- Main image

- Experimental details
- Chromatin immunoprecipitation analysis of Rex1 performed using cross-linked chromatin from 1 x 10^6 HCT116 human colon carcinoma cells treated with serum for 0, 15, and 60 minutes. Immunoprecipitation was performed using a multiplex microplate Matrix ChIP assay (see reference for Matrix ChIP protocol: http://www.ncbi.nlm.nih.gov/pubmed/22098709) with 1.0 µL/100 µL well volume of a Rex1 Recombinant Rabbit Superclonal™ Antibody (Product # 710190). Chromatin aliquots from ~1 x 10^5 cells were used per ChIP pull-down. Quantitative PCR data were done in quadruplicate using 1 µL of eluted DNA in 2 µL SYBR real-time PCR reactions containing primers to amplify -15kb upstream of the human Egr-1 locus, or exon-1 or exon-2 of Egr-1. PCR calibration curves were generated for each primer pair from a dilution series of sheared total genomic DNA. Quantitation of immunoprecipitated chromatin is presented as signal relative to the total amount of input chromatin. Results represent the mean +/- SEM for three experiments. A schematic representation of the Egr-1 locus is shown above the data where boxes represent exons (black boxes = translated regions, white boxes = untranslated regions), the zigzag line represents an intron, and the straight line represents upstream sequence. Regions amplified by Egr-1 primers are represented by black bars. Data courtesy of the Innovators Program.
