Explore
 Validate
 Learn
Learn Western blot
 Immunocytochemistry
 Immunoprecipitation
Antibody data
- Antibody Data
- Antigen structure
- References [3]
- Comments [0]
- Validations
- Immunocytochemistry [2]
- Other assay [5]
Submit
Validation data
Reference
Comment
Report error
- Product number
- MA1-46461 - Provider product page

- Provider
- Invitrogen Antibodies
- Product name
- STRN3 Monoclonal Antibody (S68)
- Antibody type
- Monoclonal
- Antigen
- Synthetic peptide
- Description
- This antibody is specific for SG2NA. It does not cross-react with Striatin.
- Reactivity
- Human, Mouse, Rat
- Host
- Mouse
- Isotype
- IgG
- Antibody clone number
- S68
- Vial size
- 100 μL
- Concentration
- Conc. Not Determined
- Storage
- Store at 4°C short term. For long term storage, store at -20°C, avoiding freeze/thaw cycles.
Submitted references SG2NA is a regulator of endoplasmic reticulum (ER) homeostasis as its depletion leads to ER stress.
GSK3β and ERK regulate the expression of 78 kDa SG2NA and ectopic modulation of its level affects phases of cell cycle.
Tissue specific expression of SG2NA is regulated by differential splicing, RNA editing and differential polyadenylation.
Jain BP, Pandey S, Saleem N, Tanti GK, Mishra S, Goswami SK
Cell stress & chaperones 2017 Nov;22(6):853-866
Cell stress & chaperones 2017 Nov;22(6):853-866
GSK3β and ERK regulate the expression of 78 kDa SG2NA and ectopic modulation of its level affects phases of cell cycle.
Pandey S, Talukdar I, Jain BP, Tanti GK, Goswami SK
Scientific reports 2017 Aug 8;7(1):7555
Scientific reports 2017 Aug 8;7(1):7555
Tissue specific expression of SG2NA is regulated by differential splicing, RNA editing and differential polyadenylation.
Jain BP, Chauhan P, Tanti GK, Singarapu N, Ghaskadbi S, Goswami SK
Gene 2015 Feb 10;556(2):119-26
Gene 2015 Feb 10;556(2):119-26
No comments: Submit comment
Supportive validation
- Submitted by
- Invitrogen Antibodies (provider)
- Main image

- Experimental details
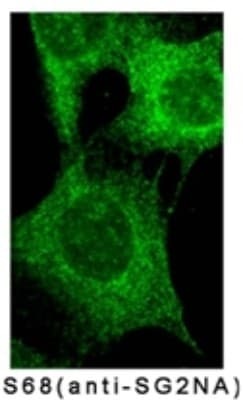
- Immunocytochemistry analysis of STRN3 in NIH3T3 cells. Samples were incubated in STRN3 monoclonal antibody (Product # MA1-46461).
- Submitted by
- Invitrogen Antibodies (provider)
- Main image

- Experimental details
- Immunocytochemistry analysis of STRN3 in NIH3T3 cells. Samples were incubated in STRN3 monoclonal antibody (Product # MA1-46461).

Supportive validation
- Submitted by
- Invitrogen Antibodies (provider)
- Main image
- Experimental details
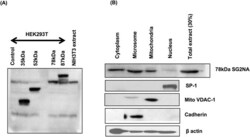
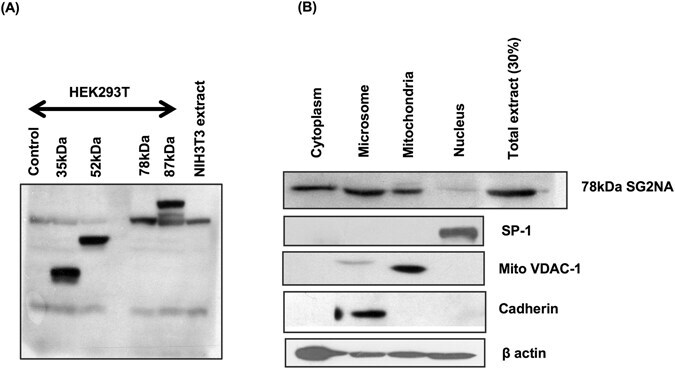
- Figure 1 NIH3T3 has only 78 kDa isoform enriched in cytosol and microsomes. ( A ) NIH3T3 cells were harvested and 75 mug of protein lysates were loaded on SDS-polyacrylamide gel and blotted with SG2NA antibody. Protein was extracted from transiently transfected HEK293T cells harbouring various isoforms of SG2NA i.e., 35 kDa, 52 kDa, 78 kDa and 87 kDa were loaded to act as markers. ( B ) NIH3T3 cells were fractionated and each organelle rich fraction was loaded and blotted with SG2NA antibody, authenticity of the fractions were confirmed by probing with organelle specific markers. Full length blots for panel (B) are shown in Supplementary Figure S1 .
- Submitted by
- Invitrogen Antibodies (provider)
- Main image
- Experimental details
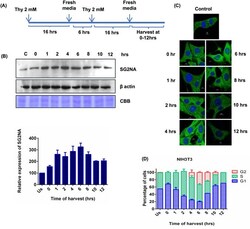
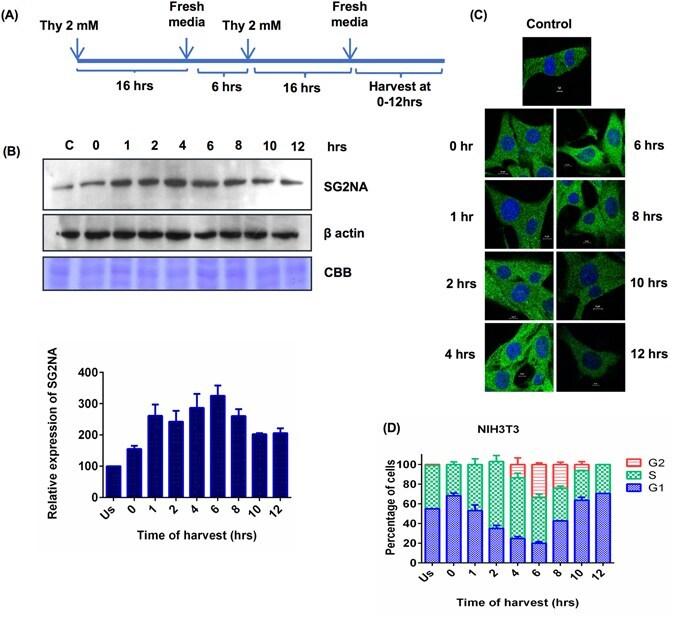
- Figure 2 SG2NA is modulated during the course of cell cycle. ( A ) Schematic representation of synchronisation of cells using double thymidine block. ( B ) Upper panel , NIH3T3 cells were synchronised and allowed to enter the cell cycle, cells were harvested at different time points and 75 mug protein lysates were loaded on SDS-polyacrylamide gel followed by probing with SG2NA and beta-actin antibodies. Equal loading of protein was shown by CBB stained gel. Bottom panel , Graph representing quantitation of western analysis of SG2NA level during the course of cell cycle. ( C ) Confocal images of synchronised NIH3T3 cells at various time points of cell cycle. Magnification- 60X, scale bar - 10 mum. ( D ) Graph representing percentage of cells present in various phases of cell cycle at different time of harvest. Error bars are the standard deviation of 3 experiments. Full length blots for panel (B) are shown in Supplementary Figure S1 .
- Submitted by
- Invitrogen Antibodies (provider)
- Main image
- Experimental details
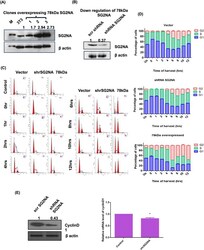
- Figure 3 SG2NA downregulation increases the G1 phase duration while upregulation increases G2 phase duration. ( A ) Cells stably overexpressing 78 kDa and ( B ) underexpressing SG2NA were harvested, 100 mug of cell lysates were loaded on SDS-polyacrylamide gel and immunoblotted with SG2NA and beta-actin antibody. Numbers on the top of bands represent fold change in protein levels relative to untransfected NIH3T3 cells. ( C ) Representative FACS histograms of NIH3T3 cells stably transfected with vector alone, 78 kDa SG2NA and shRNA against SG2NA. ( D ) Graphical representation of the percentage of cells present in different phases of cell cycle during the cell cycle preogression. ( E ) Left panel: Lysates of normal NIH3T3 cells and SG2NA downregulated cells were loaded on SDS-polyacrylamide gel and probed with cyclin D1 and beta-actin. Right panel : Graph representing real time analysis by qPCR for cyclin D1 mRNA expression in normal NIH3T3 cells and SG2NA downregulated cells. Error bars are the standard deviation of 3 experiments. *P < 0.05, **P < 0.01, ***P < 0.001. Full length blots for panel (A) and (B) are shown in Supplementary Figure S1 .

- Submitted by
- Invitrogen Antibodies (provider)
- Main image
- Experimental details
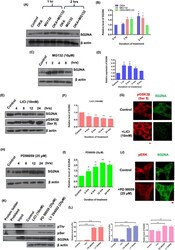
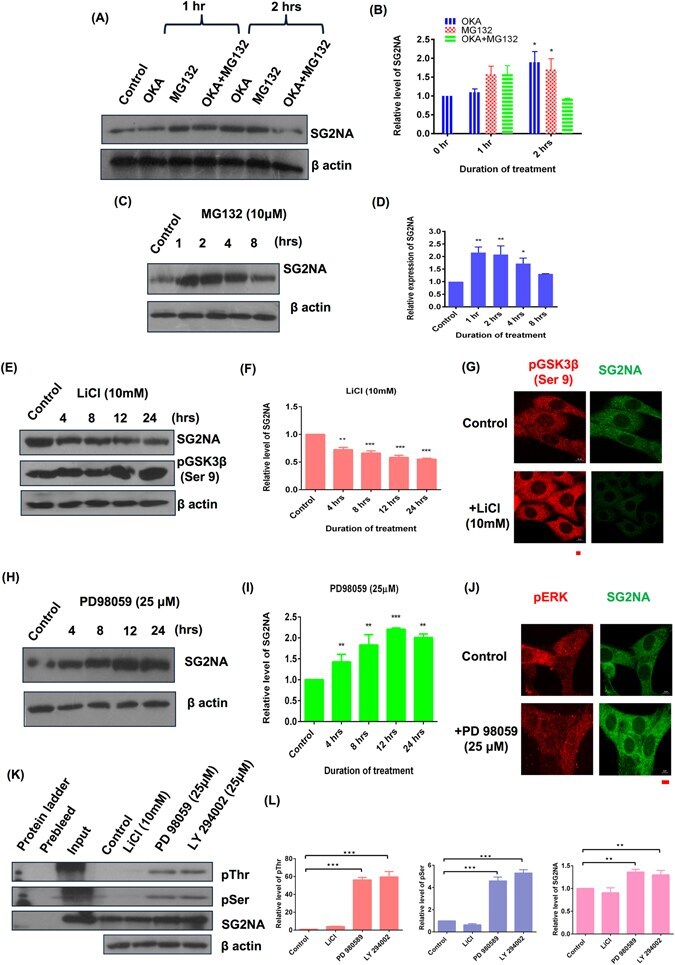
- Figure 5 SG2NA is regulated at protein level by proteasomal degradation and its hyperphosphorylated form is more stable. NIH3T3 cells were treated with ( A ) 100 muM Okadoic acid alone and 10 muM MG132 and mixture of both ( C ) 10 muM MG132 alone ( E ) 10 mM LiCl ( H ) 25 muM PD98059, for various time points and western analysis was done with SG2NA and beta-actin antibody. Graph representing quantitaive analysis of relative expression of SG2NA in time dependent manner upon their treatment is shown in ( B ), ( D ), ( F ) and ( I ) repectively. Confocal images of the cells treated with LiCl and PD98059 is shown in ( G ) and ( J ) respectively. Magnification- 60X, scale bar- 10 mum. ( K ) NIH3T3 cells were treated with various inhibitors as LiCl, PD98059 and LY294002 for 12 hrs and cell lysates were immunoprecipitated with SG2NA antibody followed by blotting with phosphoserine, phosphothreonine and SG2NA antibodies. Equal loading is shown by beta-actin. ( L ) Graphs representing relative level of respective proteins with beta-actin as loading control is shown. Error bars are the standard deviation of 2 independent experiments. *P < 0.05, **P < 0.01, ***P < 0.001. Full length blots for panel (A), (C), (E), (H) and (K) are shown in Supplementary Figure S1 .
- Submitted by
- Invitrogen Antibodies (provider)
- Main image

- Experimental details
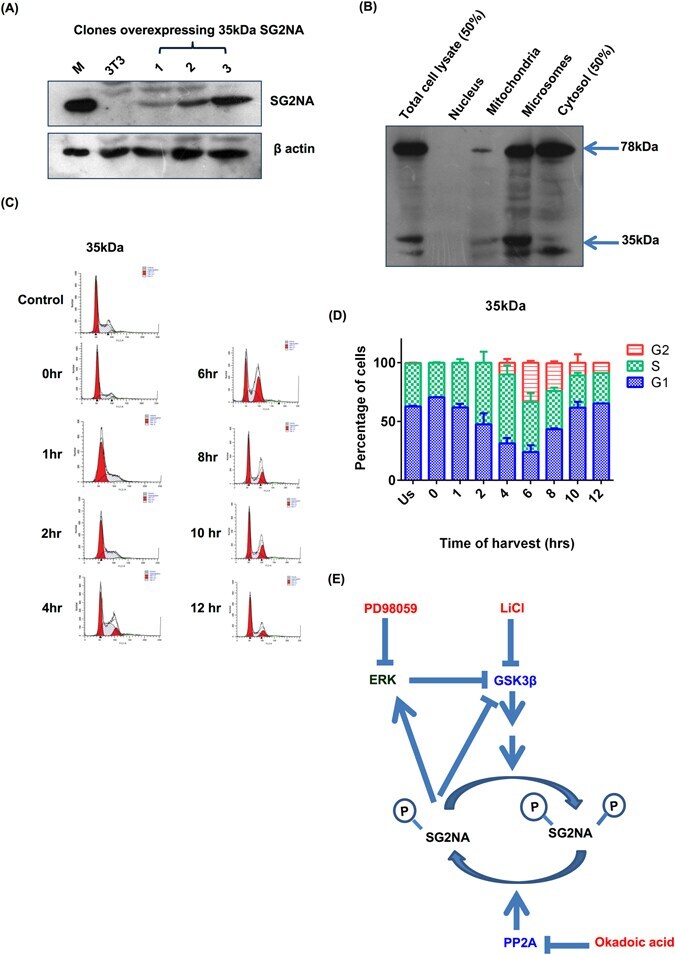
- Figure 7 35 kDa variant of SG2NA has no role in cell cycle. ( A ) Cells stably overexpressing 35 kDa were harvested, 100 mug of total protein lysate was loaded on SDS-polyacrylamide gel and probed with SG2NA and beta-actin. ( B ) 35 kDa overexpressing NIH3T3 cells were fractionated and organelle rich fractions loaded on SDS-polyacrlamide gel followed by western analysis using SG2NA antibody. ( C ) Representative FACS histograms of NIH3T3 cells stably transfected with 35 kDa SG2NA. ( D ) Graphical representation of the percentage of cells present in different phases of cell cycle during the cell cycle preogression. Error bars are the standard deviation of 3 independent experiments. ( E ) Schematic representation of proposed process. SG2NA remains in hyperphosphorylated state in the presence of okadoic acid. This hyperphosphorylated SG2NA is more stable. PD98059 inhibits phosphorylation of MAPK kinase and thus ERK. The decrease in phosphorylation of ERK results in decreased activity of ERK thereby decreasing inhibitory phosphorylation of GSK3beta which inturn increases pSG2NA level thus increases its stability. LiCl is known to inhibit GSK3beta activity by increasing its Ser-9 phosphorylation, thereby not phosphorylating SG2NA hence decreased level of SG2NA was observed. Full length blots for panel (A) are shown in Supplementary Figure S1 .