Explore
 Validate
 Learn
Learn Western blot
 ELISA
ELISA Other assay
Antibody data
- Antibody Data
- Antigen structure
- References [14]
- Comments [0]
- Validations
- Other assay [25]
Submit
Validation data
Reference
Comment
Report error
- Product number
- 42-4800 - Provider product page

- Provider
- Invitrogen Antibodies
- Product name
- TBX3 Polyclonal Antibody
- Antibody type
- Polyclonal
- Antigen
- Synthetic peptide
- Description
- 42-4800 has been successfully used in immunohistochemistry analysis of Tbx3 in mouse E16.5 frozen lung sections.
- Reactivity
- Human, Mouse, Rat
- Host
- Rabbit
- Isotype
- IgG
- Vial size
- 100 μg
- Concentration
- 0.25 mg/mL
- Storage
- -20°C
Submitted references Targeting myeloid derived suppressor cells reverts immune suppression and sensitizes BRAF-mutant papillary thyroid cancer to MAPK inhibitors.
Patterning the embryonic pulmonary mesenchyme.
Lateral line placodes of aquatic vertebrates are evolutionarily conserved in mammals.
DNA Methylation Changes in Tbx3 in a Mouse Model Exposed to Polybrominated Diphenyl Ethers.
The T-box transcription factor TBX3 drives proliferation by direct repression of the p21(WAF1) cyclin-dependent kinase inhibitor.
The T-box transcription factor 3 is a promising biomarker and a key regulator of the oncogenic phenotype of a diverse range of sarcoma subtypes.
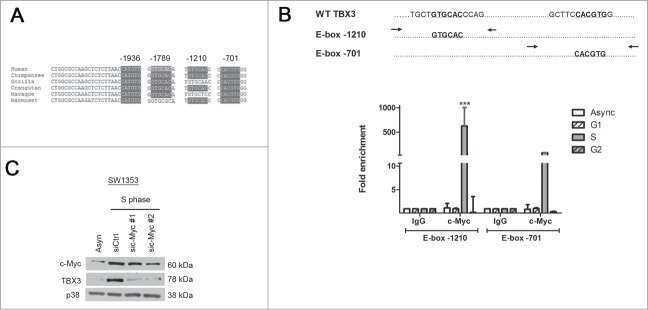
The T-Box factor TBX3 is important in S-phase and is regulated by c-Myc and cyclin A-CDK2.
Transcriptional repressor Tbx3 is required for the hormone-sensing cell lineage in mammary epithelium.
The anti-proliferative function of the TGF-β1 signaling pathway involves the repression of the oncogenic TBX2 by its homologue TBX3.
TBX3 Directs Cell-Fate Decision toward Mesendoderm.
The oncogenic TBX3 is a downstream target and mediator of the TGF-β1 signaling pathway.
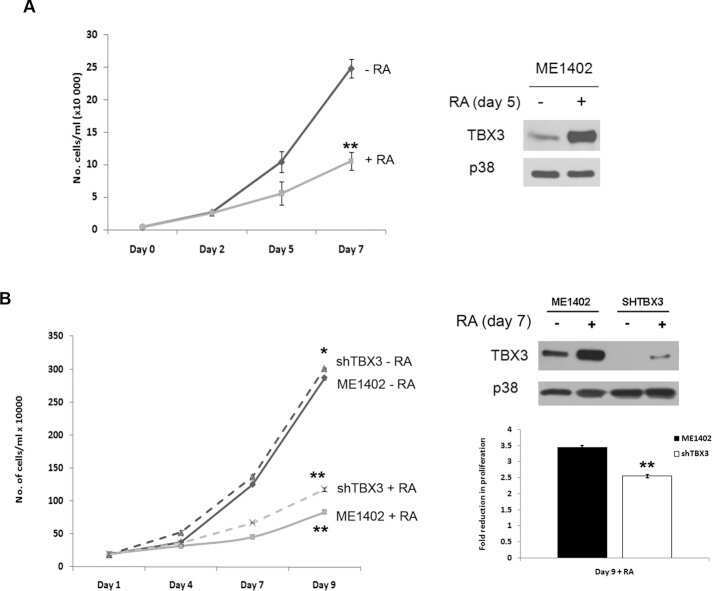
The ulnar-mammary syndrome gene, Tbx3, is a direct target of the retinoic acid signaling pathway, which regulates its expression during mouse limb development.
Basal transcription of the human TBX3 gene, a key developmental regulator which is overexpressed in several cancers, requires functional NF-Y and Sp1 sites.
PMA-induced up-regulation of TBX3 is mediated by AP-1 and contributes to breast cancer cell migration.
Zhang P, Guan H, Yuan S, Cheng H, Zheng J, Zhang Z, Liu Y, Yu Y, Meng Z, Zheng X, Zhao L
Nature communications 2022 Mar 24;13(1):1588
Nature communications 2022 Mar 24;13(1):1588
Patterning the embryonic pulmonary mesenchyme.
Goodwin K, Jaslove JM, Tao H, Zhu M, Hopyan S, Nelson CM
iScience 2022 Mar 18;25(3):103838
iScience 2022 Mar 18;25(3):103838
Lateral line placodes of aquatic vertebrates are evolutionarily conserved in mammals.
Washausen S, Knabe W
Biology open 2018 Jun 19;7(6)
Biology open 2018 Jun 19;7(6)
DNA Methylation Changes in Tbx3 in a Mouse Model Exposed to Polybrominated Diphenyl Ethers.
Shimbo T, Dunnick JK, Brix A, Mav D, Shah R, Roberts JD, Wade PA
International journal of toxicology 2017 May Jun;36(3):229-238
International journal of toxicology 2017 May Jun;36(3):229-238
The T-box transcription factor TBX3 drives proliferation by direct repression of the p21(WAF1) cyclin-dependent kinase inhibitor.
Willmer T, Hare S, Peres J, Prince S
Cell division 2016;11:6
Cell division 2016;11:6
The T-box transcription factor 3 is a promising biomarker and a key regulator of the oncogenic phenotype of a diverse range of sarcoma subtypes.
Willmer T, Cooper A, Sims D, Govender D, Prince S
Oncogenesis 2016 Feb 22;5(2):e199
Oncogenesis 2016 Feb 22;5(2):e199
The T-Box factor TBX3 is important in S-phase and is regulated by c-Myc and cyclin A-CDK2.
Willmer T, Peres J, Mowla S, Abrahams A, Prince S
Cell cycle (Georgetown, Tex.) 2015;14(19):3173-83
Cell cycle (Georgetown, Tex.) 2015;14(19):3173-83
Transcriptional repressor Tbx3 is required for the hormone-sensing cell lineage in mammary epithelium.
Kunasegaran K, Ho V, Chang TH, De Silva D, Bakker ML, Christoffels VM, Pietersen AM
PloS one 2014;9(10):e110191
PloS one 2014;9(10):e110191
The anti-proliferative function of the TGF-β1 signaling pathway involves the repression of the oncogenic TBX2 by its homologue TBX3.
Li J, Ballim D, Rodriguez M, Cui R, Goding CR, Teng H, Prince S
The Journal of biological chemistry 2014 Dec 19;289(51):35633-43
The Journal of biological chemistry 2014 Dec 19;289(51):35633-43
TBX3 Directs Cell-Fate Decision toward Mesendoderm.
Weidgang CE, Russell R, Tata PR, Kühl SJ, Illing A, Müller M, Lin Q, Brunner C, Boeckers TM, Bauer K, Kartikasari AE, Guo Y, Radenz M, Bernemann C, Weiß M, Seufferlein T, Zenke M, Iacovino M, Kyba M, Schöler HR, Kühl M, Liebau S, Kleger A
Stem cell reports 2013;1(3):248-65
Stem cell reports 2013;1(3):248-65
The oncogenic TBX3 is a downstream target and mediator of the TGF-β1 signaling pathway.
Li J, Weinberg MS, Zerbini L, Prince S
Molecular biology of the cell 2013 Nov;24(22):3569-76
Molecular biology of the cell 2013 Nov;24(22):3569-76
The ulnar-mammary syndrome gene, Tbx3, is a direct target of the retinoic acid signaling pathway, which regulates its expression during mouse limb development.
Ballim RD, Mendelsohn C, Papaioannou VE, Prince S
Molecular biology of the cell 2012 Jun;23(12):2362-72
Molecular biology of the cell 2012 Jun;23(12):2362-72
Basal transcription of the human TBX3 gene, a key developmental regulator which is overexpressed in several cancers, requires functional NF-Y and Sp1 sites.
Smith J, Mowla S, Prince S
Gene 2011 Oct 15;486(1-2):41-6
Gene 2011 Oct 15;486(1-2):41-6
PMA-induced up-regulation of TBX3 is mediated by AP-1 and contributes to breast cancer cell migration.
Mowla S, Pinnock R, Leaner VD, Goding CR, Prince S
The Biochemical journal 2011 Jan 1;433(1):145-53
The Biochemical journal 2011 Jan 1;433(1):145-53
No comments: Submit comment
Supportive validation
- Submitted by
- Invitrogen Antibodies (provider)
- Main image

- Experimental details
- NULL
- Submitted by
- Invitrogen Antibodies (provider)
- Main image
- Experimental details
- NULL

- Submitted by
- Invitrogen Antibodies (provider)
- Main image
- Experimental details
- NULL
- Submitted by
- Invitrogen Antibodies (provider)
- Main image
- Experimental details
- NULL
- Submitted by
- Invitrogen Antibodies (provider)
- Main image
- Experimental details
- NULL
- Submitted by
- Invitrogen Antibodies (provider)
- Main image
- Experimental details
- NULL
- Submitted by
- Invitrogen Antibodies (provider)
- Main image
- Experimental details
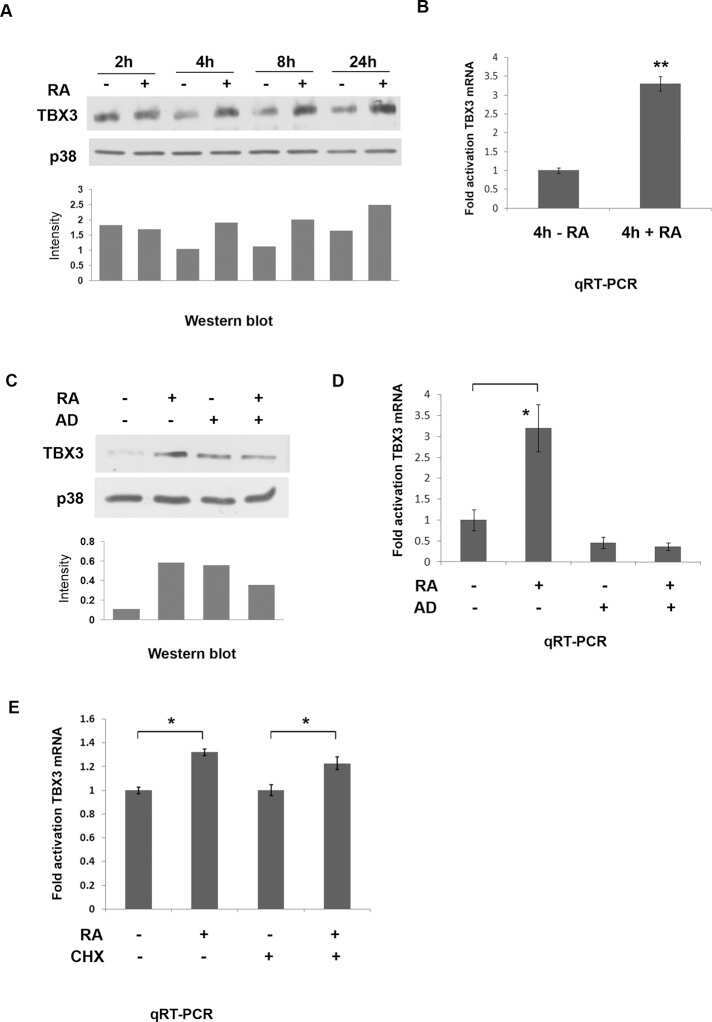
- FIGURE 2: Retinoic acid activation of the TBX3 promoter is mediated by a degenerate RARE half site at -75 base pairs. (A) Schematic representation of human TBX3 deletion constructs. The arrow indicates the transcription start site at +1, and the asterisk indicates the putative RAREs. (B) 501mel cells cotransfected with TBX3 -Luc deletion constructs and vectors expressing human RARalpha and RXRalpha were treated with vehicle (DMSO) or RA (white and black bars, respectively). Luciferase activity was measured 48 h posttransfection. (C) Alignment of the -150-base pair region of human, mouse, and zebrafish Tbx3 promoters. Sequence shown extends from -103 to -53 base pairs in the human TBX3 promoter, with a border outlining each RARE half-site. (D) WT- or MT- TBX3 promoter luciferase constructs shown were transfected into 501mel cells and treated as in B and luciferase activity analyzed. For B and D the fold activation values were calculated by setting promoter activity of untreated cells to 1. Mean values (+-) were calculated from three independent experiments. (E) Biotinylated DNA probes of the TBX3 promoter (-137/+36 base pairs) containing the WT or MT RARE were generated by PCR, immobilized on streptavidin beads, and incubated with nuclear extracts from ME1402 cells treated with 10 muM RA for 4 h. The DNA-bound protein complexes were isolated and analyzed by Western blotting using antibodies to RARalpha, RARbeta, RARgamma, and RXRalpha. (F) ME1402 cells were treated with 10 muM

- Submitted by
- Invitrogen Antibodies (provider)
- Main image
- Experimental details
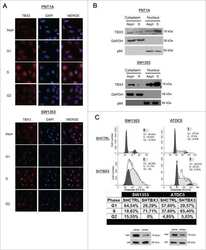
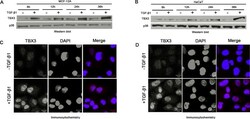
- FIGURE 2: TGF-beta1 activates TBX3 protein expression. TBX3 protein from MCF-12A cells (A) or HaCaT cells (B) was prepared after indicated times and examined by Western blot analysis. p38 was used as a loading control. MCF-12A cells (C) or HaCaT cells (D) were treated with TGF-beta1 (5 ng/ml) for 12 h, and TBX3 subcellular localization was determined by immunocytochemistry using antibody specific to TBX3. In the merged image the red and blue represent TBX3 and 4',6-diamidino-2-phenylindole, respectively.

- Submitted by
- Invitrogen Antibodies (provider)
- Main image

- Experimental details
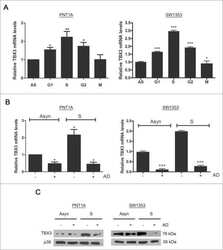
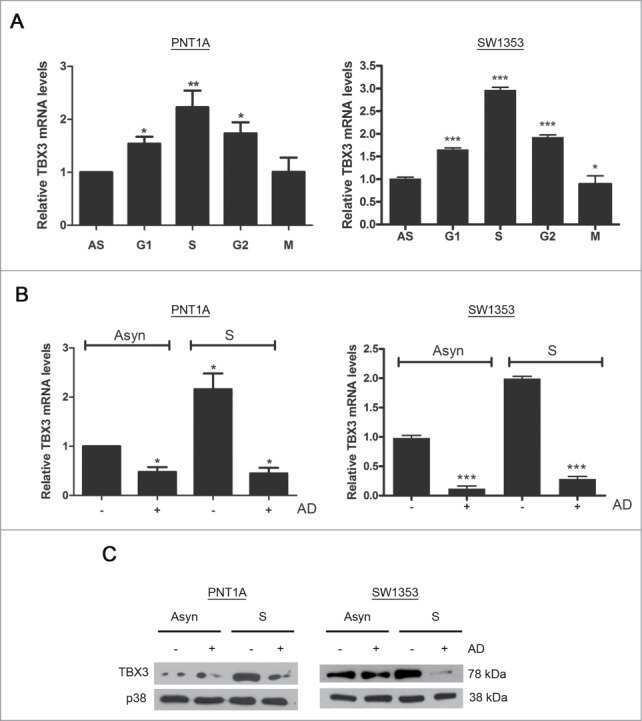
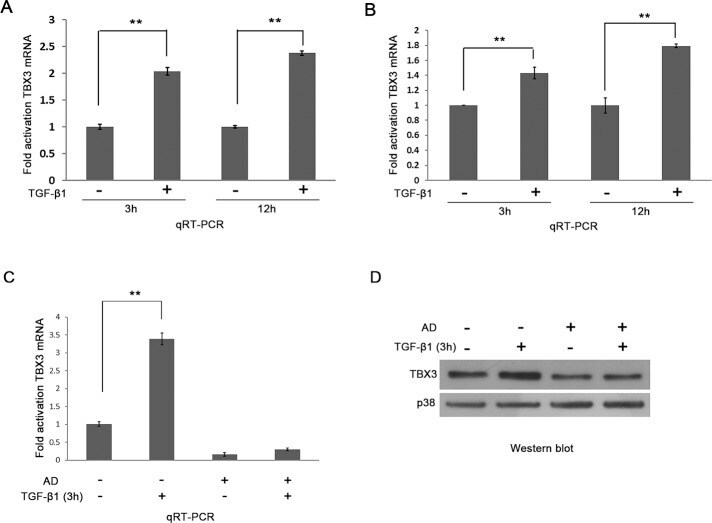
- FIGURE 3: TBX3 is transcriptionally regulated by TGF-beta1. Total RNA extracted from MCF-12A cells (A) or HaCaT cells (B) after 3 or 12 h TGF-beta1 treatment was reverse transcribed and subjected to qRT-PCR using primers specific to TBX3. mRNA levels were normalized to GUSB. (C) MCF-12A cells were pretreated with vehicle (control) or 5 mug/ml actinomycin D (AD) for 1 h and treated with TGF-beta1 for 3 h. (D) RNA and protein were harvested for use in qRT-PCR and Western blotting analysis. Bars, SD. ** p < 0.001.
- Submitted by
- Invitrogen Antibodies (provider)
- Main image
- Experimental details
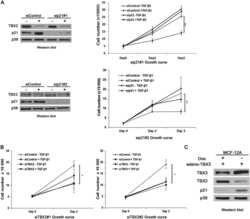
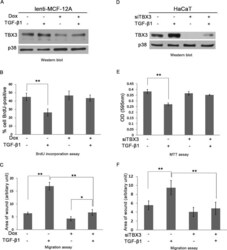
- FIGURE 6: TBX3 mediates TGF-beta1-regulated cell proliferation and migration. Western blot analyses show lentiviral shRNA-mediated knockdown of TBX3 in MCF-12A cells (A) or siTBX3-mediated knockdown in HaCaT cells (D) in the presence or absence of 3 h TGF-beta1 treatment. (B) MCF-12A cell lines were incubated with BrdU for 3 h, and BrdU-positive nuclei were visualized by fluorescence microscopy to measure cell proliferation. (E) Net cell growth of HaCaT cells as assessed using the MTT assay. MCF-12A (C) and HaCaT cells (F) were subjected to cell scratch migration assay. Bars, SD. * p < 0.05, ** P < 0.001.

- Submitted by
- Invitrogen Antibodies (provider)
- Main image
- Experimental details
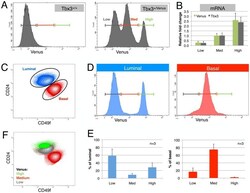
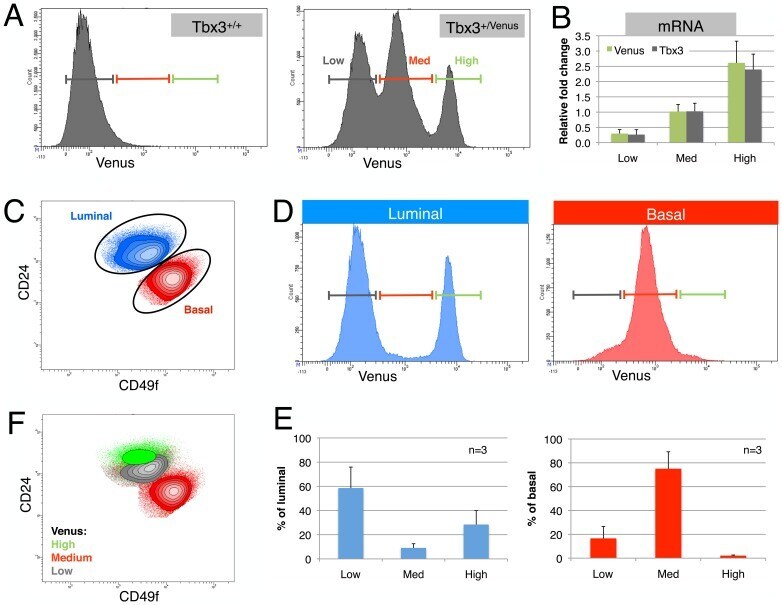
- Figure 1 Fluorescent reporter reveals distinct Tbx3 expression in mammary epithelial cell subsets. (A) Epithelial cells isolated from mammary glands of wildtype (Tbx3 +/+ ) or knock-in (Tbx3 +/Venus ) mice show three peaks with different levels of Venus expression (Low, Medium and High). (B) Mammary epithelial cells (MECs) from 3 independent Tbx3 +/Venus animals were sorted according to Venus signal intensity. qPCR on 500 directly lysed cells shows that both Venus and Tbx3 mRNA correlates tightly with Venus fluorescence intensity. (C) MECs were labeled with fluorescent antibodies against CD24 and alpha6-integrin (CD49f) to distinguish the luminal (blue) and basal (red) cell populations. (D) When plotted separately, luminal cells from Tbx3 +/Venus mammary glands show two main populations; Venus Low (cells with low Tbx3 expression) and Venus High (cells with high Tbx3 expression). Basal cells express intermediate level of Venus (and Tbx3). (E) Quantification of the percentage of Venus-Low, -Medium and -High cells in the luminal and in the basal population of Tbx3 +/Venus epithelium. Data are presented as mean +- SD of three individual adult virgin Tbx3 +/Venus animals. (F) Populations gated based on Tbx3 expression (Venus-Low, -Medium and -High) plotted on a CD24/CD49f contour plot.
- Submitted by
- Invitrogen Antibodies (provider)
- Main image
- Experimental details
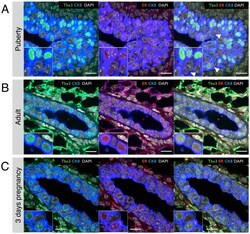
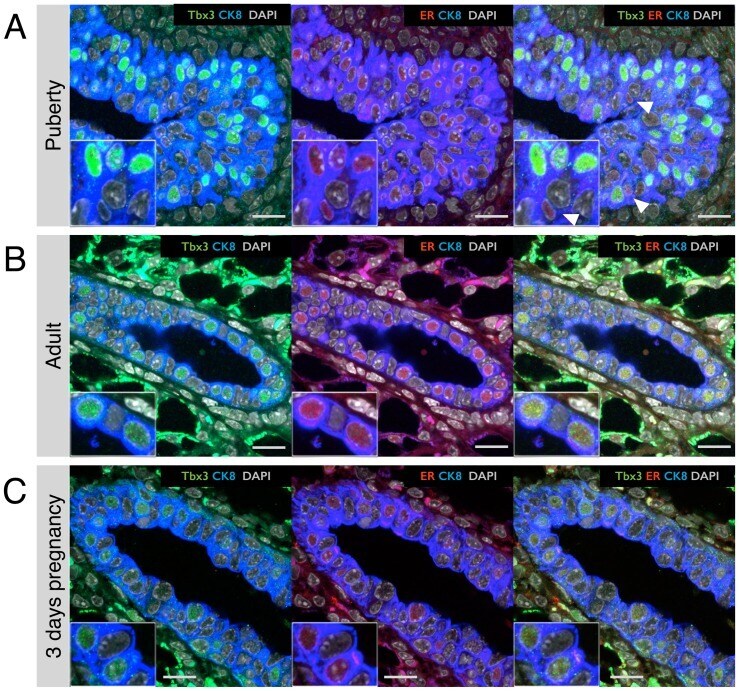
- Figure 5 Correlation between Tbx3 and ER expression at different developmental stages of postnatal mammary gland development. Confocal immunofluorescence staining of Tbx3 (green), ER (red) and luminal marker cytokeratin-8 (CK8, blue) on mammary glands from (A) 5-week old pubertal mice (terminal end bud structure), (B) 10-week old virgin mice (ductal structure) and (C) 3 day pregnant mice (ductal structure). Nuclei are stained with DAPI (grey). White arrow heads indicate cells in terminal end bud (A) with ER expression but no Tbx3 expression. Images are representative of staining performed on paraffin sections of 3 independent animals. Scale bar is 20 um.
- Submitted by
- Invitrogen Antibodies (provider)
- Main image
- Experimental details
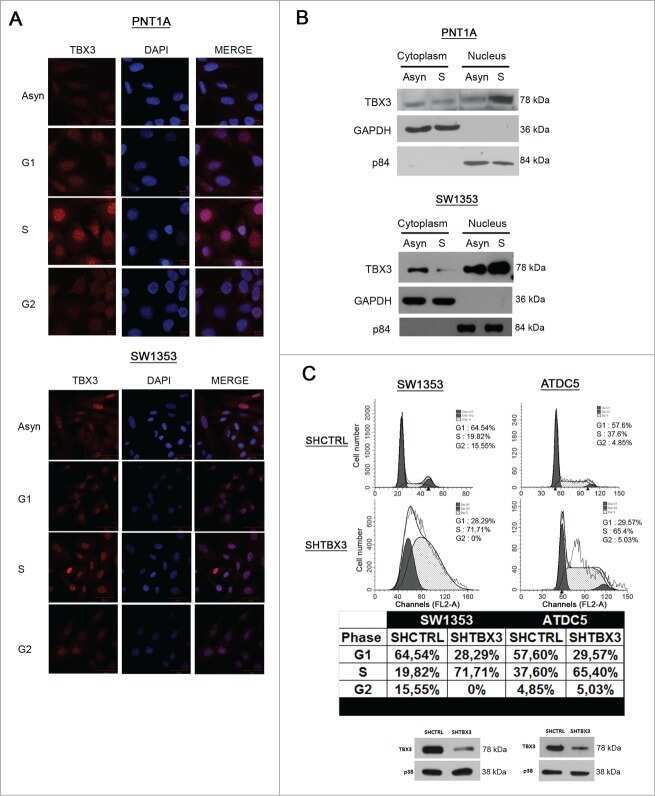
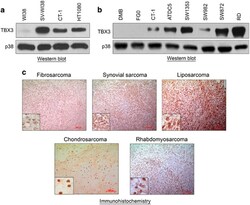
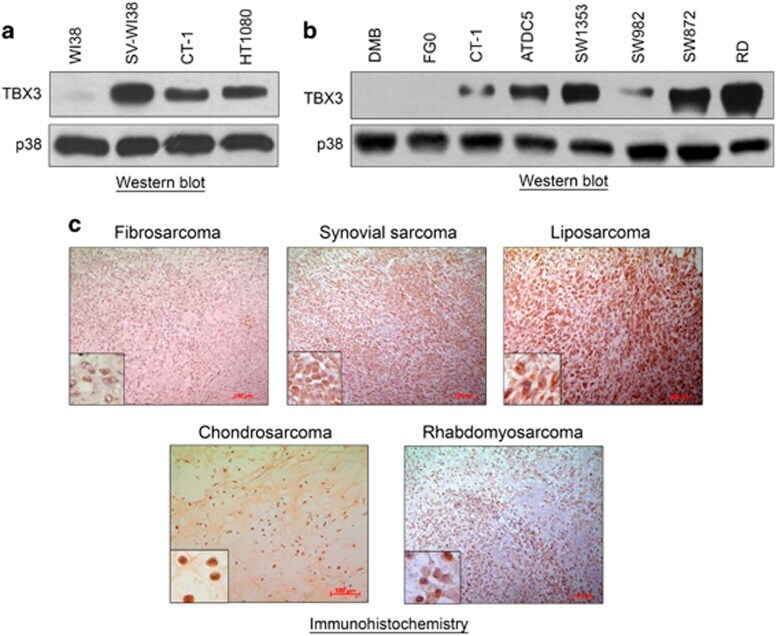
- Figure 1 TBX3 is overexpressed in soft tissue and bone sarcomas. Protein from ( a ) the WI38 normal human fibroblast, transformed SV-WI38 and CT-1 fibroblast, and HT1080 fibrosarcoma cell lines and ( b ) the DMB and FGO normal human fibroblast, CT-1 transformed fibroblast, ATDC5 and SW1353 chondrosarcoma, SW982 synovial sarcoma, SW872 liposarcoma and RD rhabdomyosarcoma cell lines were screened for TBX3 expression using western blotting with an antibody specific to TBX3. p38 was used as a loading control. ( c ) Archival patient-derived fibrosarcoma ( N =4), synovial sarcoma ( N =2), liposarcoma ( N =3), chondrosarcoma ( N =1) and rhabdomyosarcoma ( N =3) tissue sections were immunohistochemically stained using an antibody specific to TBX3. Representative images are shown (scale bars, 100 mum; insets are magnified images from selected areas).
- Submitted by
- Invitrogen Antibodies (provider)
- Main image
- Experimental details
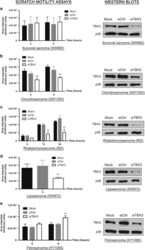
- Figure 2 TBX3 impacts on sarcoma cell migration. Left panels: ( a ) SW982 synovial sarcoma, ( b ) SW1353 chondrosarcoma, ( c ) RD rhabdomyosarcoma, ( d ) SW872 liposarcoma and ( e ) HT1080 fibrosarcoma cell lines were transfected with transfection reagent only (mock), control siRNA or siTBX3 and 48 h later scratch motility assays were performed. Data are the mean+-s.d. of three independent experiments, ** P

- Submitted by
- Invitrogen Antibodies (provider)
- Main image
- Experimental details
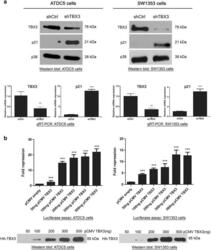
- Fig. 1 TBX3 represses p21 promoter activity. a Total protein and RNA were extracted from ATDC5 and SW1353 control and TBX3 knock down cells. Upper panels lysates were subjected to western blot analysis with antibodies specific to TBX3 and p21. p38 was used as a loading control. Lower panels quantitative real-time PCR was performed on reverse transcribed RNA using primers specific to TBX3 and p21 and mRNA levels were normalised against GUSB levels. b ATDC5 and SW1353 cells were co-transfected with the p21 promoter luciferase reporter construct and varying amounts of the TBX3 expression construct pCMV-TBX3. Total amount of plasmid DNA transfected was held constant using the corresponding empty vector, pCMV. The plasmid pRL-TK containing the Renilla luciferase reporter gene was also introduced to normalize transfection efficiency. Thirty hours following transfection cells were lysed and relative luciferase activity measured. Data were normalised against renilla values and fold repression was obtained by comparing the results to that of the empty pCMV vector transfection. Lower panels western blotting shows expression of HA-tagged TBX3 protein using a HA antibody. a , b The values in the graphs indicate the mean of three independent experiments +- SEM (*p < 0.05; **p < 0.01; ***p < 0.001)

- Submitted by
- Invitrogen Antibodies (provider)
- Main image
- Experimental details
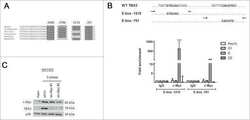
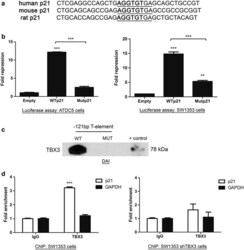
- Fig. 3 The T-element at -121 bp of the p21 promoter mediates repression by TBX3 and TBX3 binds this region in vitro and in vivo. a Alignment showing conservation of the T-element residue at -121 bp (T-121 bp) of the p21 promoter across a number of different species. b ATDC5 and SW1353 cells were co-transfected with pGL3 basic empty, WTp21 or Mutp21 luciferase reporter constructs together with pCMV empty or WT TBX3. The plasmid pRL-TK containing the Renilla luciferase reporter gene was also introduced to normalize transfection efficiency. Fold repression was obtained by comparing the results to that of the empty pCMV vector transfection. The values indicate the mean of three independent experiments +- SEM (*p < 0.05; **p < 0.01, ***p < 0.001). c DNA-affinity immunoblot assay. Lysates from SW1353 cells were incubated with a biotinylated probe matching the sequence of the wild-type or mutated T-element at position -121 bp of the p21 promoter. A pull-down was performed using streptavidin magnetic beads and the lysates run on an 8 % SDS-PAGE gel and analysed by western blotting using an antibody to TBX3. d SW1353 control and shTBX3 lysates were used in a ChIP assay performed with antibodies against TBX3 or IgG (negative control). Immunoprecipitated DNA was assayed by qRT-PCR with primers against the p21 promoter or GAPDH (negative control). The values indicate the mean of two independent experiments each performed in triplicate +- SEM (***p < 0.001)

- Submitted by
- Invitrogen Antibodies (provider)
- Main image
- Experimental details
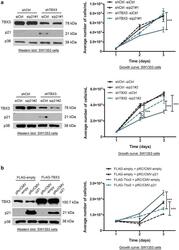
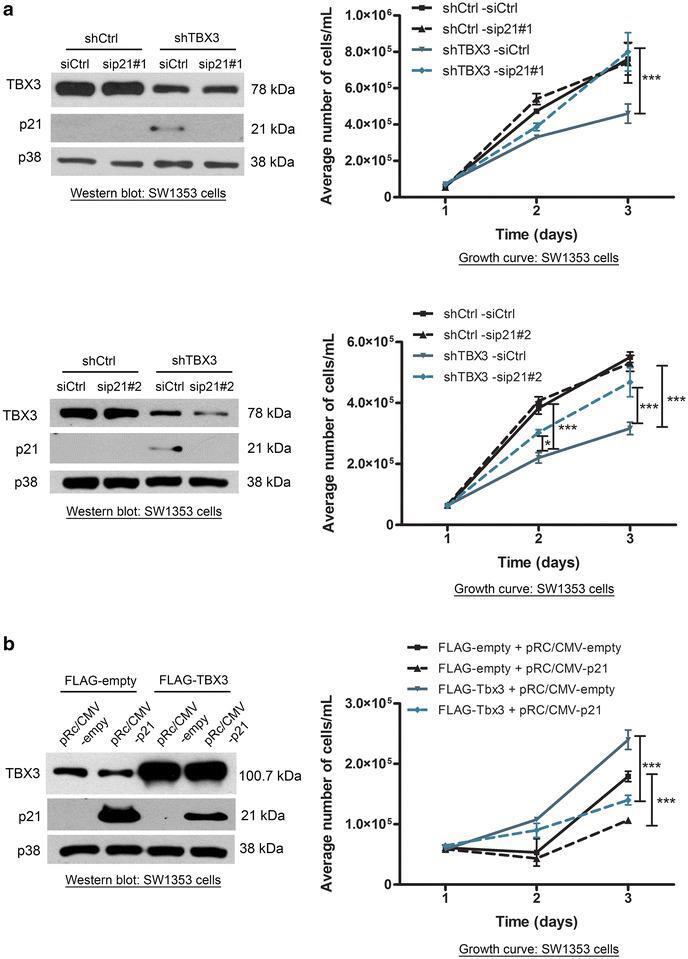
- Fig. 6 The repression of p21 is required for TBX3 induced cell proliferation. a SW1353 cells were transiently transfected with either 25 nM sip21 or siControl for 12 h. Growth curve assays were performed over a 3 day period ( upper panel sip21#1, lower panel sip21#2.). b SW1353 cells were transiently transfected with either pRc/CMV-Empty (control) or pRc/CMV-p21 (p21). Growth curve assays were performed over a 3 day period ( right panels ). ( a , b ) Two way ANOVA test was performed to calculate statistical significance (***p < 0.001). Left panels western blotting to confirm the expression of the indicated proteins using antibodies to TBX3, p21 and p38 (loading control)
- Submitted by
- Invitrogen Antibodies (provider)
- Main image
- Experimental details
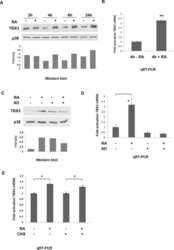
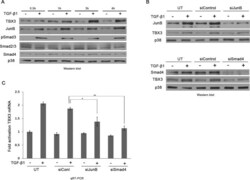
- FIGURE 4: JunB and Smad proteins mediate the regulation of TBX3 by TGF-beta1. (A) MCF-12A cells were serum starved and treated with TGF-beta1 at indicated time points and analyzed by Western blotting. (B) MCF-12A cells were either untransfected (UT) or transfected with 30 nM siJunB (top) or 50 nM siSmad4 (bottom) or the equivalent concentration of control siRNA for 24 h, followed by 3 h of TGF-beta1 treatment and subjected to Western blotting. (C) RNA from B was subjected to qRT-PCR analysis. Bars, SD. * p < 0.05, ** p < 0.001.

- Submitted by
- Invitrogen Antibodies (provider)
- Main image

- Experimental details
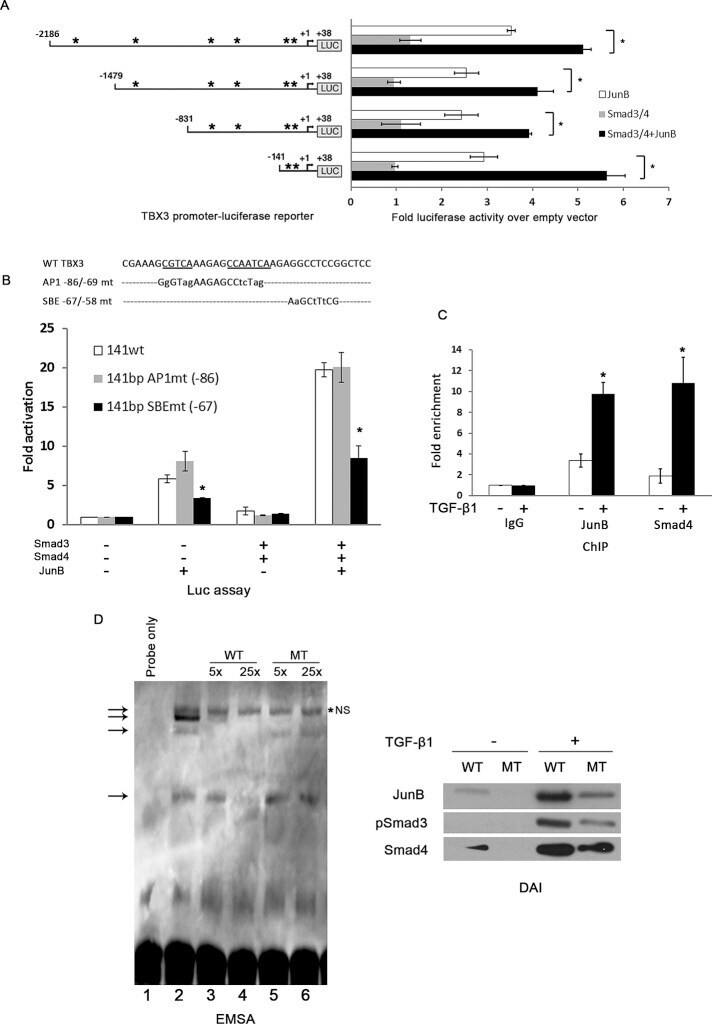
- FIGURE 5: TGF-beta1 activation of the TBX3 promoter is mediated by a degenerate SBE at -67 base pairs. (A) Schematic illustration of luciferase reporter constructs containing sequential 5'- deletions of the human TBX3 promoter (400 ng), which were transiently cotransfected into the MCF-12A cells with vectors expressing human JunB and Smad3/4. The arrow indicates the transcription start site at +1, and the asterisk indicates putative AP-1-binding sites. Mean values (+- SD) are presented as fold activity over that of an empty firefly luciferase reporter and are representative of at least three independent experiments. (B) MCF-12A cells were cotransfected with WT TBX3 -141 base pair promoter luciferase reporter or a reporter in which the indicated AP-1 (AP1mt) or Smad-binding-element (SBEmt) was mutated and JunB or Smad3/4 expression constructs and luciferase activity analyzed. (C) MCF-12A cells were treated with 5 ng/ml TGF-beta1 for 3 h and chromatin immunoprecipitation assays performed with antibodies against JunB, Smad4, or IgG (negative control). Immunoprecipitated DNA was assayed by qRT-PCR with primers against the TBX3 promoter. (D) For EMSA, biotin-labeled, double-stranded oligonucleotide probes containing the homologous WT SBE -67/-58 site were incubated with nuclear extracts from MCF-12A cells (lanes 2-6). Observed complexes are indicated by arrows on the left. Unspecific complexes are indicated by *NS on the right. Competition analyses were carried out in the pre
- Submitted by
- Invitrogen Antibodies (provider)
- Main image
- Experimental details
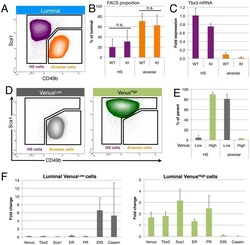
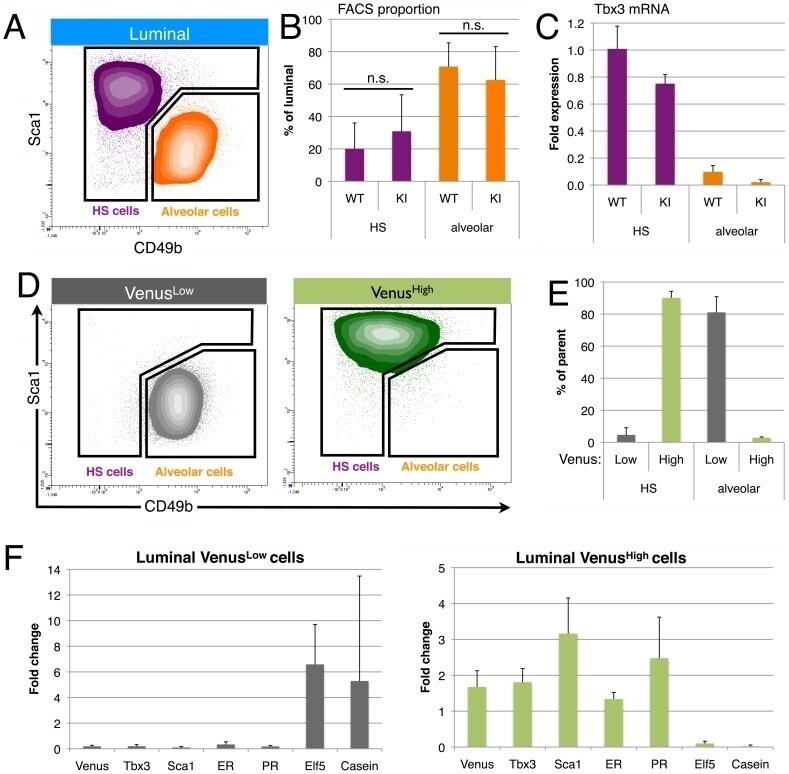
- Figure 2 Tbx3 marks hormone sensing cells. (A) Luminal cells from wildtype mammary glands are separated into hormone-sensing (HS, Sca1 hi CD49b lo , purple) and alveolar (Sca1 l degCD49b hi , orange) subsets based on Sca1 and alpha2-integrin (CD49b) expression. (B) There is no significant (n.s.) difference in the proportion of hormone-sensing (HS, purple) and alveolar cells (orange) between Tbx3 +/+ (wildtype, WT) and Tbx3 +/Venus (Knock-in, KI), paired t-test p = 0.53 for HS and p = 0.60 for Alv. (C) Tbx3 mRNA levels in sorted populations as indicated. (D) Tbx3 +/Venus luminal cells were first gated for Low or High Venus expression (see Figure 1D ), and then plotted based on Sca1 and CD49b expression. (E) Proportion of hormone-sensing (HS, purple) and alveolar cells (orange) that are Venus Low (grey) or Venus High (green), measured by FACS in 3 independent Tbx3 +/Venus animals. (F) Fold change in mRNA expression in luminal Venus Low (left panel) or Venus High (right panel) cells, relative to total luminal population. Data are presented as mean +- SD of three adult virgin Tbx3 +/Venus animals.
- Submitted by
- Invitrogen Antibodies (provider)
- Main image

- Experimental details
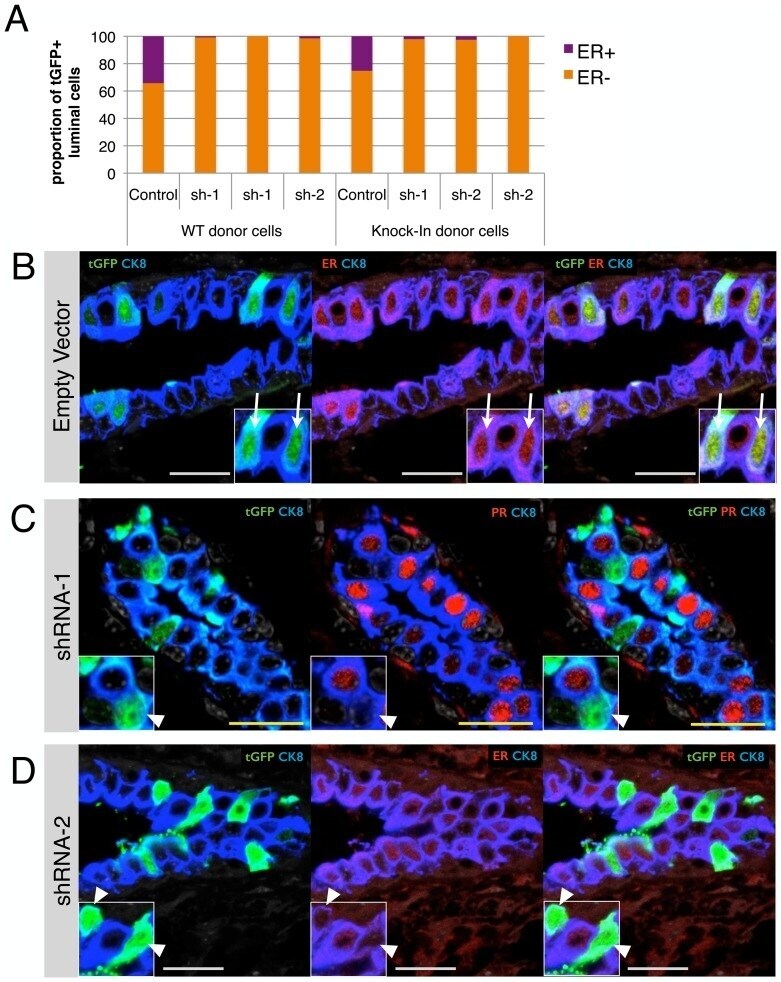
- Figure 6 Tbx3 is required for the generation of hormone-sensing cells. (A) Primary MECs from wildtype or KI mice were transduced with a non-silencing lentiviral vector (control) or with two independent short hairpins against Tbx3 (sh-1 and sh-2). Cells were injected into mammary fat pads devoid of endogenous epithelium and outgrowths were analyzed 8-10 weeks later for the identity of lentivirally transduced cells (recognized by tGFP expression). See File S4B for a schematic experimental design. Each bar represents one fat pad and 46 to 569 tGFP+ luminal cells were counted per fat pad. There is a significant bias against the formation of HS cells by cells with Tbx3 knockdown (Chi square of shRNA versus control transplant
- Submitted by
- Invitrogen Antibodies (provider)
- Main image
- Experimental details
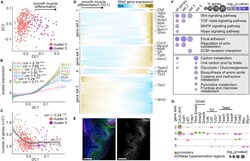
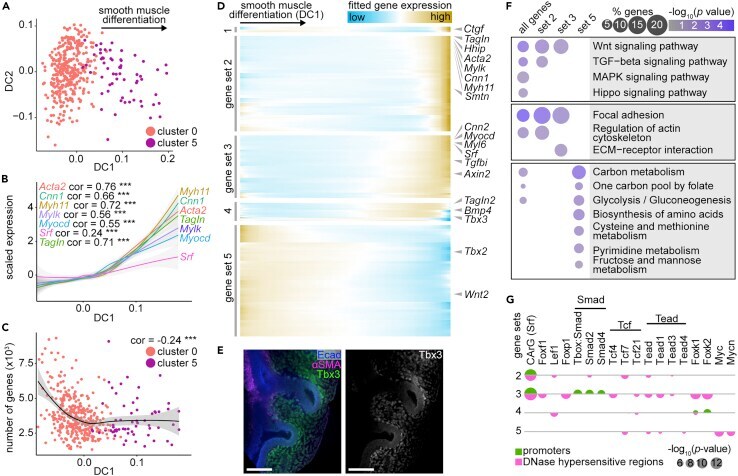
- Diffusion analysis reveals differentiation trajectory of mesenchymal cells into airway smooth muscle (A) Diffusion plots of sub-epithelial mesenchymal and smooth muscle cells. (B) Scaled expression of known smooth muscle markers versus cell loadings along DC1. Pearson correlation coefficients and significance are indicated on plots and lines represent smoothed data with SE shaded in gray. *** indicates p< 0.0001. (C) Number of genes detected per cell versus DC1. Pearson correlation coefficients and significance are indicated on plots and lines represent smoothed data with SE shaded in gray. *** indicates p< 0.0001. (D) Heatmap showing five gene sets identified using hierarchical agglomerative clustering of spline-fitted gene-expression profiles along DC1. Genes of interest are indicated to the right. (E) E 11.5 lungs immunostained for Tbx3 (gene set 4), Ecad, and alphaSMA. Scale bars show 50 mum. (F) Bubble plot showing the enrichment percentage and adjusted p value of relevant KEGG pathways for the gene sets defined in (E) (G) Bubble plot showing the p values of motifs for transcription factor-binding sites in the promoters of and DNase-hypersensitive regions near genes of sets 2-5.
- Submitted by
- Invitrogen Antibodies (provider)
- Main image
- Experimental details
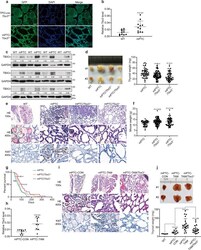
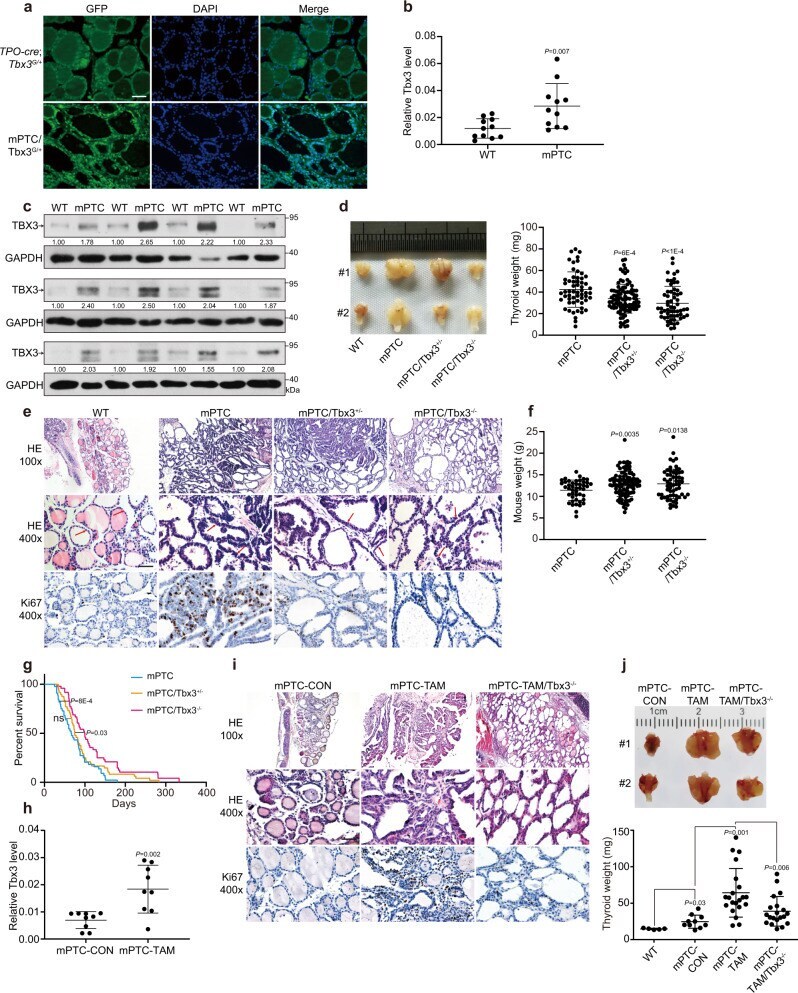
- Tbx3 is necessary for Braf V600E -induced PTC formation. a Representative images of TBX3-GFP positive cancer cells analyzed by GFP IF staining in mPTC/Tbx3 G/+ compared with TPO-cre ; Tbx3 G/+ littermates at 5w. Scale bars, 50mum. b The expression of Tbx3 was measured by RT-qPCR in thyroid glands from wild-type (WT) and mPTC littermates at 5w, GAPDH was used as the loading control, n = 11 pairs of littermates. c The expression of TBX3 was measured by western blot with densitometric analyses in thyroid glands from WT and mPTC littermates at 5w, n = 12 pairs of littermates. d The image representing whole thyroid tissues from 2 pairs of WT, mPTC, mPTC/Tbx3 +/- and mPTC/Tbx3 -/- mice at 5w, and related thyroid weight was plotted, n = 58 mPTC, n = 95 mPTC/Tbx3 +/- , n = 59 mPTC/Tbx3 -/- . e Representative H&E and Ki67 IHC staining on thyroid tissues from WT, mPTC, and mPTC/Tbx3 -/- littermates, red arrows points to papillary formations. Scale bars, 50mum. f Mouse weight of mPTC, mPTC/Tbx3 +/- , and mPTC/Tbx3 -/- mice at 5w, n = 45 mPTC, n = 97 mPTC/Tbx3 +/- , n = 60 mPTC/Tbx3 -/- . g Survival of mice bearing mPTC, mPTC-Tbx3 +/- or mPTC-Tbx3 -/- , n = 44 mPTC, n = 48 mPTC/Tbx3 +/- , n = 48 mPTC/Tbx3 -/- . h RT-qPCR analysis of Tbx3 in thyroid tissues from TPO-creER; Braf V600E CA with intraperitoneal tamoxifen injection at 1 m (mPTC-TAM) or oil treatment as control (mPTC-CON), each pair of tissue was obtained at same time, n = 9. i Representative H&E and Ki67 IHC staining on thyroi
- Submitted by
- Invitrogen Antibodies (provider)
- Main image
- Experimental details
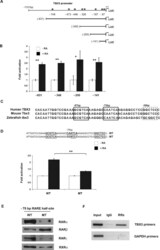
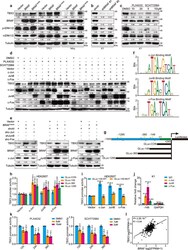
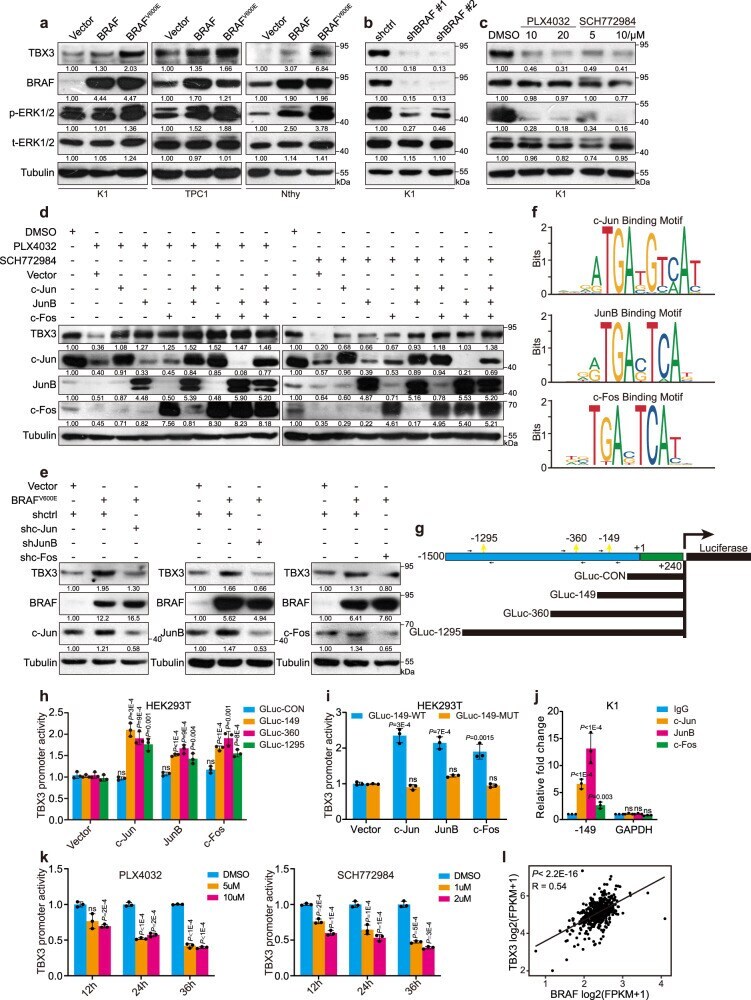
- Fig. 2 BRAF/MAPK/AP-1 axis promotes TBX3 transcription in PTC. a, b Western blot of TBX3 in PTC or normal thyroid cells (Nthy-ori-3-1) with BRAF or BRAF V600E over-expression ( a ) or K1 cells with BRAF knock-down ( b ). c K1 cells were treated with BRAF inhibitor PLX4032 or ERK1/2 inhibitor SCH772984 for 24 h, the level of TBX3 was analysis by western blot. d TBX3 and AP-1 factors levels in K1 cells over-expressing c-Jun, JunB, or c-Fos, and treated with PLX4032 or SCH772984. e TBX3 and AP-1 factors levels in K1 cells with BRAF V600E over-expression and AP-1 knock-down. f AP-1 binding motifs were analyzed through TBX3 promoter region using Jasper database. g Construction of TBX3 promoter GLuc with potential AP-1-binding sites. The predicted -358bp and -362bp site were overlapped as -360bp site. Arrows represented primers were used for qPCR. h, i Promoter GLuc activities were analyzed in HEK293T cells co-transfected with TBX3 truncated promoter ( h ) or TBX3-149-MUT promoter ( i ) and AP-1 expression constructs. j Quantitative ChIP (qChIP) analysis with anti-IgG, c-Jun, JunB and c-Fos for -149 site in K1 cells, primers targeting GAPDH gene were used as control. k Luciferase activities of GLuc-149 were analyzed in K1 cells treated with PLX4032 or SCH772984 for 12 h, 24 h or 36 h. l THCA datasets were downloaded from TCGA database to analyze the correlation between TBX3 and BRAF, n = 501. Densitometric analyses of western blot were shown ( a - e ). Two independent experiments w
- Submitted by
- Invitrogen Antibodies (provider)
- Main image

- Experimental details
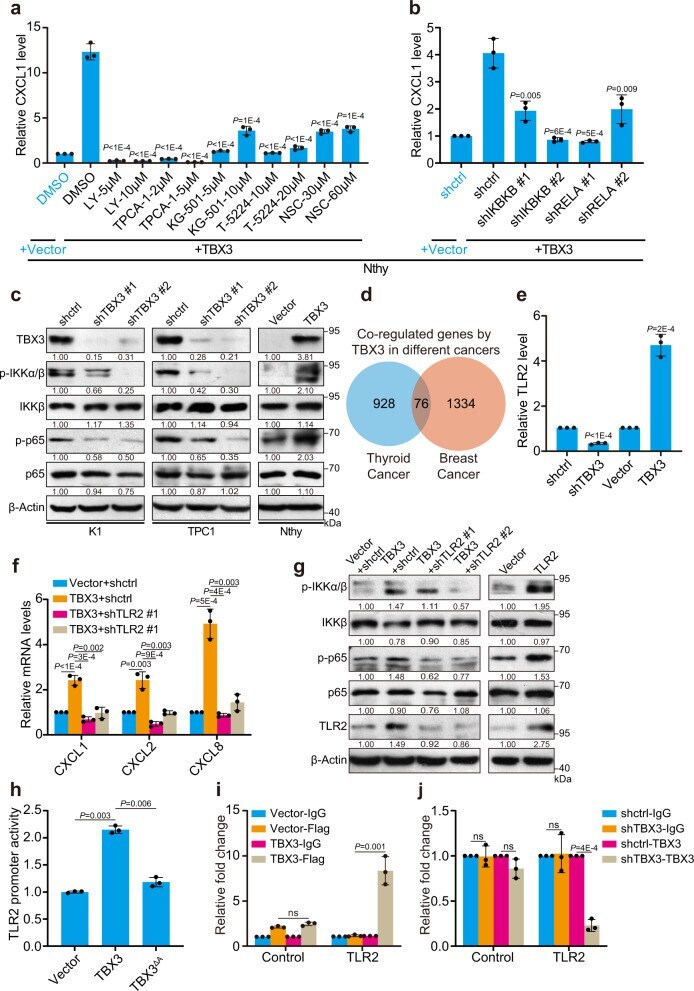
- Fig. 4 TBX3/TLR2-NF-kappaBeta axis induces chemokines expression. a CXCL1 mRNA level in TBX3 over-expressed Nthy cells treated with small-molecule inhibitors against IKKbeta (LY2409881 (LY), TPCA-1), CREB (KG-501), AP-1 (T-5224) or STAT3 (NSC74859 (NSC)) was measured by RT-qPCR, comparison between DMSO- and inhibitor-treated TBX3-over-expressed Nthy cells was used for statistical analyses. b RT-qPCR analysis of CXCL1 in TBX3 over-expressed Nthy cells infected with shRNAs against IKBKB or RELA, comparison between shctrl- and shRNA- TBX3-over-expressed Nthy cells was used for statistical analyses. c Western blot of NF-kappaB pathway members in K1, TPC1 with TBX3 knock-down, and Nthy cells with TBX3 over-expression. d Venn diagram analysis across two groups of genes. Down-regulated, shTBX3 versus control in K1 cells ( n = 1004); Up-regulated, TBX3 over-expression versus control in 21NT breast cancer cells ( n = 1410). e RT-qPCR analysis of TLR2 in K1 cells with TBX3 knock-down or over-expression. f RT-qPCR analysis of CXCL1, 2 and CXCL8 in TBX3 over-expressed K1 infected with shRNAs against TLR2. g Western blot of NF-kappaB pathway members in K1 cells as in ( f ). h HEK293T cells were co-transfected with TLR2-GLuc, TBX3 and TBX3 with activator domain deletion (TBX3 DeltaA ) assayed for GLuc activity using SEAP activity as control. i qChIP analysis using anti-IgG and anti-FLAG antibody was performed in K1 cells with Flag-TBX3 over-expression. j qChIP analysis using anti-IgG and a