Explore
 Validate
 Learn
Learn Western blot
 Immunocytochemistry
 Immunohistochemistry
Antibody data
- Antibody Data
- Antigen structure
- References [1]
- Comments [0]
- Validations
- Immunocytochemistry [1]
- Other assay [1]
Submit
Validation data
Reference
Comment
Report error
- Product number
- PA5-101065 - Provider product page

- Provider
- Invitrogen Antibodies
- Product name
- DLX3 Polyclonal Antibody
- Antibody type
- Polyclonal
- Antigen
- Synthetic peptide
- Description
- Antibody detects endogenous levels of total DLX3.
- Reactivity
- Human, Mouse
- Host
- Rabbit
- Isotype
- IgG
- Vial size
- 100 μL
- Concentration
- 1 mg/mL
- Storage
- -20°C
Submitted references Identification of the Key Genes Associated with the Yak Hair Follicle Cycle.
Zhang X, Bao P, Ye N, Zhou X, Zhang Y, Liang C, Guo X, Chu M, Pei J, Yan P
Genes 2021 Dec 23;13(1)
Genes 2021 Dec 23;13(1)
No comments: Submit comment
Supportive validation
- Submitted by
- Invitrogen Antibodies (provider)
- Main image
- Experimental details
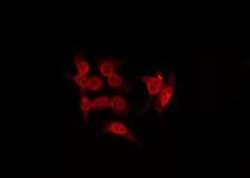
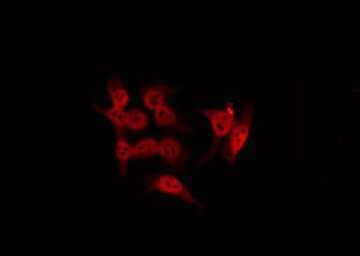
- Immunofluorescent analysis of DLX3 in 293 cells. Samples were fixed with paraformaldehyde, permeabilized with 0.1% Triton X-100, blocked with 10% serum (45 min at 25°C) incubated with DLX3 polyclonal antibody (Product # PA5-101065) using a dilution of 1:200 (1 hr, 37°C), and followed by goat anti-rabbit IgG Alexa Fluor 594 at a dilution of 1:600.
Supportive validation
- Submitted by
- Invitrogen Antibodies (provider)
- Main image

- Experimental details
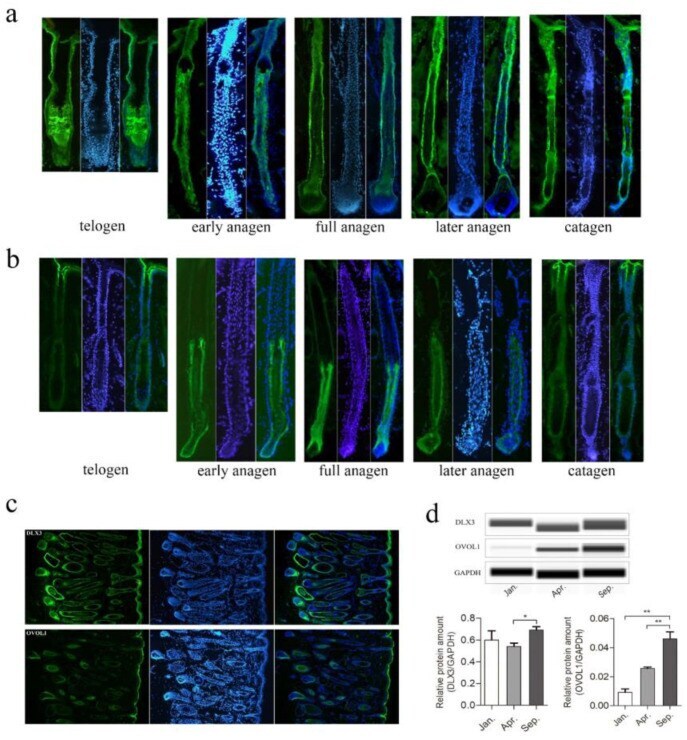
- Figure 5 Detection of spatiotemporal expression of DLX3 and OVOL1 during yak HFs cycle by immunofluorescence. ( a , b ) The expressions of DLX3 ( a ) and OVOL1 ( b ) were detected using anti-Dlx3 and anti-Ovol1 antibody (green), respectively, in hair follicle at telogen, early anagen, full anagen, later anagen, and catagen. Staining in each period was represented by a single hair follicle--blue indicates DAPI staining. ( c ) Panoramic display of a microscope field in 10x of DLX3 (upper) and OVOL1 (lower) immunofluorescence staining. ( d ) Western blot analyses for DLX3 and OVOL1 protein levels in Jan. (catagen), Apr. (telogen), and Sep. (anagen), during yak HFs cycle, and the quantitative analysis of gray value were shown in histograms. Data are presented as mean +- SEM for 3 biological replicates; * p < 0.05; ** p < 0.01.