 Explore
 Validate
 Learn
Learn Western blot
Antibody data
- Antibody Data
- Antigen structure
- References [2]
- Comments [0]
- Validations
- Western blot [1]
- Immunocytochemistry [1]
- Immunohistochemistry [1]
- Flow cytometry [2]
- Other assay [7]
Submit
Validation data
Reference
Comment
Report error
- Product number
- PA5-19382 - Provider product page

- Provider
- Invitrogen Antibodies
- Product name
- IGF1 Polyclonal Antibody
- Antibody type
- Polyclonal
- Antigen
- Synthetic peptide
- Description
- This antibody is predicted to react with bovine, canine, mouse, porcine, rabbit and rat based on sequence homology. This antibody is tested in Peptide ELISA: antibody detection limit dilution 32,000.
- Reactivity
- Human
- Host
- Goat
- Isotype
- IgG
- Vial size
- 100 μg
- Concentration
- 0.5 mg/mL
- Storage
- -20°C, Avoid Freeze/Thaw Cycles
Submitted references Diane-35 and Metformin Induce Autophagy and Apoptosis in Polycystic Ovary Syndrome Women with Early-Stage Endometrial Carcinoma.
The intrinsically disordered E-domains regulate the IGF-1 prohormones stability, subcellular localisation and secretion.
Liu Y, Wang Y, Yao D, Chen X, Zhang F, Feng Y, Li X
Genes 2022 Jan 12;13(1)
Genes 2022 Jan 12;13(1)
The intrinsically disordered E-domains regulate the IGF-1 prohormones stability, subcellular localisation and secretion.
Annibalini G, Contarelli S, De Santi M, Saltarelli R, Di Patria L, Guescini M, Villarini A, Brandi G, Stocchi V, Barbieri E
Scientific reports 2018 Jun 11;8(1):8919
Scientific reports 2018 Jun 11;8(1):8919
No comments: Submit comment
Supportive validation
- Submitted by
- Invitrogen Antibodies (provider)
- Main image

- Experimental details
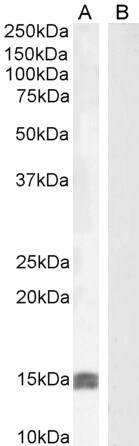
- Western blot analysis of IGF1 using IGF1 Polyclonal Antibody (Product # PA5-19382) (0.5 µg/mL) in staining of Human Uterus (A) and negative control HepG2 (B) lysate (35 µg protein in RIPA buffer). Detected by chemiluminescence.
Supportive validation
- Submitted by
- Invitrogen Antibodies (provider)
- Main image
- Experimental details
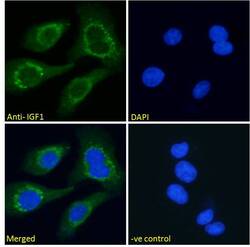
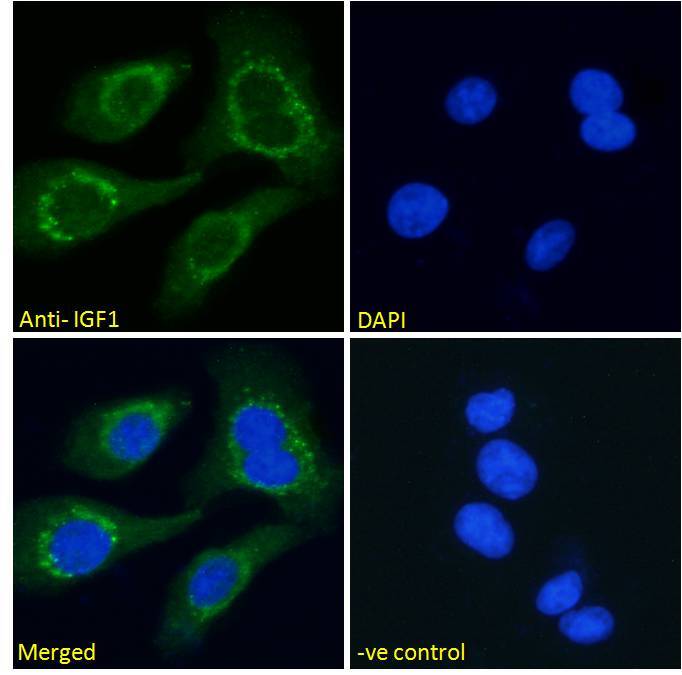
- Immunocytochemistry analysis of IGF1 using IGF1 Polyclonal Antibody (Product # PA5-19382) in paraformaldehyde fixed HEK293 cells, permeabilized with 0.15% Triton. Primary incubation 1hr (10 µg/mL) followed by Alexa Fluor 488 secondary antibody (2 µg/mL), showing cytoplasmic staining. The nuclear stain is DAPI (blue). Negative control: Unimmunized goat IgG (10 µg/mL) followed by Alexa Fluor 488 secondary antibody (2 µg/mL).
Supportive validation
- Submitted by
- Invitrogen Antibodies (provider)
- Main image

- Experimental details
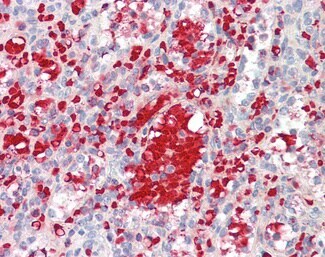
- Immunohistochemistry analysis of IGF1 in Human Spleen (Formalin-Fixed, Paraffin-Embedded). Samples were incubated with IGF1 polyclonal antibody (Product # PA5-19382).
Supportive validation
- Submitted by
- Invitrogen Antibodies (provider)
- Main image
- Experimental details
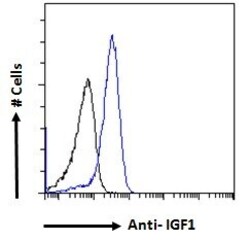
- Flow cytometric analysis of IGF1 in A549 cells using a polyclonal antibody (Product #PA5-19382). A549 cells (blue line) were paraformaldehyde fixed and permeabilized with 0.5% Triton. The primary antibody was incubated for one hour (10 µg/mL) followed by an Alexa Fluor 488 secondary antibody (1 µg/mL). IgG control: Unimmunized goat IgG (black line) followed by an Alexa Fluor 488 secondary antibody.

- Submitted by
- Invitrogen Antibodies (provider)
- Main image

- Experimental details
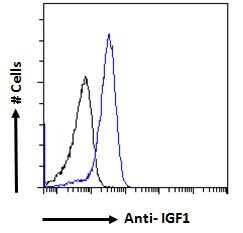
- Flow cytometric analysis of IGF1 in A549 cells using a polyclonal antibody (Product #PA5-19382). A549 cells (blue line) were paraformaldehyde fixed and permeabilized with 0.5% Triton. The primary antibody was incubated for one hour (10 µg/mL) followed by an Alexa Fluor 488 secondary antibody (1 µg/mL). IgG control: Unimmunized goat IgG (black line) followed by an Alexa Fluor 488 secondary antibody.
Supportive validation
- Submitted by
- Invitrogen Antibodies (provider)
- Main image
- Experimental details
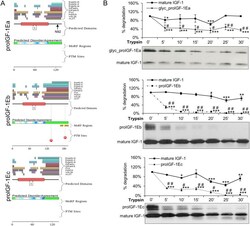
- Figure 1 Evaluation of the intrinsic disorder propensity of human proIGF-1s predicted using the D 2 P 2 platform ( A ) and limited proteolysis ( B ). ( A ) Analysis of the intrinsically disordered regions of human proIGF-1Ea (ENSP00000416811), proIGF-1Eb (ENSP00000302665) and proIGF-1Ec (ENSP00000376638) sequences by the D 2 P 2 platform ( http://d2p2.pro/ ). The red box corresponds to the insulin-like domain; the green-and-white bar in the middle of the plot shows the predicted disorder agreement among nine predictors, with the green parts corresponding to the portions of sequence where at least 75% of the predictors agreed. Yellow bars show the location of the predicted disorder-based binding sites (molecular recognition features, MoRFs), whereas red circles at the bottom of the plot show the location of putative phosphorylation sites. Position of the N-glycosylation site of Ea-domain (N92) is also indicated. ( B ) Limited proteolysis of proIGF-1s. Cell culture supernatants of IGF-1Ea-, IGF-1Eb- or IGF-1Ec-transfected HEK293 cells were concentrated using Amicon Ultra 3 K centrifugal filters and incubated with 0.2 muM trypsin at 37 degC for different times. Reactions were removed over a time-course and the digested products were loaded on 12% SDS-PAGE and analysed by western blotting with an anti-mature IGF-1 antibody. Results are means +- SEM (n = 3). Repeated measures ANOVA, # ( p < 0.01) and ## ( p < 0.0001) significantly different compared to mature IGF-1; *( p < 0.05),
- Submitted by
- Invitrogen Antibodies (provider)
- Main image
- Experimental details
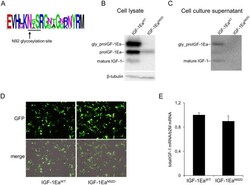
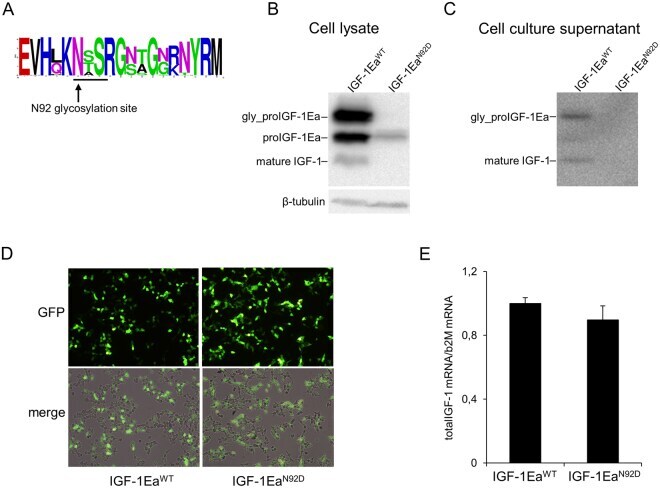
- Figure 3 Conservation of the N-glycosylation site of Ea-domain (N92) ( A ) and effect of site-direct mutation of this N-glycosylation site (IGF-1Ea N92D mutant) on intracellular ( B ) or extracellular ( C ) proIGF-1Ea production. Comparison of transfection efficiency between wild-type (IGF-1Ea WT ) and IGF-1Ea N92D constructs ( D and E ). ( A ) WebLogo of Ea-domain sequences obtained from UniProt database. The relative frequency plots of amino acids of 250 E-domain sequences obtained from UniProt database is shown. The consensus sequence motif for N-glycosylation NX(S/T) (where X can be any amino acid except proline) is underline. The WebLogo was produced using the web server at http://weblogo.berkeley.edu/logo.cgi . ( B and C ) Transfection of HEK293 cells with IGF-1Ea WT or IGF-1Ea N92D . IGF-1Ea WT and IGF-1Ea N92D were transiently expressed in HEK293 cells. After 24 h the cell lysates ( B ) and cell culture supernatants ( C ) were analysed by western blot using an antibody directed against mature IGF-1 sequence. There was no significant difference in GFP fluorescence intensity (10 x magnification) ( D ) and total IGF-1 mRNA quantity ( p = 0.314) ( E ) between the IGF-1Ea WT and IGF-1Ea N92D constructs. Cropped blots are shown. Uncropped blots are presented in Supplementary Fig. S3 .
- Submitted by
- Invitrogen Antibodies (provider)
- Main image
- Experimental details
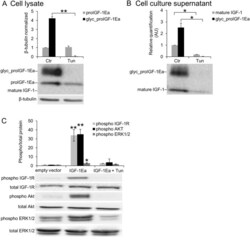
- Figure 4 Effect of tunicamycin (Tun) treatment on proIGF-1Ea glycosylation. ( A and B ) IGF-1Ea was transiently expressed in HEK293 cells in the presence of 0.1 ug/ml of Tun. After 24 h the cell lysates ( A ) and cell culture supernatants ( B ) were analysed by western blot and relative expression level of glycosylatyed proIGF-1Ea, unglycosylated proIGF-1Ea and mature IGF-1 was calculated. The band at a molecular weight of ~17 kDa, corresponding to glycosylated proIGF-1Ea, disappeared in presence of Tun in cell lysates ( A ) and in cell culture supernatants ( B ). The band corresponding to mature IGF-1 (~7 kDa) was markedly reduced in cell culture supernatants after Tun treatment ( B ). ( C ) Phosphorylation of IGF-1R, AKT and ERK1/2 after treatment of MCF-7 cells with cell culture supernatants from IGF-1Ea-transfected HEK293 cells treated with Tun. The phosphorylation of the IGF-1R pathway was markedly reduced by Tun treatment. beta-tubulin was used as a loading control for the cell lysates. Results are means +- SEM (n = 3); T-test or a one-way ANOVA was used to evaluate statistical significance (* p < 0.01, ** p < 0.0001). Cropped blots are shown. Uncropped blots are presented in Supplementary Fig. S4 .

- Submitted by
- Invitrogen Antibodies (provider)
- Main image
- Experimental details
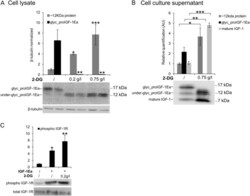
- Figure 6 Effect of 2-Deoxyglucose (2-DG) on glycosylated proIGF-1Ea production. ( A and B ) IGF-1Ea was transiently expressed in HEK293 cells growth in low glucose medium (0.65 g/L) with or without 2-DG. After 24 h the cell lysates ( A ) and cell culture supernatants ( B ) were analysed by western blot and relative expression level of glycosylated proIGF-1Ea, unglycosylated proIGF-1Ea and mature IGF-1 was calculated. The band at a molecular weight around 17 kDa, corresponding to glycosylated proIGF-1Ea, disappeared in the presence of 2-DG in the cell lysates ( A ) and in the cell culture supernatants ( B ). 2-DG treatment determined also an intracellular ( A ) and supernatants ( B ) accumulation of a ~12 kDa band, probably representing an under-glycosylated proIGF-1Ea form. ( C ) Phosphorylation of IGF-1R after treatment of MCF-7 cells with conditioned media from IGF-1Ea-transfected HEK293 cells treated with 2-DG. Phosphorylation of IGF-1R increased both in 2-DG-treated and untreated cells. beta-tubulin was used as a loading control for the cell lysates. Results are means +- SEM (n = 3); T-test or a one-way ANOVA was used to evaluate statistical significance (* p < 0.05, ** p < 0.01 and *** p < 0.0001). Cropped blots are shown. Uncropped blots are presented in Supplementary Fig. S7 .

- Submitted by
- Invitrogen Antibodies (provider)
- Main image
- Experimental details
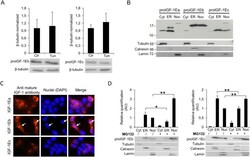
- Figure 7 Effect of inhibition of N-glycosylation using Tun on IGF-1Eb (A, left panel) and IGF-1Ec (A, right panel) production and subcellular localisation of proIGF-1s in untreated ( B and C ) or MG132 treated HEK293 cells ( D ). ( A ) IGF-1Eb or IGF-1Ec were transiently expressed in HEK293 cells in the presence of 0.1 ug/ml of Tun. After 24 h the cell lysates were analysed by western blot and relative expression level of proIGF-1Eb (left panel) and proIGF-1Ec (right panel) was calculated. The molecular weight and the expression level of proIGF-1Eb ( p = 0.8) and proIGF-1Ec ( p = 0.6) were unaffected by Tun treatment. Results are means +- SEM (n = 3); T-test was used to evaluate statistical significance. ( B ) Subcellular localization of IGF-1 isoforms analysed by cytosol, ER and nucleus isolations or ( C ) immunofluorescence staining of IGF-1Ea-, IGF-1Eb- or IGF-1Ec-transfected HEK293 cells. ProIGF-1Ea was mainly localised in the cytosol fraction (unglycosylated proIGF-1Ea) and the ER fraction (both unglycosylated and glycosylated proIGF-1Ea) while proIGF-1Eb and proIGF-1Ec were mainly localised in the nuclear fraction and ER. ( D ) Subcellular localisation of proIGF-E1b (left panel) or proIGF-1Ec (right panel) after treatment with 10 muM of the proteasome inhibitor MG132 for 6 h. Results are means +- SEM (n = 3); a two-way ANOVA was used to evaluate statistical significance (* p < 0.01 and ** p < 0.001). beta-tubulin was used as a loading control for the cell lysates

- Submitted by
- Invitrogen Antibodies (provider)
- Main image
- Experimental details
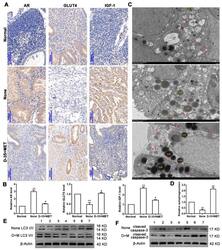
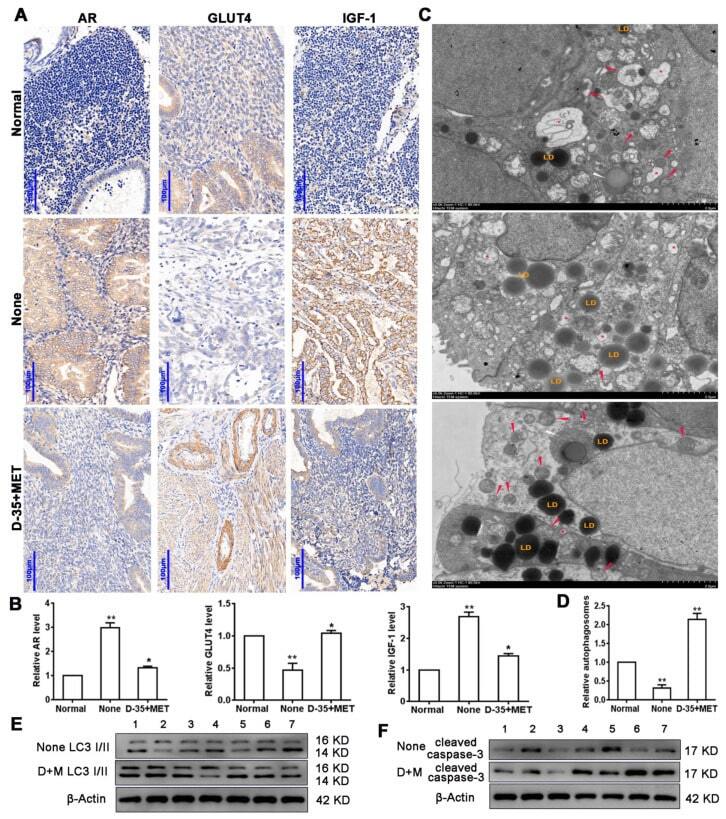
- Figure 1 Diane-35 and metformin reduced AR and IGF-1 expression and increased GLUT4 expression in the early-stage tumor tissue of PCOS patients with EC. Immunohistochemistry ( A ) and PCR analysis ( B ) for AR, GLUT4, and IGF-1 in endometrial carcinoma tissue, scale bars = 100 mum. Transmission electron microscope analysis of patients' tissues: autophagosomes: red arrow, autolysosome: white arrow, lysosome: red asterisk, and lipid droplet: LD, scale bars = 2 mum ( C , D ). Western blotting analysis of LC3 I/II ( E ) and cleaved caspase-3 ( F ) expression levels from 7 different patient samples. Data are shown as the mean +- S.D. * p < 0.05 and ** p < 0.01, ANOVA.
- Submitted by
- Invitrogen Antibodies (provider)
- Main image
- Experimental details
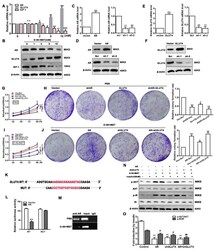
- Figure 4 Cell proliferation and insulin resistance is regulated by Diane-35 and metformin. Ishikawa cells were treated with increasing concentrations of Diane-35 and metformin for 24 h (0, 1, 2, 5, and 10 mM). Then, the expression of AR, GLUT4, and IGF-1 was assessed by qRT-PCR ( A ) and Western blotting ( B ). qRT-PCR ( C , E ) and Western blot ( D , F ) analyses were done for transfection efficiency measurements of the GLUT4 and AR expression vectors in Ishikawa cells. CCK-8 and colony formation assays were performed in transfected cells treated with ( G , H ) or without ( I , J ) Diane-35 and metformin (10 mM). ( K ) Wild and mutant promoter sequences of the GLUT4 gene. ( L ) Dual-luciferase reporting experiment for AR. ( M ) ChIP assay for binding validation between the AR and GLUT4 promoters. ( N , O ) Under Diane-35 and metformin treatment, p-AKT, AKT, p-IR, and IR expression levels in AR, and GLUT4-transfected Ishikawa cells with insulin stimulation. Data are shown as the mean +- S.D., n = 3. n.s. = no statistically significant differences. * p < 0.05, # p < 0.05, & p < 0.05, ** p < 0.01, ## p < 0.01, && p < 0.01 and *** p < 0.001, ### p < 0.001, &&& p < 0.001, ANOVA.
