Explore
 Validate
 Learn
LearnPA5-30773
antibody from Invitrogen Antibodies
Targeting: AKR1B10
AKR1B11, AKR1B12, ALDRLn, ARL-1, ARL1, HIS, HSI
 Western blot
 Immunocytochemistry
Antibody data
- Antibody Data
- Antigen structure
- References [1]
- Comments [0]
- Validations
- Immunocytochemistry [1]
- Other assay [1]
Submit
Validation data
Reference
Comment
Report error
- Product number
- PA5-30773 - Provider product page

- Provider
- Invitrogen Antibodies
- Product name
- AKR1B10 Polyclonal Antibody
- Antibody type
- Polyclonal
- Antigen
- Recombinant full-length protein
- Description
- Recommended positive controls: HeLa, HCT116. Predicted reactivity: Mouse (85%), Rat (84%), Rabbit (91%), Bovine (80%). Store product as a concentrated solution. Centrifuge briefly prior to opening the vial.
- Reactivity
- Human
- Host
- Rabbit
- Isotype
- IgG
- Vial size
- 100 μL
- Concentration
- 0.34 mg/mL
- Storage
- Store at 4°C short term. For long term storage, store at -20°C, avoiding freeze/thaw cycles.
Submitted references Single-cell RNA profiling of Plasmodium vivax-infected hepatocytes reveals parasite- and host- specific transcriptomic signatures and therapeutic targets.
Ruberto AA, Maher SP, Vantaux A, Joyner CJ, Bourke C, Balan B, Jex A, Mueller I, Witkowski B, Kyle DE
Frontiers in cellular and infection microbiology 2022;12:986314
Frontiers in cellular and infection microbiology 2022;12:986314
No comments: Submit comment
Supportive validation
- Submitted by
- Invitrogen Antibodies (provider)
- Main image

- Experimental details
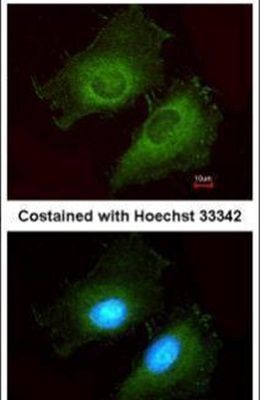
- Immunofluorescent analysis of AKR1B10 in methanol-fixed HeLa cells using an AKR1B10 polyclonal antibody (Product # PA5-30773) at a 1:200 dilution.
Supportive validation
- Submitted by
- Invitrogen Antibodies (provider)
- Main image
- Experimental details
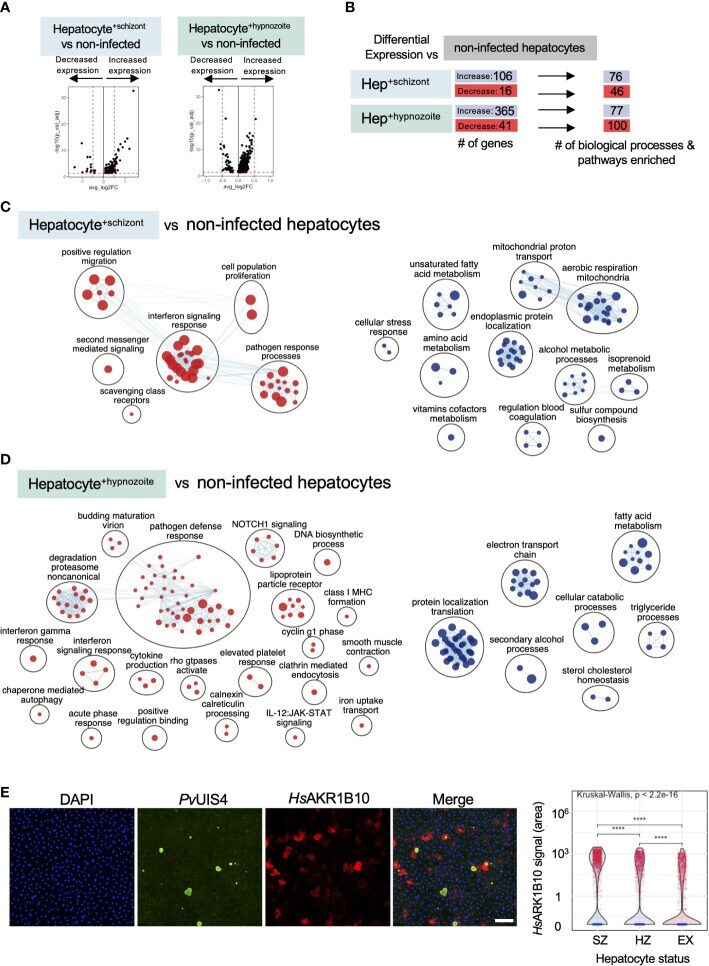
- Analysis of host transcriptional signatures in P. vivax infected hepatocytes. (A) Volcano plots showing changes in gene expression in infected hepatocytes versus non infected (Wilcoxon rank sum, Bonferroni adjusted p value < 0.05). Positive fold change (FC) values represent genes with greater expression, and negative FC values represent genes with decreased expression. Dashed horizontal red lines: Bonferroni adjusted p value = 0.05; dashed vertical red lines: log 2 FC = 0.5. (B) Summary of differential gene expression data shown in the volcano plots and of the enrichment analyses. Hep: hepatocyte. (C) Enrichment map of cellular processes and pathways associated with hepatocyte infection with P. vivax schizonts. (D) Enrichment map of cellular processes and pathways associated with hepatocyte infection with P. vivax hypnozoites. For the maps depicted in panels C and D, node size is proportional to the number of genes identified in each gene set (minimum 3 genes/gene set); each node represents a distinct biological process or pathway derived from gene with decreased expression (red) or increased expression (blue) versus non-infected cells; and edges (blue lines) represent the number of genes overlapping between two processes or pathways. (E) alphaRepresentative confocal image of P. vivax parasites on day 12 post-infection of hepatocytes (left). Cells were stained with DAPI (blue), Pv UIS4 (green), and Hs AKR1B10 (red). White bar represents 100um. Violin plot displaying the distr