Explore
 Validate
 Learn
LearnPA1-46356
antibody from Invitrogen Antibodies
Targeting: NPM1
B23, NPM
 Western blot Immunocytochemistry Immunoprecipitation
 Immunohistochemistry Flow cytometry Other assay
Antibody data
- Antibody Data
- Antigen structure
- References [8]
- Comments [0]
- Validations
- Western blot [1]
- Immunocytochemistry [5]
- Immunoprecipitation [1]
- Other assay [8]
Submit
Validation data
Reference
Comment
Report error
- Product number
- PA1-46356 - Provider product page

- Provider
- Invitrogen Antibodies
- Product name
- NPM1 (mutant) Polyclonal Antibody
- Antibody type
- Polyclonal
- Antigen
- Synthetic peptide
- Description
- Suggested positive control: antigen standard for NPM1 (transient overexpression lysate), OCI-AML3 whole cell lysate. HL-60 lysate can be used as a negative control for wildtype protein.
- Reactivity
- Human, Mouse
- Host
- Rabbit
- Isotype
- IgG
- Vial size
- 100 μL
- Concentration
- 1 mg/mL
- Storage
- Store at 4°C short term. For long term storage, store at -20°C, avoiding freeze/thaw cycles.
Submitted references Mutant NPM1-Regulated FTO-Mediated m(6)A Demethylation Promotes Leukemic Cell Survival via PDGFRB/ERK Signaling Axis.
EAPB0503, an Imidazoquinoxaline Derivative Modulates SENP3/ARF Mediated SUMOylation, and Induces NPM1c Degradation in NPM1 Mutant AML.
Mutant NPM1-regulated lncRNA HOTAIRM1 promotes leukemia cell autophagy and proliferation by targeting EGR1 and ULK3.
Biological Effects of BET Inhibition by OTX015 (MK-8628) and JQ1 in NPM1-Mutated (NPM1c) Acute Myeloid Leukemia (AML).
miRNA-mRNA Profiling Reveals Prognostic Impact of SMC1A Expression in Acute Myeloid Leukemia.
Multiparametric in situ imaging of NPM1-mutated acute myeloid leukemia reveals prognostically-relevant features of the marrow microenvironment.
Up-regulation of EMT-related gene VCAN by NPM1 mutant-driven TGF-β/cPML signalling promotes leukemia cell invasion.
Role of cysteine 288 in nucleophosmin cytoplasmic mutations: sensitization to toxicity induced by arsenic trioxide and bortezomib.
Xiao Q, Lei L, Ren J, Peng M, Jing Y, Jiang X, Huang J, Tao Y, Lin C, Yang J, Sun M, Tang L, Wei X, Yang Z, Zhang L
Frontiers in oncology 2022;12:817584
Frontiers in oncology 2022;12:817584
EAPB0503, an Imidazoquinoxaline Derivative Modulates SENP3/ARF Mediated SUMOylation, and Induces NPM1c Degradation in NPM1 Mutant AML.
Skayneh H, Jishi B, Hleihel R, Hamie M, El Hajj R, Deleuze-Masquefa C, Bonnet PA, El Sabban M, El Hajj H
International journal of molecular sciences 2022 Mar 22;23(7)
International journal of molecular sciences 2022 Mar 22;23(7)
Mutant NPM1-regulated lncRNA HOTAIRM1 promotes leukemia cell autophagy and proliferation by targeting EGR1 and ULK3.
Jing Y, Jiang X, Lei L, Peng M, Ren J, Xiao Q, Tao Y, Tao Y, Huang J, Wang L, Tang Y, Yang Z, Yang Z, Zhang L
Journal of experimental & clinical cancer research : CR 2021 Oct 6;40(1):312
Journal of experimental & clinical cancer research : CR 2021 Oct 6;40(1):312
Biological Effects of BET Inhibition by OTX015 (MK-8628) and JQ1 in NPM1-Mutated (NPM1c) Acute Myeloid Leukemia (AML).
Djamai H, Berrou J, Dupont M, Coudé MM, Delord M, Clappier E, Marceau-Renaut A, Kaci A, Raffoux E, Itzykson R, Berthier C, Wu HC, Hleihel R, Bazarbachi A, de Thé H, Baruchel A, Gardin C, Dombret H, Braun T
Biomedicines 2021 Nov 17;9(11)
Biomedicines 2021 Nov 17;9(11)
miRNA-mRNA Profiling Reveals Prognostic Impact of SMC1A Expression in Acute Myeloid Leukemia.
Gadewal N, Kumar R, Aher S, Gardane A, Gaur T, Varma AK, Khattry N, Hasan SK
Oncology research 2020 May 29;28(3):321-330
Oncology research 2020 May 29;28(3):321-330
Multiparametric in situ imaging of NPM1-mutated acute myeloid leukemia reveals prognostically-relevant features of the marrow microenvironment.
Patel SS, Lipschitz M, Pinkus GS, Weirather JL, Pozdnyakova O, Mason EF, Inghirami G, Hasserjian RP, Rodig SJ, Weinberg OK
Modern pathology : an official journal of the United States and Canadian Academy of Pathology, Inc 2020 Jul;33(7):1380-1388
Modern pathology : an official journal of the United States and Canadian Academy of Pathology, Inc 2020 Jul;33(7):1380-1388
Up-regulation of EMT-related gene VCAN by NPM1 mutant-driven TGF-β/cPML signalling promotes leukemia cell invasion.
Yang L, Wang L, Yang Z, Jin H, Zou Q, Zhan Q, Tang Y, Tao Y, Lei L, Jing Y, Jiang X, Zhang L
Journal of Cancer 2019;10(26):6570-6583
Journal of Cancer 2019;10(26):6570-6583
Role of cysteine 288 in nucleophosmin cytoplasmic mutations: sensitization to toxicity induced by arsenic trioxide and bortezomib.
Huang M, Thomas D, Li MX, Feng W, Chan SM, Majeti R, Mitchell BS
Leukemia 2013 Oct;27(10):1970-80
Leukemia 2013 Oct;27(10):1970-80
No comments: Submit comment
Supportive validation
- Submitted by
- Invitrogen Antibodies (provider)
- Main image
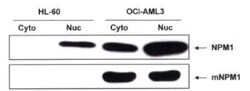
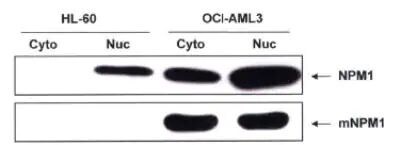
- Experimental details
- Western blot analysis of NPM1 (mutant) in OCI-AML3 lysates. Sample was incubated in NPM1 (mutant) polyclonal antibody (Product # PA1-46356).
Supportive validation
- Submitted by
- Invitrogen Antibodies (provider)
- Main image
- Experimental details
- Immunocytochemistry analysis of NPM1 (mutant) in HL-60 cells (negative control). Samples were incubated in NPM1 (mutant) polyclonal antibody (Product # PA1-46356). Nucleophosmin localization by immunofluorescence.

- Submitted by
- Invitrogen Antibodies (provider)
- Main image
- Experimental details
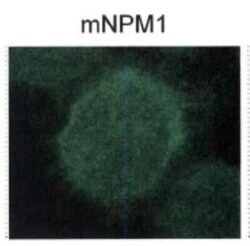
- Immunocytochemistry analysis of NPM1 (mutant) in OCI-AML3 cells. Samples were incubated in NPM1 (mutant) polyclonal antibody (Product # PA1-46356). Nucleophosmin localization by immunofluorescence.
- Submitted by
- Invitrogen Antibodies (provider)
- Main image

- Experimental details
- Immunocytochemistry analysis of NPM1 (mutant) in HL-60 cells (negative control). Samples were incubated in NPM1 (mutant) polyclonal antibody (Product # PA1-46356). Nucleophosmin localization by immunofluorescence.
- Submitted by
- Invitrogen Antibodies (provider)
- Main image

- Experimental details
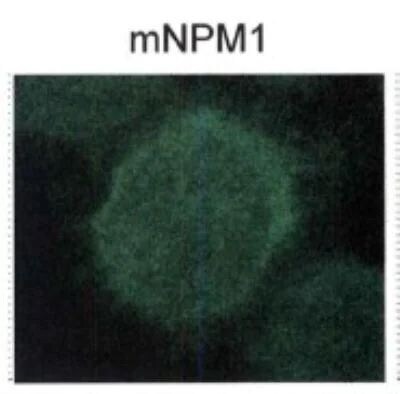
- Immunocytochemistry analysis of NPM1 (mutant) in OCI-AML3 cells. Samples were incubated in NPM1 (mutant) polyclonal antibody (Product # PA1-46356). Nucleophosmin localization by immunofluorescence.

Supportive validation
- Submitted by
- Invitrogen Antibodies (provider)
- Main image
- Experimental details
- NPM1 localization by immunofluorescence in HL-60 cells (negative control).
Supportive validation
- Submitted by
- Invitrogen Antibodies (provider)
- Main image
- Experimental details
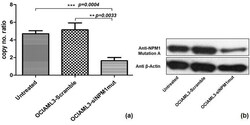
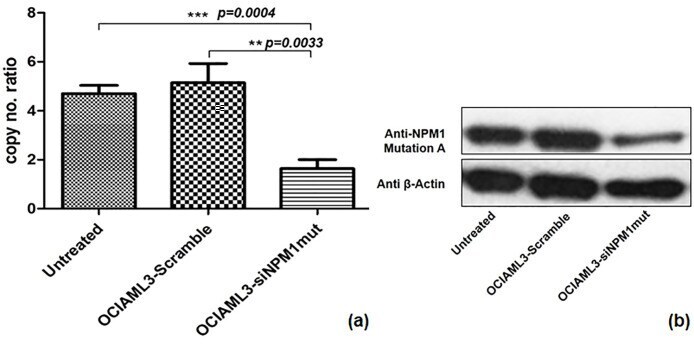
- Figure 1 Quantitative expression of NPM1 mutation A by RQ-PCR (a) and Western blot (b). ** p
- Submitted by
- Invitrogen Antibodies (provider)
- Main image
- Experimental details
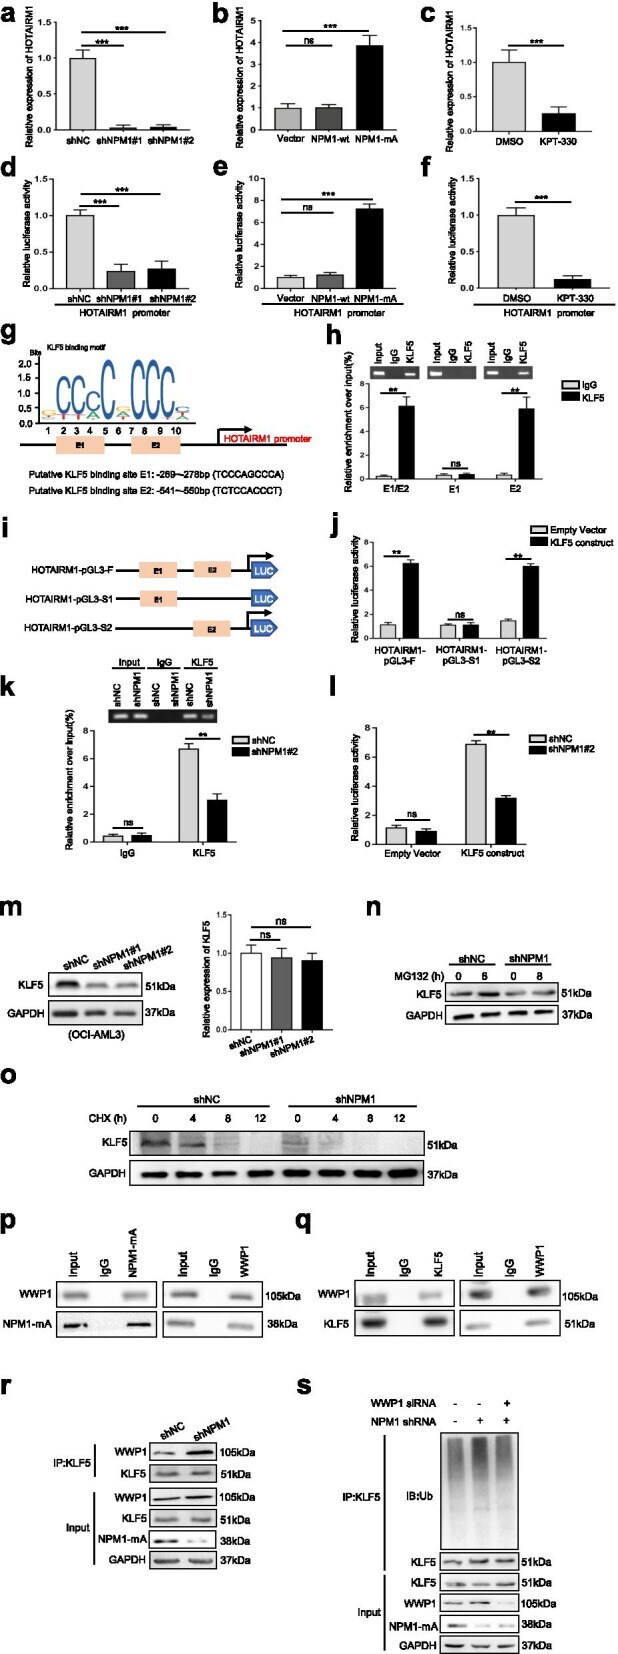
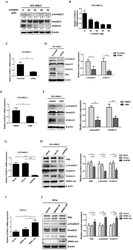
- Fig. 2 HOTAIRM1 expression is induced by mutant NPM1 via KLF5-dependent transcriptional regulation. a-b HOTAIRM1 expression was measured by qRT-PCR in OCI-AML3 cells transfected with shNPM1 ( a ) and in OCI-AML2 cells transfected with the NPM1-mA plasmid ( b ). c qRT-PCR was conducted to determine the level of HOTAIRM1 in OCI-AML3 cells treated with KPT-330. d-e Relative luciferase activity was analyzed in NPM1-mA-silenced OCI-AML3 cells transfected with the HOTAIRM1 promoter construct ( d ) and NPM1-mA-enforced OCI-AML2 cells transfected with the HOTAIRM1 promoter construct ( e ). f Luciferase reporter assays were performed with KPT-330-treated OCI-AML3 cells using the indicated reporters. g Prediction of KLF5 binding sites in the HOTAIRM1 promoter region using JASPAR. h Enrichment of KLF5 on the E2 fragment of the HOTAIRM1 promoter was measured by ChIP in OCI-AML3 cells. i Construction of the luciferase reporter vectors HOTAIRM1-pGL3-F (containing all KLF5 binding sites), HOTAIRM1-pGL3-S1 (containing the sites at bp - 269 and - 278) and HOTAIRM1-pGL3-S2 (containing the sites at bp - 541 and - 550). j Luciferase reporter assays of OCI-AML3 cells transfected with the HOTAIRM1-pGL3-F, HOTAIRM1-pGL3-S1, or HOTAIRM1-pGL3-S2 vector, the KLF5 construct, or empty vector. k Enrichment of KLF5 on the HOTAIRM1 promoter in OCI-AML3 cells treated with or without shNPM1 was detected by ChIP. l HOTAIRM1 promoter activity in OCI-AML3 cells treated with or without shNPM1 was detected by luc
- Submitted by
- Invitrogen Antibodies (provider)
- Main image

- Experimental details
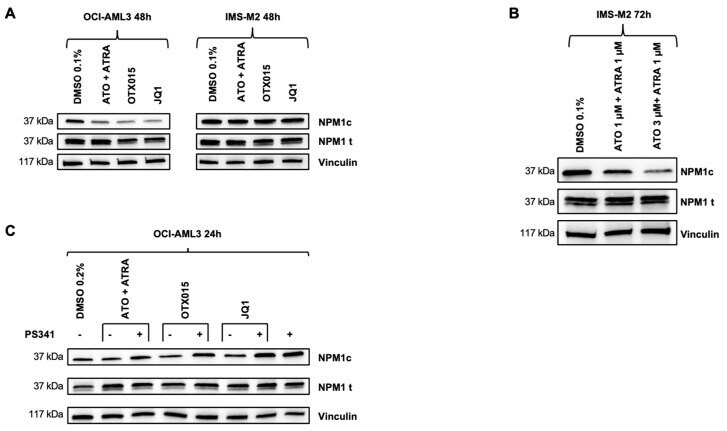
- Figure 3 Effects of BETi on NPM1c/NPMwt protein expression. ( A ) OCI-AML3 cells were exposed 48 h either to 0.1% DMSO, 500 nM OTX015 (MK-8628), 500 nM JQ1, or 1000 nM ATO + 1000 nM ATRA. Western blot showing protein expression of NPM1c oncoprotein and total NPM1 by using appropriate antibodies were performed. Vinculin was used as loading control. One representative experiment out of three is shown. ( B ) IMS-M2 cells were exposed 72 h either to 0.1% DMSO, 1000 nM ATO + 1000 nM ATRA, or 3000 nM ATO + 1000 nM ATRA. Western blot showing protein expression of NPM1c oncoprotein and total NPM1 by using appropriate antibodies were performed. Vinculin was used as loading control. One representative experiment out of three is shown. ( C ) OCI-AML3 cells were exposed 24 h either to 0.2% DMSO, 500 nM OTX015 (MK-8628), 500 nM JQ1, or 1000 nM ATO + 1000 nM ATRA in the presence or absence of 10 nM of the proteasome inhibitor PS341 (bortezomib). Western blot showing protein changes of NPM1c oncoprotein and total NPM1 protein by using appropriate antibodies was performed. Vinculin was used as loading control. One representative experiment out of three is shown.
- Submitted by
- Invitrogen Antibodies (provider)
- Main image
- Experimental details
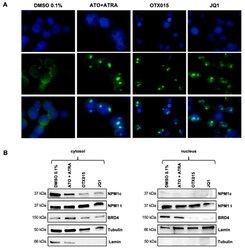
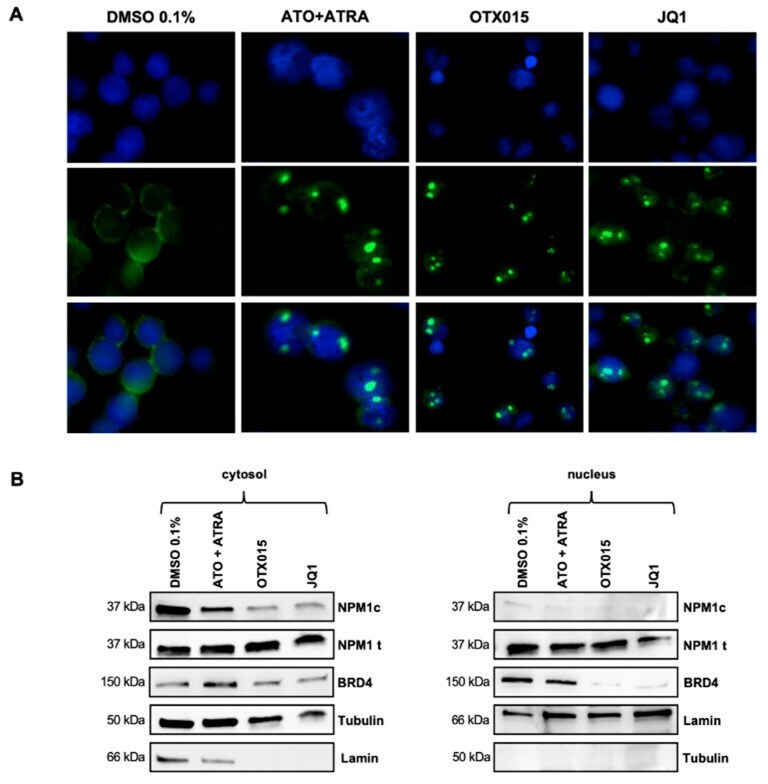
- Figure 4 Intracellular shuttling of NPM1 and BRD4 after BETi treatment of OCI-AML3 cells. ( A ) Confocal immunofluorescence microscopy for cellular localization of NPM1 (wt + c) was performed after 48 h exposure either to 0.1% DMSO, 1000 nM ATO + 1000 nM ATRA, 500 nM OTX015 (MK-8628), or 500 nM JQ1. Cells were stained with an antibody-recognizing NPM (wt + c) (green) and nuclei are labeled blue by DAPI. One representative experiment out of three is shown. ( B ) OCI-AML3 cells were exposed 48 h either to 500 nM OTX015 (MK-8628), 500 nM JQ1, 1000 nM ATO + 1000 nM ATRA, or 0.1% DMSO and nuclear and cytosolic proteins were extracted. Western blot showing protein changes of NPM1c oncoprotein, total NPM1 protein, and BRD4 by using appropriate antibodies were performed. Tubulin and lamin were used as appropriate loading controls and proper separation controls (not shown) of the cytosol and the nucleus respectively. One representative experiment out of three is shown.
- Submitted by
- Invitrogen Antibodies (provider)
- Main image

- Experimental details
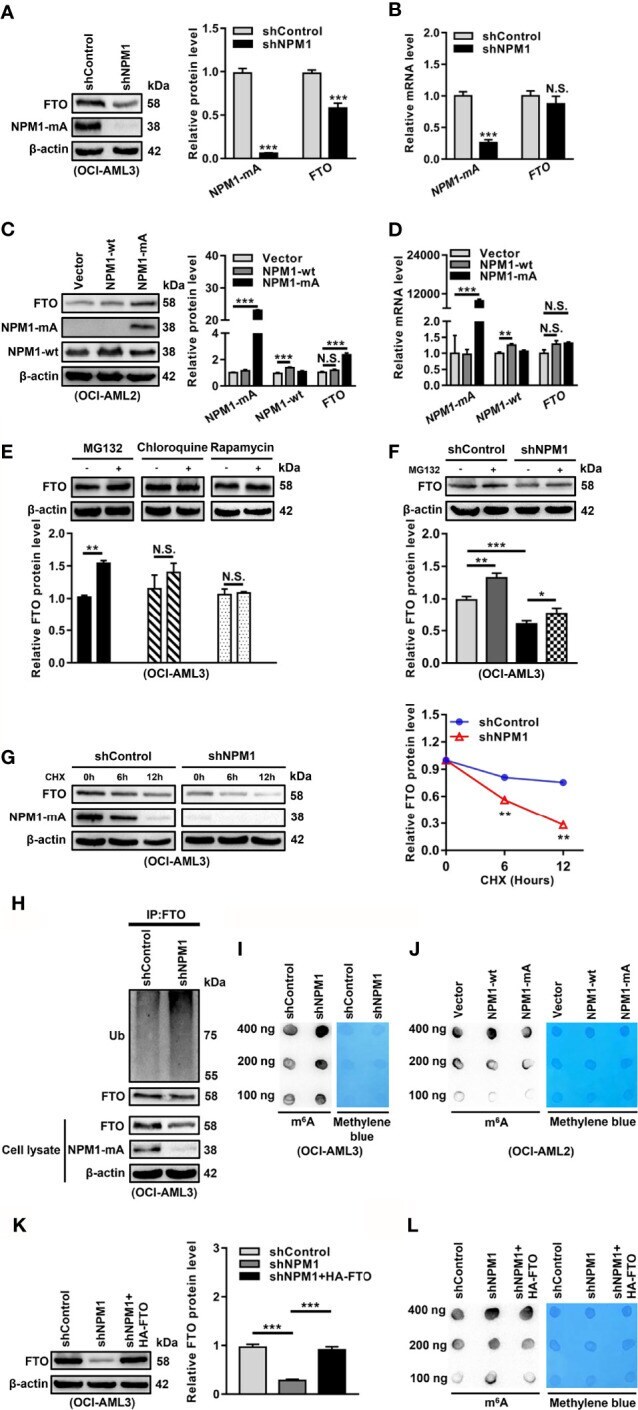
- Figure 2 NPM1-mA Upregulates FTO Expression to Reduce the m 6 A Level through Impeding the Proteasome Pathway. (A, C) Western blot analysis of the FTO, NPM1-mA, and NPM1-wt protein level in the NPM1-mA-silenced OCI-AML3, NPM1-wt-enforced OCI-AML2, and NPM1-mA-enforced OCI-AML2 cells. The bar graph showed the relative level of protein. (B, D) qRT-PCR analysis of the FTO, NPM1-mA, and NPM1-wt mRNA level in the NPM1-mA-silenced OCI-AML3, NPM1-wt-enforced OCI-AML2, and NPM1-mA-enforced OCI-AML2 cells. (E) OCI-AML3 cells were treated with the ubiquitin-proteasome pathway inhibitor MG132 (20 muM), the autophagic-lysosomal pathway inhibitor CQ (20 muM), and activator rapamycin (20 muM) for 8 h. The bar graph showed the relative level of FTO protein. (F) Western blot analysis of the FTO protein level in the NPM1-silenced OCI-AML3 cells following treatment with MG132 (20 muM) for 8h. The bar graph showed the relative level of FTO protein. (G) Western blot analysis of the FTO and NPM1-mA protein level in the NPM1-mA-silenced OCI-AML3 cells following treatment with the protein synthesis inhibitor CHX (100 mug/mL) for the indicated time. The line graph showed the degradation rate of FTO protein. (H) Ubiquitination analysis of the ubiquitinated FTO level in the NPM1-mA-silenced OCI-AML3 cells. beta-actin was used as the internal control. (I, J) m 6 A dot blot analysis of the global m 6 A abundance in the NPM1-mA-silenced OCI-AML3, NPM1-wt-enforced OCI-AML2, and NPM1-mA-enforced OCI-AML2 c
- Submitted by
- Invitrogen Antibodies (provider)
- Main image
- Experimental details
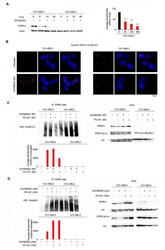
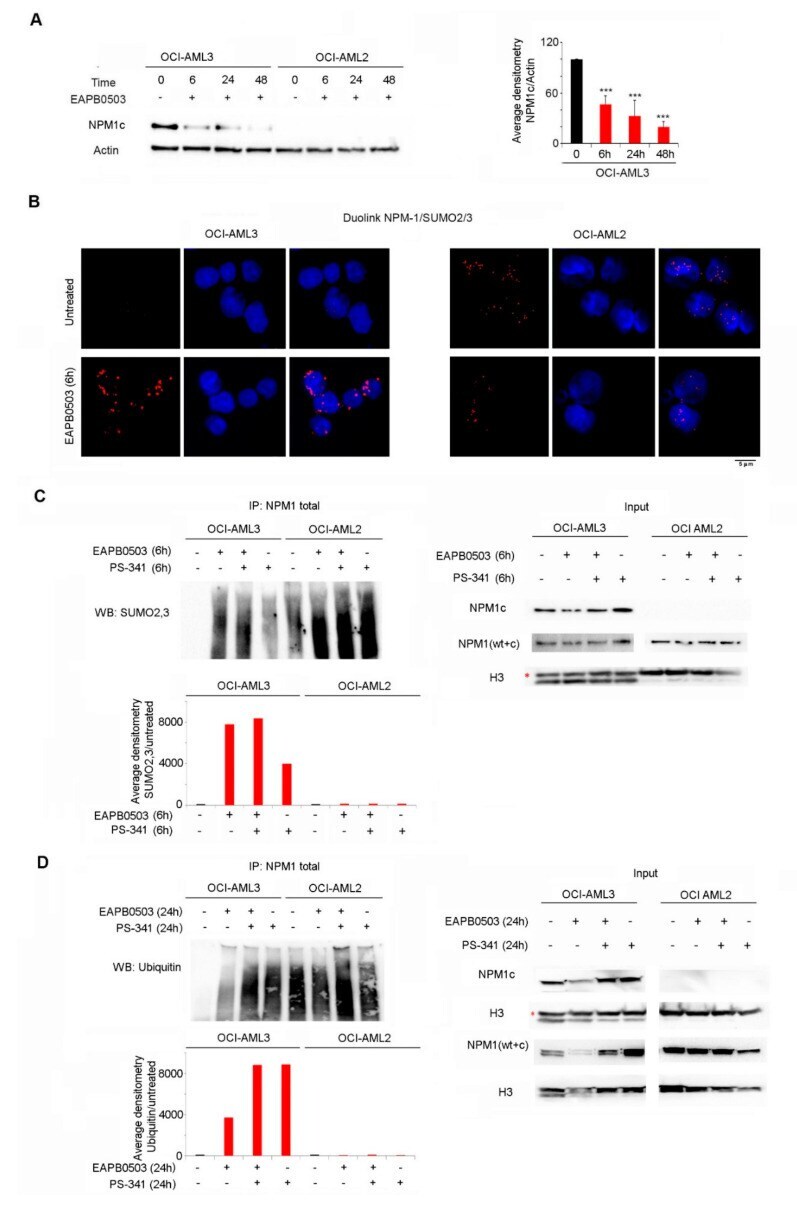
- Figure 3 NPM1c expressing cells exhibit low basal levels of SUMOylation, and EAPB0503 restores NPM1c post-translational modifications triggering its proteasomal degradation. ( A ) Western blot analysis of NPM1c and Actin in OCI-AML3 and OCI-AML2 cells treated with EAPB0503 for 6, 24 and 48 h. Histogram represents the average densitometry of NPM1c/Actin in OCI-AML3 cells in three independent experiments. ( B ) Endogenous interactions detected by Duolink between NPM1 ( wt + c) and SUMO 2/3 (Red) in untreated OCI-AML3 and OCI-AML2 cells (upper panel) or EAPB0503 treated cells for 6 h (lower panel). Nuclei were stained with 4-,6-diamidino-2-phenylindole (DAPI) (blue). ( C ) OCI-AML3 and OCI-AML2 cells were treated with EAPB0503 and PS-341 for 6 h. NPM1 ( wt + c) immunoprecipitates [IP-NPM1 ( wt + c)] were blotted for SUMO 2/3. Input was blotted for NPM1c, NPM1 ( wt + c) and H3. ( D ) OCI-AML3 and OCI-AML2 cells were treated with EAPB0503 and PS-341 for 24 h. NPM1 ( wt + c) immunoprecipitates [IP-NPM1 ( wt + c)] were blotted for Ubiquitin. Input was blotted for NPM1c, NPM1 ( wt + c) and H3. *** p < 0.001.
- Submitted by
- Invitrogen Antibodies (provider)
- Main image
- Experimental details
- Figure 3 VCAN-V1 is up-regulated by NPM1-mA via TGF-beta/cPML/Smad signalling in OCI-AML3 cells. (A) Western blot analysis of p-Smad2/3, Smad2/3 and VCAN-V1, (B) qRT-PCR analysis of VCAN-V1 mRNA expression from OCI-AML3 cells treated with LY364947. (C) qRT-PCR analysis of VCAN-V1 mRNA expression, (D) western blot analysis of p-Smad2/3, Smad2/3, VCAN-V1 and PML from the PML-silenced OCI-AML3 cells. (E) qRT-PCR analysis of VCAN-V1 mRNA expression, (F) western blot analysis of p-Smad2/3, Smad2/3, VCAN-V1 from the OCI-AML3 cells treated with 20 nM LMB. (G) qRT-PCR analysis of VCAN-V1 mRNA expression, (H) western blot analysis of PML, p-Samd2/3, Smad2/3, VCAN-V1 and NPM1-mA from the NPM1-silenced OCI-AML3 cells. (I) qRT-PCR analysis of VCAN-V1 mRNA expression, (J) western blot analysis of PML, p-Samd2/3, Smad2/3, VCAN-V1 and NPM1-mA from the KG1a cells transduced with the plasmids expressing NPM1-wt or NPM1-mA. (K) Western blot analysis of PML, p-Smad2/3, Smad2/3, VCAN-V1, and NPM1-mA from the NPM1-silenced OCI-AML3 cells transfected with plasmids expressing cPML. Proteins were quantified using image software and normalized against beta-actin. Data were represented as mean +- s.d. of three individual experiments. * p < 0.05, ** p < 0.01, *** p < 0.001.

- Submitted by
- Invitrogen Antibodies (provider)
- Main image
- Experimental details
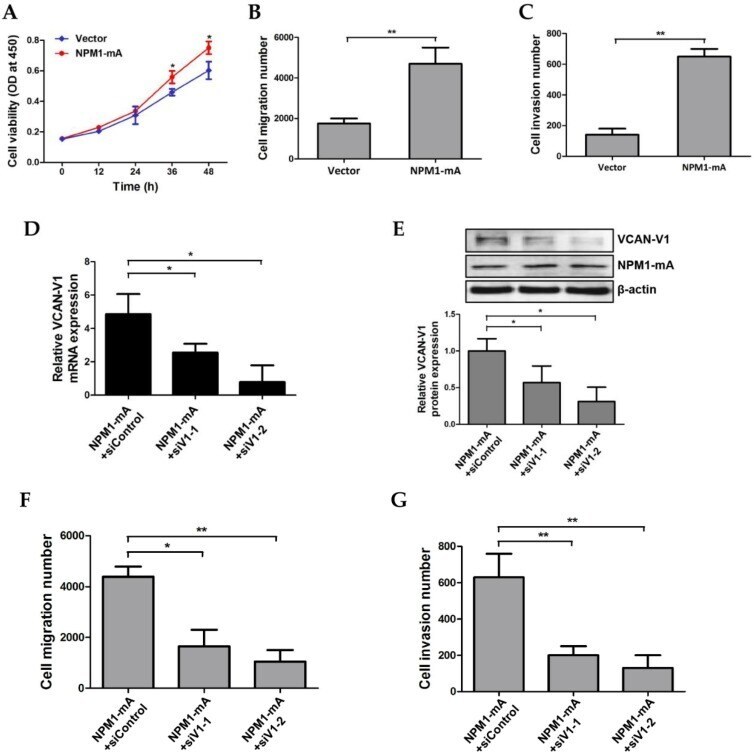
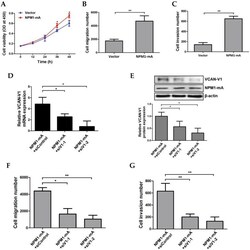
- Figure 5 Increased VCAN-V1 by overexpressing NPM1-mA enhances migration and invasion ability of KG1a cells. (A) CCK-8 analysis of cell proliferation activity in KG1a cells overexpressed with NPM1-mA. (B) The number of migration cells in the NPM1-mA group was significantly higher than that in the vector group. (C) The number of invasive cells in the NPM1-mA group was higher than that in the vector group. (D) qRT-PCR of VCAN-V1 mRNA expression, (E) western blot analysis of VCAN-V1 protein expression in NPM1-mA-enforced KG1a cells transfected with siRNAs targeting VCAN-V1. (F) Down-regulation of VCAN-V1 inhibited NPM1-mA-induced cell migration in KG1a cells. (G) Down-regulation of VCAN-V1 inhibited NPM1-mA-induced cell invasion in KG1a cells. Data were represented as mean +- s.d. of three individual experiments. * p < 0.05, ** p < 0.01.