Explore
 Validate
 Learn
Learn Western blot
 ELISA
ELISA Other assay
Antibody data
- Antibody Data
- Antigen structure
- References [2]
- Comments [0]
- Validations
- Other assay [3]
Submit
Validation data
Reference
Comment
Report error
- Product number
- PA1-46223 - Provider product page

- Provider
- Invitrogen Antibodies
- Product name
- PTCH2 Polyclonal Antibody
- Antibody type
- Polyclonal
- Antigen
- Other
- Reactivity
- Human, Mouse
- Host
- Rabbit
- Isotype
- IgG
- Vial size
- 100 μg
- Concentration
- 1 mg/mL
- Storage
- Store at 4°C short term. For long term storage, store at -20°C, avoiding freeze/thaw cycles.
Submitted references Ptch2/Gas1 and Ptch1/Boc differentially regulate Hedgehog signalling in murine primordial germ cell migration.
Deficiency of patched 1-induced Gli1 signal transduction results in astrogenesis in Swedish mutated APP transgenic mice.
Kim Y, Lee J, Seppala M, Cobourne MT, Kim SH
Nature communications 2020 Apr 24;11(1):1994
Nature communications 2020 Apr 24;11(1):1994
Deficiency of patched 1-induced Gli1 signal transduction results in astrogenesis in Swedish mutated APP transgenic mice.
He P, Staufenbiel M, Li R, Shen Y
Human molecular genetics 2014 Dec 15;23(24):6512-27
Human molecular genetics 2014 Dec 15;23(24):6512-27
No comments: Submit comment
Supportive validation
- Submitted by
- Invitrogen Antibodies (provider)
- Main image
- Experimental details
- NULL
- Submitted by
- Invitrogen Antibodies (provider)
- Main image
- Experimental details
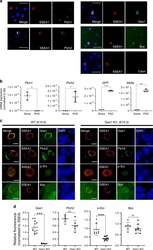
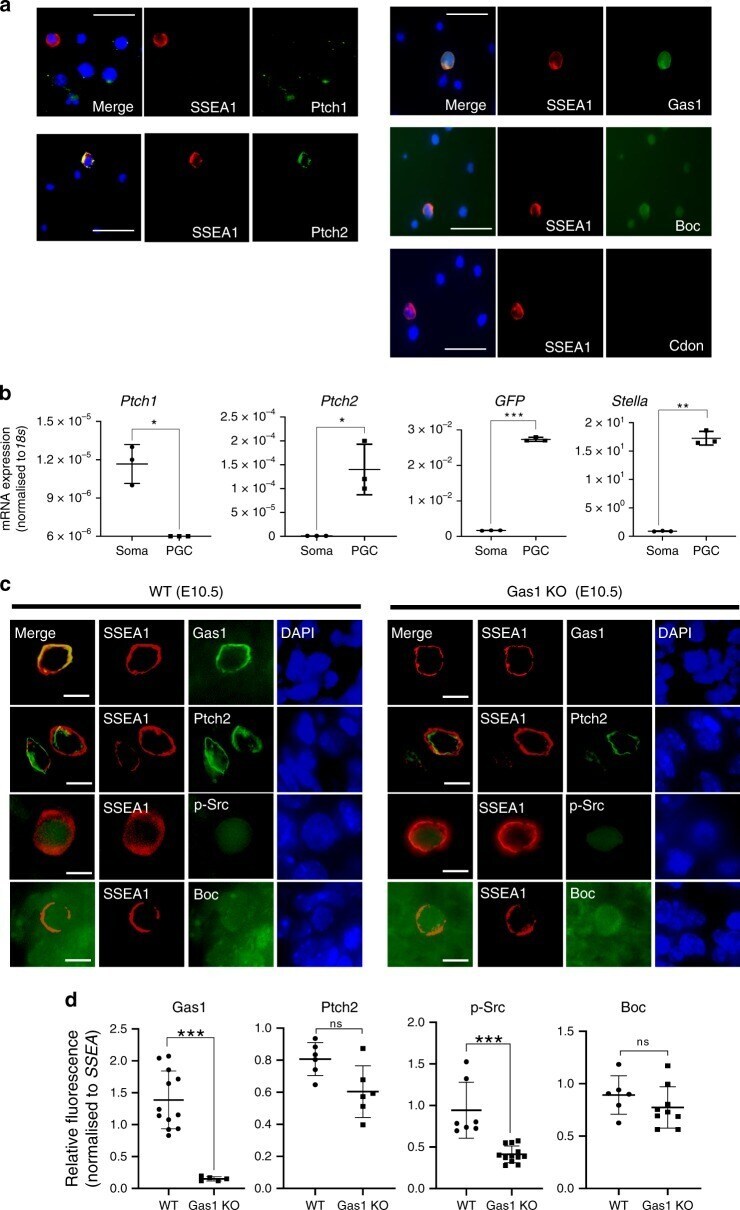
- Fig 5 Ptch1/2 and co-receptors are differentially expressed in PGCs and somatic cells. a Expression of Ptch1, Ptch2, Gas1, Boc and Cdon demonstrated by immunofluorescence analyses of primary cultures of dissected E10.5 mouse GR, with co-staining of SSEA1. Representative images from three independent experiments are shown. Scale bar, 50 mum. b Single-cell suspensions from freshly-dissected GR of E10.5 GFP Stella embryos were sorted by FACS (Supplementary Fig. 4 ) and the expression of Ptch1, Ptch2, GFP and Stella in GFP-positive (PGCs) and GFP-negative (somatic cells) populations analysed by quantitative RT-PCR. Each data point represents one experiment. Values normalised to 18s rRNA were plotted with error bars representing SD ( n = 3) after unpaired t -test (* P < 0.05, ** P < 0.005, *** P < 0.001). c Immunofluorescence analyses of Gas1, Ptch2, p-Src, Boc and SSEA1 on the GR tissue sections of WT and Gas1 KO embryos at E10.5. The merged images are shown without DAPI signal for improved clarity. Representative images from three independent experiments are shown. Scale bar, 10 um. d Dot plots showing the relative fluorescence intensity values of Gas1, Ptch2, p-Src, Boc signal observed in PGCs which were normalised with the fluorescence intensity values of SSEA in each cell. Gas1 KO embryos showed a significant decrease in signal intensity in Gas1 (WT ( n = 12), KO ( n = 5), **** P < 0.0001) and p-Src (WT ( n = 7), KO ( n = 12), ** P = 0.0054) but no significant changes in Ptch
- Submitted by
- Invitrogen Antibodies (provider)
- Main image
- Experimental details
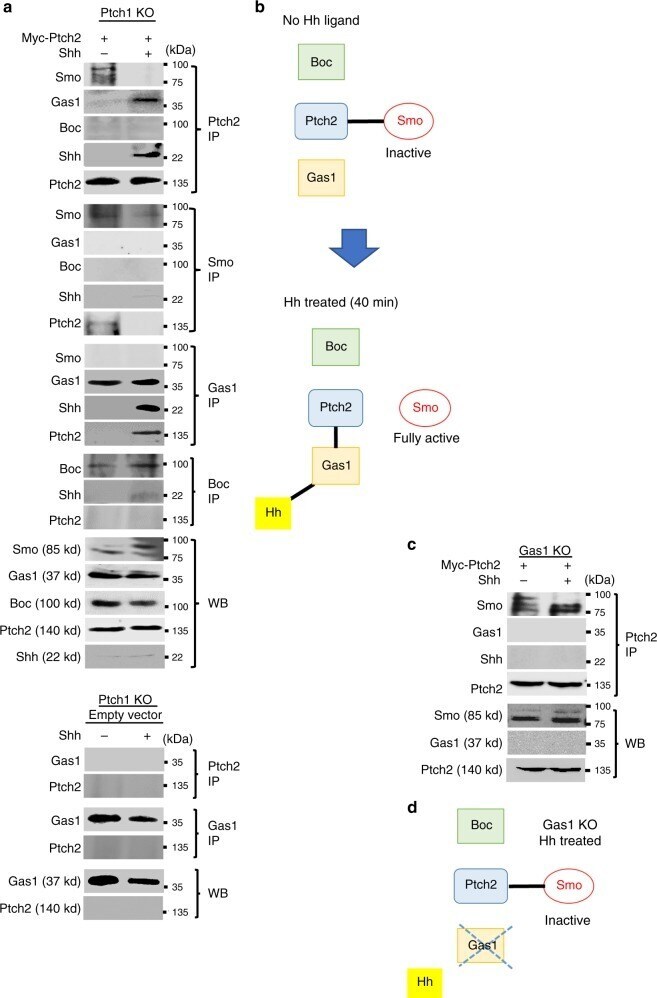
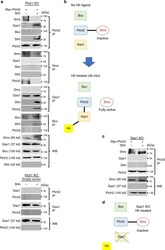
- Fig. 6 Gas1 mediates Hh ligand reception by Ptch2. a Representative images of at least two independent immunoblotting experiments in which NIH3T3/Cas9 cells with Ptch1 KO were transfected with Myc-tagged Ptch2 expression construct and stimulated with Shh protein in serum-free medium for 40 min. Interactions of Ptch2 with endogenous Smo, Gas1 and Boc were analysed by immunoprecipitation (IP) and Western blotting (WB). IP was performed using specific antibodies as indicated and analysed by WB with respective antibodies as shown. The images in the bottom panel are from Ptch1 KO cells transfected with empty vector, which did not show any co-precipitation of endogenous Gas1 and Ptch2 regardless of Shh treatment, confirming the specificity of these antibodies (bottom panel). b A schematic diagram illustrating the protein interactions before and after Shh treatment. c NIH3T3/Cas9 cells with Gas1 KO were transfected with Myc-tagged Ptch2 and stimulated with Shh protein in serum-free medium for 40 min. IP was performed with anti-Myc antibody. Representative blots from two independent experiments are shown. d A schematic diagram illustrating the protein interactions in Gas1 KO cells. Source data are provided as a Source Data file.