Explore
 Validate
 Learn
Learn Western blot
 Immunocytochemistry
Antibody data
- Antibody Data
- Antigen structure
- References [1]
- Comments [0]
- Validations
- Immunocytochemistry [1]
- Immunohistochemistry [2]
- Other assay [5]
Submit
Validation data
Reference
Comment
Report error
- Product number
- PA5-27221 - Provider product page

- Provider
- Invitrogen Antibodies
- Product name
- TDP-43 Polyclonal Antibody
- Antibody type
- Polyclonal
- Antigen
- Recombinant full-length protein
- Description
- Recommended positive controls: H1299, HeLa, mouse brain. Predicted reactivity: Mouse (96%), Chicken (94%), Bovine (98%). Store product as a concentrated solution. Centrifuge briefly prior to opening the vial.
- Reactivity
- Human, Mouse, Rat
- Host
- Rabbit
- Isotype
- IgG
- Vial size
- 100 μL
- Concentration
- 1 mg/mL
- Storage
- Store at 4°C short term. For long term storage, store at -20°C, avoiding freeze/thaw cycles.
Submitted references TDP-43 Triggers Mitochondrial DNA Release via mPTP to Activate cGAS/STING in ALS.
Yu CH, Davidson S, Harapas CR, Hilton JB, Mlodzianoski MJ, Laohamonthonkul P, Louis C, Low RRJ, Moecking J, De Nardo D, Balka KR, Calleja DJ, Moghaddas F, Ni E, McLean CA, Samson AL, Tyebji S, Tonkin CJ, Bye CR, Turner BJ, Pepin G, Gantier MP, Rogers KL, McArthur K, Crouch PJ, Masters SL
Cell 2020 Oct 29;183(3):636-649.e18
Cell 2020 Oct 29;183(3):636-649.e18
No comments: Submit comment
Supportive validation
- Submitted by
- Invitrogen Antibodies (provider)
- Main image

- Experimental details
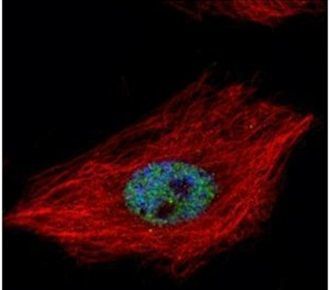
- Immunofluorescent analysis of TARDBP in paraformaldehyde-fixed HeLa cells using a TARDBP polyclonal antibody (Product # PA5-27221) (Green) at a 1:500 dilution. Alpha-tubulin filaments were labeled with Product # PA5-29281 (Red) at a 1:2000.
Supportive validation
- Submitted by
- Invitrogen Antibodies (provider)
- Main image

- Experimental details
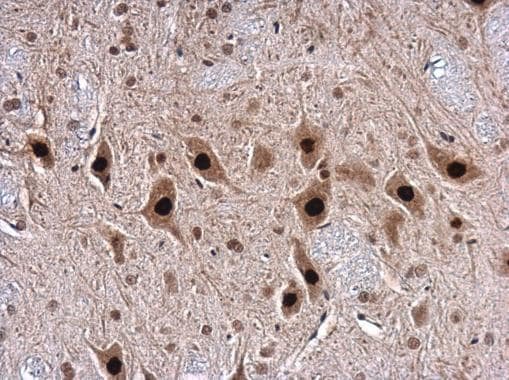
- Immunohistochemical analysis of paraffin-embedded rat brain, using TARDBP (Product # PA5-27221) antibody at 1:500 dilution. Antigen Retrieval: EDTA based buffer, pH 8.0, 15 min.
- Submitted by
- Invitrogen Antibodies (provider)
- Main image

- Experimental details
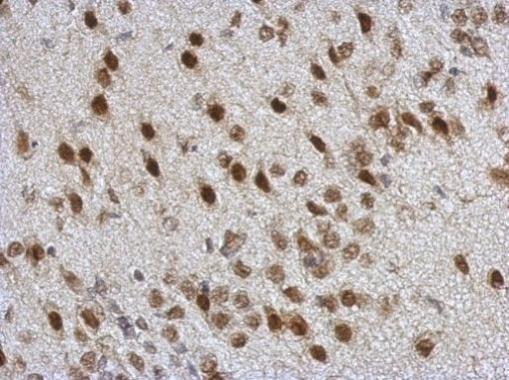
- Immunohistochemistry (Paraffin) analysis of TDP-43 was performed in paraffin-embedded mouse brain tissue using TDP-43 Polyclonal Antibody (Product # PA5-27221) at a dilution of 1:500.
Supportive validation
- Submitted by
- Invitrogen Antibodies (provider)
- Main image

- Experimental details
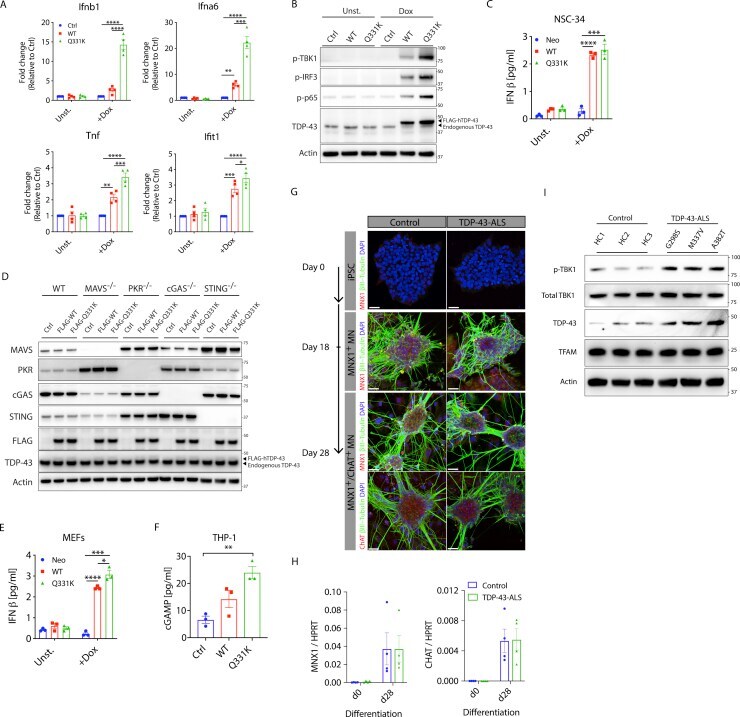
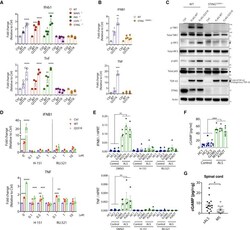
- Figure S1 Elevated NF-kappaB and Type I IFN Signaling Because of TDP-43 In Vitro , Related to Figure 1 (A) Doxycycline (Dox inducible wild-type (WT) or ALS mutant (Q331K) TDP-43 was stably transduced into the mouse neuronal cell line NSC-34. 72 hr after TDP-43 induction, RNA was collected for qPCR of Ifnb1 , Ifna6 , Ifit1 and Tnf or (B) cells were lysed for western blot of p-TBK1, p-IRF3, p-p65, TDP-43 and actin as control. Blots are representative of three independent experiments. (C) IFNbeta ELISA was performed on the supernatant from cells in (A). (D) Representative western blot of MAVS, PKR, cGAS, STING, FLAG, TDP-43 and Actin from cells in Figure. 1A. (E) IFNbeta ELISA was performed on the supernatant from MEFs after 72hrs induction of WT and Q331K TDP-43. (F) cGAMP ELISA was performed on the lysates of human THP-1 cells overexpressing TDP-43 (WT or Q331K) after 72hrs induction. (G) Images of healthy control and TDP-43-ALS patient iPSC during differentiation into premature MNX1 + motor neurons (day 18) and further into mature MNX1 + /ChAT + motor neurons (day 28). (red - MNX1 or ChAT, green - beta3-tubulin and blue - DAPI). (scale: 40 mum). (H) MNX1 and CHAT expression, measured by qPCR in undifferentiated (day 0) and differentiated iPSC-derived MNs (day 28). (I) Representative western blot of p-TBK1, total TBK1, TDP-43, TFAM and Actin for cells in (G) (lysed in 1% NP-40). Data are mean +- SEM from 3-4 independent experiments. P value s were calculated using one-way or t
- Submitted by
- Invitrogen Antibodies (provider)
- Main image
- Experimental details
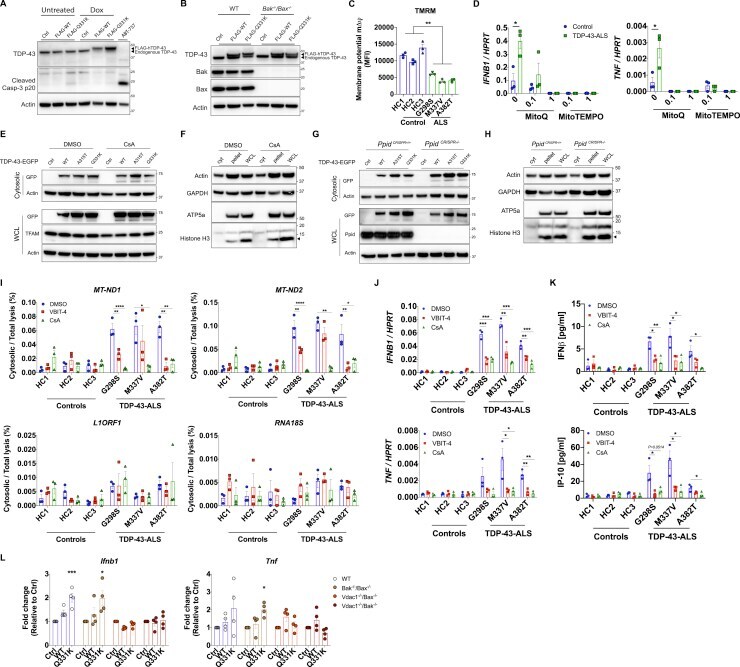
- Figure S4 TDP-43 Releases mtDNA via the mPTP, Related to Figure 4 (A) Representative western blot of cleaved caspase-3 in TDP-43-overexpressing Mcl1 -/- MEFs 72hrs post doxycycline (Dox) treatment, or treated with ABT-737 to induce apoptosis (t = 4h). (B) Representative western blot of Bak, Bax, TDP-43 and actin from cells in Figure 4 A. (C) iPSC-derived MNs from healthy controls and ALS patients carrying mutations in TDP-43 were stained with Tetramethylrhodamine Methyl Ester (TMRM) to probe mitochondrial membrane potential (mDeltaPsi) and quantified by FACS analysis (MFI: mean fluorescence intensity). (D) Mitochondrial ROS inhibitors, mitoQ and mitoTEMPO (0.1-1 muM), potently prevent induction of IFNB1 and TNF in TDP-43-ALS iPSC-MNs. (E-F) Representative western blot analysis of cytosolic lysates (0.025% digitonin) and WCL (1x RIPA) from HEK293T cells treated with CsA (12.5 muM) or from (G-H) CRISPR Ppid knockout MEFs transfected with TDP-43-EGFP (WT, A315T and Q331K, 2.5 mug) or untransfected (Ctrl). Cytosolic fraction purity was confirmed using the subcellular markers indicated (I) Treatment with VBIT-4 and CsA (10 µM, t = 24h) reduces mtDNA ( MT-ND1 and MT-ND2 ) release into the cytoplasm as performed in Figure S3C, (J) reduces expression of IFNB1 and TNF as determined by qPCR, and (K) reduces production of IFNbeta and IP-10 quantified by ELISA. (L) CRISPR Vdac1 knockout MEFs display no TDP-43-induced Ifnb1 and Tnf expression. Data are mean +- SEM from 3-4 independe
- Submitted by
- Invitrogen Antibodies (provider)
- Main image
- Experimental details
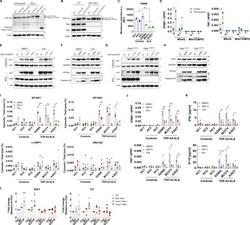
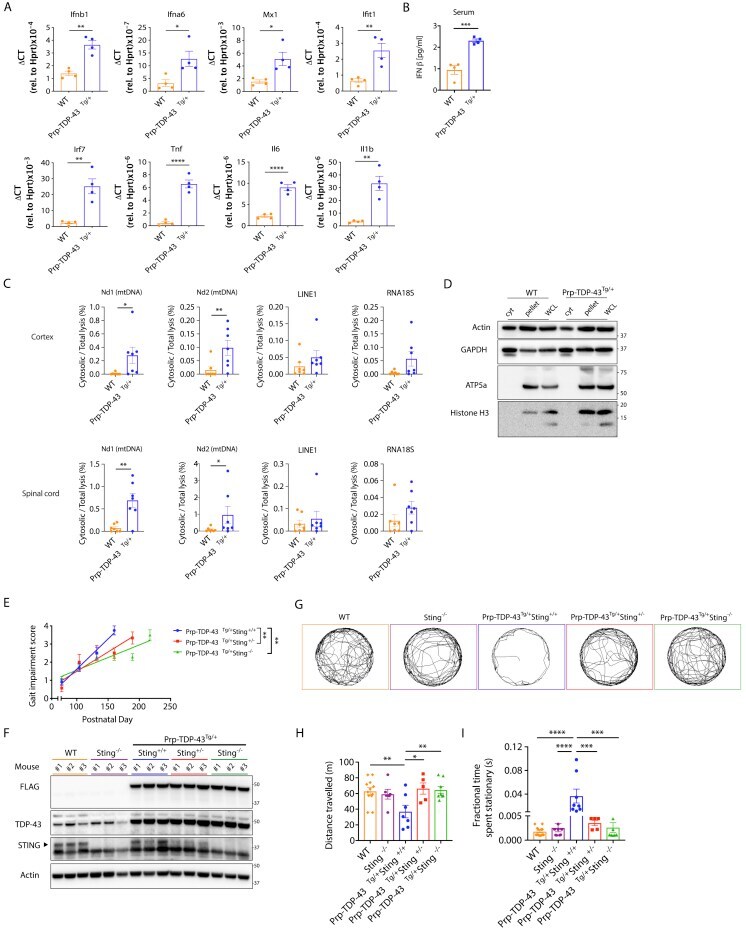
- Figure S5 Disease Incidence and Progression in Prp-TDP-43 Tg/+ Mice, Related to Figure 5 (A) qPCR analysis of type I IFNs ( Ifnb1 and Ifna6 ), interferon-stimulated genes ( Mx1 , Ifit1 and Irf7 ) and NF-kappaB genes ( Tnf , Il6 and Il1b ) are presented for WT and Prp-TDP-43 Tg/+ bone marrow derived macrophages, taken from mice at 150 days of age. The mRNA expression was normalized to Hprt as relative gene expression (mean +- SD from 4 mice per group). (B) Serum IFNbeta from WT and Prp-TDP-43 Tg/+ mice was quantified by ELISA at day 150. (C) Single cell suspensions of cortex and spinal cord from WT and Prp-TDP-43 Tg/+ mice (n = 7, age 120 days) were subjected to subcellular fractionation followed by direct qPCR for mtDNA ( Nd1 and Nd2 ), LINE1 element and ribosome control ( RNA18S ). (D) Representative western blot analysis of single cell suspensions from cortex and spinal cord of WT and Prp-TDP-43 Tg/+ mice, to establish the purity of Digitonin lysis cytosolic fraction (cyt) compared to the pellet and RIPA whole cell lysate (WCL), using the subcellular markers indicated (E) Genetic deletion of Sting significantly mitigates the rate of disease progression after onset (slope of linear regression for gait impairment across lifespan). Data are mean +- SEM with P value s 0.0018 in Prp-TDP-43 Tg/+ Sting +/- and 0.0015 in Prp-TDP-43 Tg/+ Sting -/- when compared to Prp-TDP-43 Tg/+ Sting +/+ . (F) Representative western blot of transgenic FLAG-TDP-43 mutant (A315T), TDP-43, STING and
- Submitted by
- Invitrogen Antibodies (provider)
- Main image
- Experimental details
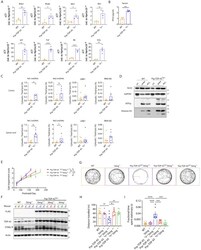
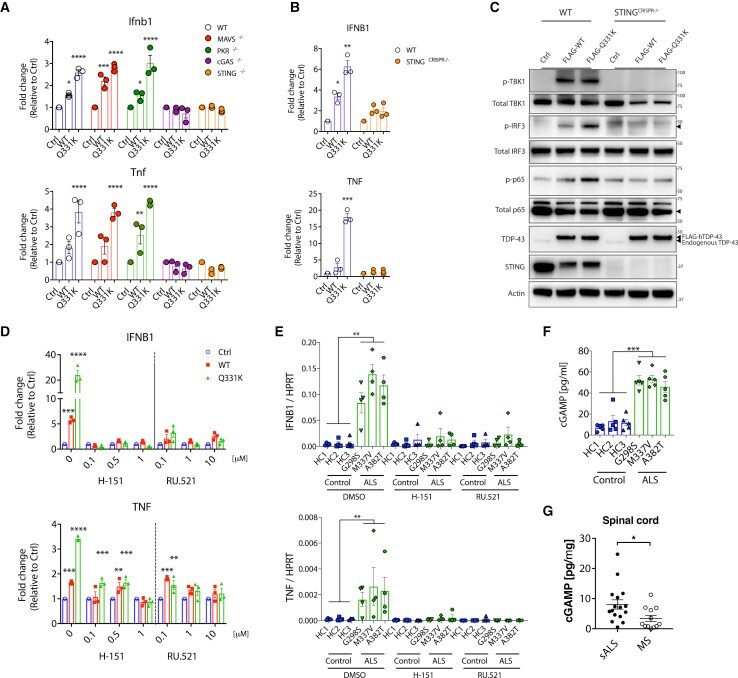
- Figure 1 Inflammatory Signaling from TDP-43 Is Dependent on cGAS/STING (A) Vector alone (Ctrl) or plasmids encoding FLAG-tagged wild-type (WT) TDP-43 and the ALS mutation (Q331K) were transiently overexpressed in mouse embryonic fibroblasts (MEFs) genetically deficient for different innate immune sensors. Expression of Ifnb1 and Tnf was measured by qPCR after 72 h and was ablated only when cGAS or STING were genetically deficient. (B) Inducible TDP-43 constructs (WT or Q331K) were transduced into WT or STING CRISPR knockout (KO) THP-1 cells. 72 h after Dox induction, qPCR for IFNB1 and TNF was performed. (C) TDP-43-overexpressing THP-1 cells as in (B) were subjected to western blot analysis of inflammatory signaling pathways related to type I IFN and NF-kappaB. (D and E) The cGAS inhibitor RU.521 and STING inhibitor H-151 prevent IFNB1 and TNF induction from TDP-43-overexpressing THP-1 cells used in (B) and (E) iPSC-derived motor neurons from ALS patients compared with healthy controls (RU.521, 10 muM; H-151, 1 muM). DMSO was used as a solvent control (0). (F and G) Quantification of cGAMP by ELISA from (F) cell lysates of iPSC-derived motor neurons from healthy controls and ALS patients and from (G) post-mortem spinal cord samples of patients with sporadic ALS (n = 16) or MS (n = 12). Data are mean +- SEM, pooled from 3-5 independent experiments ([A], [B], and [D]-[F]) or representative of 3 independent experiments (C). The p values were calculated using two-way ANOVA to Ctr
- Submitted by
- Invitrogen Antibodies (provider)
- Main image
- Experimental details
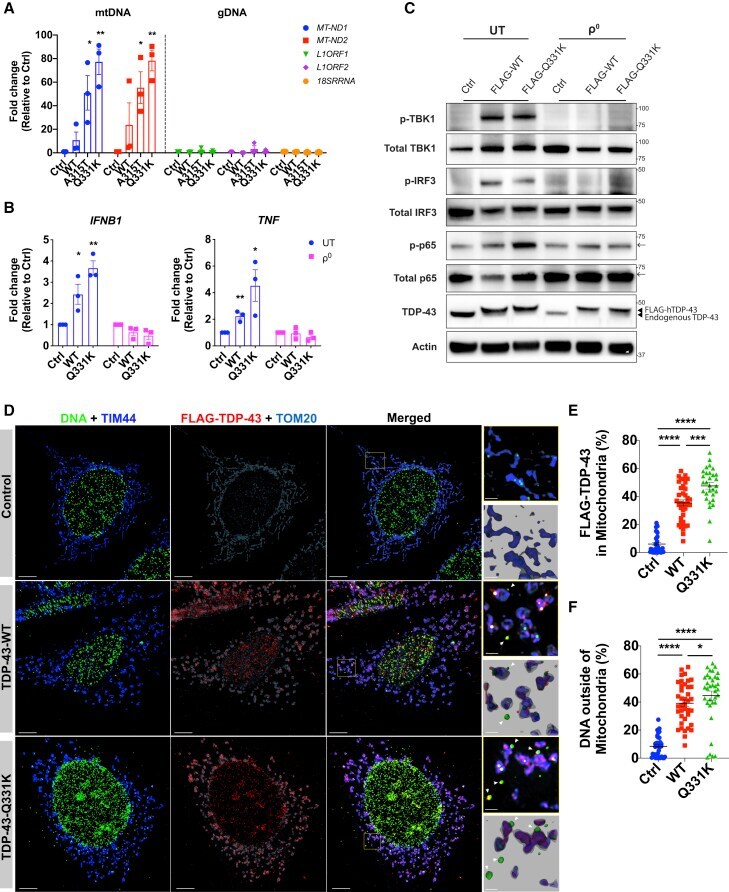
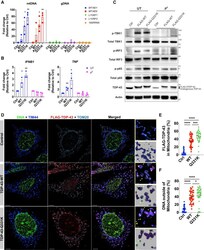
- Figure 2 TDP-43 Causes mtDNA Release into the Cytoplasm (A) TDP-43-EGFP (WT or the ALS mutants A315T and Q331K) and FLAG-cGAS were transiently overexpressed in HEK293T cells, followed by extraction of DNA from FLAG immunoprecipitants. Direct qPCR reveals the presence of mtDNA ( MT-ND1 and MT-ND2 ) but not DNA corresponding to abundant nuclear LINE1 elements ( L1ORF1 and L1ORF2 ) or a ribosomal gene ( RNA18S ) bound to FLAG-cGAS. (B) Human THP-1 cells with inducible TDP-43 (WT or Q331K) were depleted of mtDNA using EtBr (rho 0 ). 72 h after TDP-43 induction, IFNB1 and TNF expression was diminished compared with the untreated (UT) control. (C) TDP-43 overexpressing THP-1 cells as in (B) were subjected to western blot analysis of inflammatory signaling pathways related to type I IFN and NF-kappaB. Arrows indicate a cut in the membrane to facilitate multiple protein probing. See the Key Resources Table for uncropped blots. (D) OMX-SR microscopy reveals that TDP-43 (FLAG-tagged, red) translocates into mitochondria (TIM44, blue; TOM20, cyan) and induces relocation of DNA (anti-DNA, green) into the cytoplasm of TDP-43-overexpressing MEFs (scale bars, 5 mum). Overview images are maximum-intensity projections, and magnified images are 3D surface reconstructions using Imaris software (bottom right) (scale bars, 0.5 mum). See also Video S1 . (E and F) Spatial quantification by Imaris software for (E) the percentage of FLAG-TDP-43 in mitochondria (TIM44) and (F) the percentage of DNA out