Explore
 Validate
 Learn
LearnMA1-35461
antibody from Invitrogen Antibodies
Targeting: GZMB
CCPI, CGL-1, CGL1, CSP-B, CSPB, CTLA1, CTSGL1, HLP, SECT
 Western blot
 Other assay
Antibody data
- Antibody Data
- Antigen structure
- References [6]
- Comments [0]
- Validations
- Other assay [1]
Submit
Validation data
Reference
Comment
Report error
- Product number
- MA1-35461 - Provider product page

- Provider
- Invitrogen Antibodies
- Product name
- Granzyme B Monoclonal Antibody (GrB-7)
- Antibody type
- Monoclonal
- Antigen
- Other
- Description
- The antibody reacts with the 33 kD human serine protease granzyme B. It does not react with human granzyme A. It is used as a marker for NK-cells and activated cytotoxic T-cells (CTL). This protease is localized in cytoplasmic granules and gives a granular staining pattern. Granzyme B is involved in target cell apoptosis during lymphocyte mediated cyto-toxicity. Exocytosis of granzyme containing granules in the cytoplasm of the target cell will lead to induction of DNA fragmentation and apoptosis of the target cell.
- Reactivity
- Human
- Host
- Mouse
- Isotype
- IgG
- Antibody clone number
- GrB-7
- Vial size
- 1 mL
- Concentration
- 100 μg/mL
- Storage
- 4°C
Submitted references Clinical response to nivolumab in an INI1-deficient pediatric chordoma correlates with immunogenic recognition of brachyury.
Spatially resolved analyses link genomic and immune diversity and reveal unfavorable neutrophil activation in melanoma.
Histopathologic-based prognostic factors of colorectal cancers are associated with the state of the local immune reaction.
Biomolecular network reconstruction identifies T-cell homing factors associated with survival in colorectal cancer.
Localization and identification of granzymes A and B-expressing cells in normal human lymphoid tissue and peripheral blood.
Localization and identification of granzymes A and B-expressing cells in normal human lymphoid tissue and peripheral blood.
Williamson LM, Rive CM, Di Francesco D, Titmuss E, Chun HE, Brown SD, Milne K, Pleasance E, Lee AF, Yip S, Rosenbaum DG, Hasselblatt M, Johann PD, Kool M, Harvey M, Dix D, Renouf DJ, Holt RA, Nelson BH, Hirst M, Jones SJM, Laskin J, Rassekh SR, Deyell RJ, Marra MA
NPJ precision oncology 2021 Dec 20;5(1):103
NPJ precision oncology 2021 Dec 20;5(1):103
Spatially resolved analyses link genomic and immune diversity and reveal unfavorable neutrophil activation in melanoma.
Mitra A, Andrews MC, Roh W, De Macedo MP, Hudgens CW, Carapeto F, Singh S, Reuben A, Wang F, Mao X, Song X, Wani K, Tippen S, Ng KS, Schalck A, Sakellariou-Thompson DA, Chen E, Reddy SM, Spencer CN, Wiesnoski D, Little LD, Gumbs C, Cooper ZA, Burton EM, Hwu P, Davies MA, Zhang J, Bernatchez C, Navin N, Sharma P, Allison JP, Wargo JA, Yee C, Tetzlaff MT, Hwu WJ, Lazar AJ, Futreal PA
Nature communications 2020 Apr 15;11(1):1839
Nature communications 2020 Apr 15;11(1):1839
Histopathologic-based prognostic factors of colorectal cancers are associated with the state of the local immune reaction.
Mlecnik B, Tosolini M, Kirilovsky A, Berger A, Bindea G, Meatchi T, Bruneval P, Trajanoski Z, Fridman WH, Pagès F, Galon J
Journal of clinical oncology : official journal of the American Society of Clinical Oncology 2011 Feb 20;29(6):610-8
Journal of clinical oncology : official journal of the American Society of Clinical Oncology 2011 Feb 20;29(6):610-8
Biomolecular network reconstruction identifies T-cell homing factors associated with survival in colorectal cancer.
Mlecnik B, Tosolini M, Charoentong P, Kirilovsky A, Bindea G, Berger A, Camus M, Gillard M, Bruneval P, Fridman WH, Pagès F, Trajanoski Z, Galon J
Gastroenterology 2010 Apr;138(4):1429-40
Gastroenterology 2010 Apr;138(4):1429-40
Localization and identification of granzymes A and B-expressing cells in normal human lymphoid tissue and peripheral blood.
Kummer JA, Kamp AM, Tadema TM, Vos W, Meijer CJ, Hack CE
Clinical and experimental immunology 1995 Apr;100(1):164-72
Clinical and experimental immunology 1995 Apr;100(1):164-72
No comments: Submit comment
Supportive validation
- Submitted by
- Invitrogen Antibodies (provider)
- Main image

- Experimental details
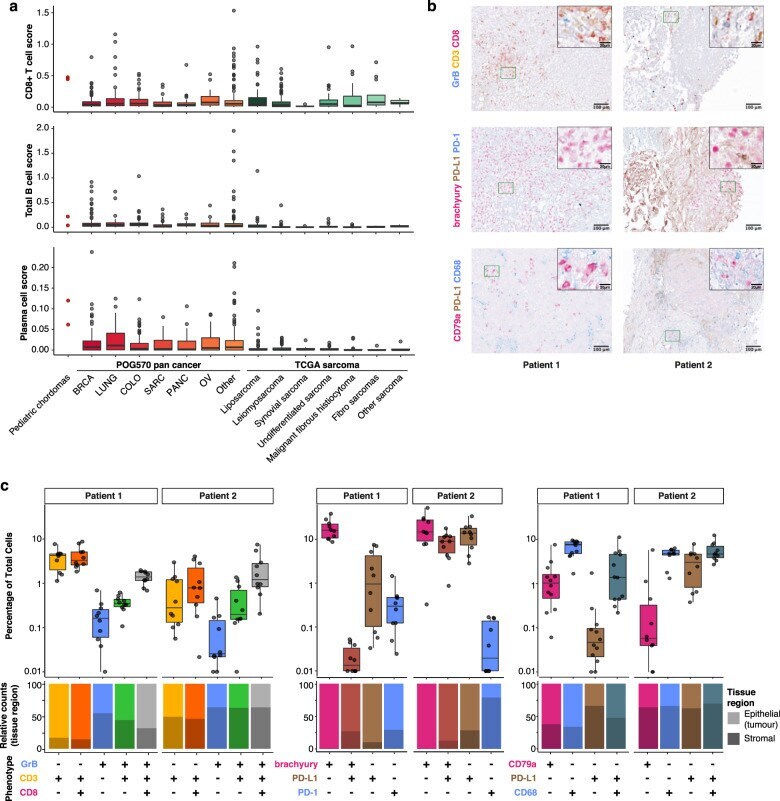
- Fig. 2 Immune microenvironment of poorly differentiated chordomas. a CIBERSORT estimation of CD8+ T cell, B cell and plasma cell abundance from bulk paediatric chordoma RNA sequencing data in paediatric chordomas, POG570 adult cancers and the TCGA sarcoma data set . CD8+ T cell score (top panel) for patient 1 was 0.44 and for patient 2, 0.48 compared to the other cancer types, i.e. POG570 pan cancer adult solid tumours median score = 0.05 (BRCA, n = 144; LUNG, n = 67; COLO, n = 87; SARC, n = 47; PANC, n = 42; OV, n = 28; other, n = 155), TCGA sarcoma median score = 0.04 ( n = 255). Similarly, B cell scores (middle panel) for patient 1 = 0.04, patient 2 = 0.22, POG570 median score = 0.04, TCGA sarcoma median score = 0.01. Plasma cell scores (bottom panel) for patient 1 = 0.06, patient 2 = 0.12, POG570 median score = 0.01, TCGA sarcoma median score = 0.00. b Example x20 images of multiplex IHC staining with granzyme B (GrB)/CD3/CD8, brachyury/PD-L1/PD-1 and CD79a/PD-L1/CD68 panels. c Percentage of cells stained with the respective antibodies from paediatric chordoma patients 1 and 2. Individual points represent the respective cellular fraction for each population measured from independent images ( n >= 10) taken from different locations of the slide for each patient sample. The relative proportion of either epithelium- or stroma-associated cells for each cellular population is displayed in the bottom panel. Box plots in a , c represent median, upper and lower quartiles, and whi