Explore
 Validate
 Learn
Learn Western blot
 Immunohistochemistry
Antibody data
- Antibody Data
- Antigen structure
- References [2]
- Comments [0]
- Validations
- Immunohistochemistry [1]
- Other assay [2]
Submit
Validation data
Reference
Comment
Report error
- Product number
- PA5-27298 - Provider product page

- Provider
- Invitrogen Antibodies
- Product name
- Amphiregulin Polyclonal Antibody
- Antibody type
- Polyclonal
- Antigen
- Recombinant full-length protein
- Description
- Recommended positive controls: AREG-transfected 293T. Store product as a concentrated solution. Centrifuge briefly prior to opening the vial.
- Reactivity
- Human
- Host
- Rabbit
- Isotype
- IgG
- Vial size
- 100 μL
- Concentration
- 0.17 mg/mL
- Storage
- Store at 4°C short term. For long term storage, store at -20°C, avoiding freeze/thaw cycles.
Submitted references In mouse chronic pancreatitis CD25(+)FOXP3(+) regulatory T cells control pancreatic fibrosis by suppression of the type 2 immune response.
Amphiregulin activates human hepatic stellate cells and is upregulated in non alcoholic steatohepatitis.
Glaubitz J, Wilden A, Golchert J, Homuth G, Völker U, Bröker BM, Thiele T, Lerch MM, Mayerle J, Aghdassi AA, Weiss FU, Sendler M
Nature communications 2022 Aug 3;13(1):4502
Nature communications 2022 Aug 3;13(1):4502
Amphiregulin activates human hepatic stellate cells and is upregulated in non alcoholic steatohepatitis.
McKee C, Sigala B, Soeda J, Mouralidarane A, Morgan M, Mazzoccoli G, Rappa F, Cappello F, Cabibi D, Pazienza V, Selden C, Roskams T, Vinciguerra M, Oben JA
Scientific reports 2015 Mar 6;5:8812
Scientific reports 2015 Mar 6;5:8812
No comments: Submit comment
Supportive validation
- Submitted by
- Invitrogen Antibodies (provider)
- Main image

- Experimental details
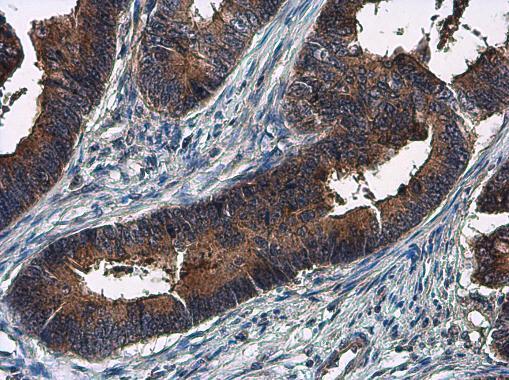
- Immunohistochemistry (Paraffin) analysis of Amphiregulin was performed in paraffin-embedded human colon cancer tissue using Amphiregulin Polyclonal Antibody (Product # PA5-27298) at a dilution of 1:500.
Supportive validation
- Submitted by
- Invitrogen Antibodies (provider)
- Main image
- Experimental details
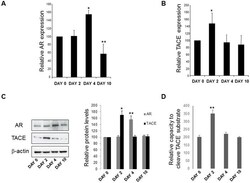
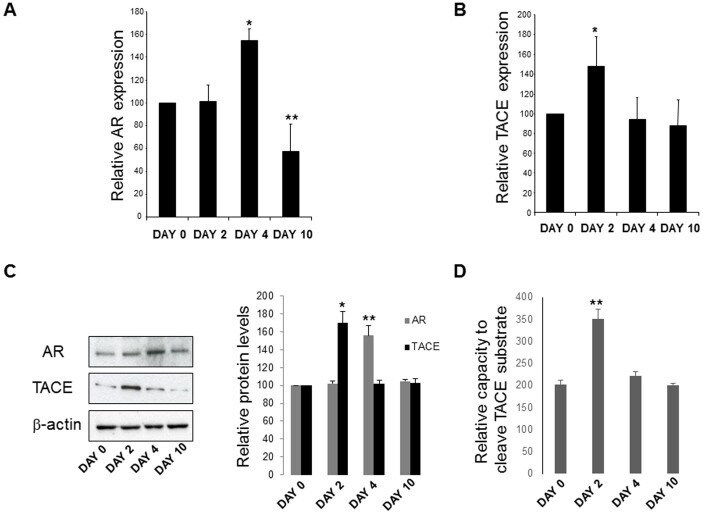
- Figure 1 AR mRNA expression in hHSC. (A) Cultures of hHSC show significantly higher expression (* p < 0.05) of AR by day 4 compared to day 0. Expression is effectively reduced by day 10 (** p < 0.01). (B) AR mRNA expression is preceded by the up-regulation of the TACE gene, required for AR activity. TACE expression is highest at day 2 (*p < 0.05) and is reduced by day 4 (**p < 0.01). (C) Western blot analysis for AR and TACE protein levels in hHSC at day 0, 2, 4 and 10 (left panel); images were obtained from separate gels, run under the same experimental conditions, blotted on separate PVDF membranes and processed for detection with the respective antibodies. Densitometric quantification normalized to beta-actin levels (right panel). Images are representative of three independent experiments (* p < 0.05; ** p < 0.01). (D) TACE activities in hHSC at day 0, 2, 4 and 10 were measured using SensoLyte 520 TACE Activity Assay kit. N = 3, ** p < 0.01.
- Submitted by
- Invitrogen Antibodies (provider)
- Main image

- Experimental details
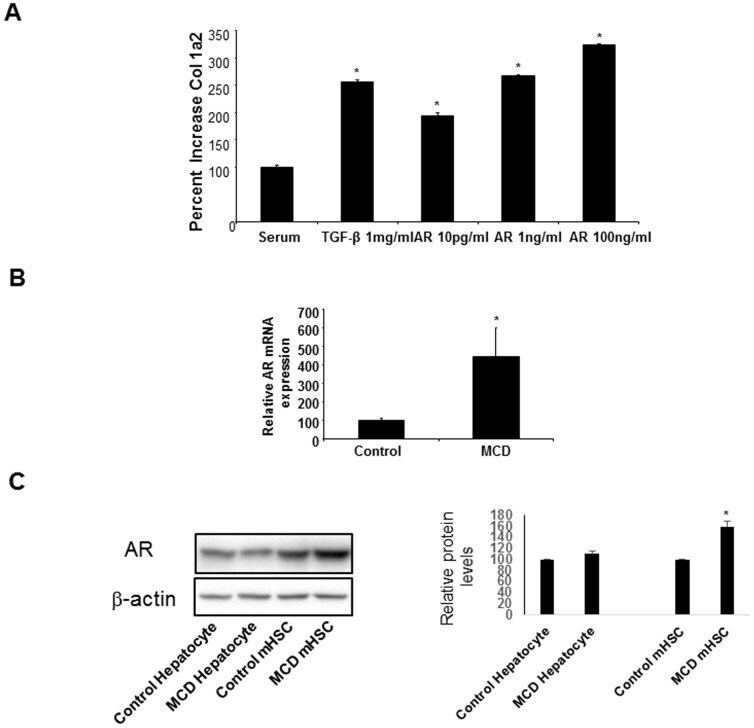
- Figure 5 Effect of AR on collagen 1a2 production. (A) AR is capable of inducing collagen production at both picogram and nanogram concentrations (*p < 0.05). The effect is similar to that of TGF-beta, inductor of collagen production, a major step in the pathogenesis of fibrosis. (B) Mice were fed either a normal chow diet or a methionine-choline deficient (MCD) diet modelling NASH. Mice on MCD diet expressed higher hepatic AR mRNA levels than mice fed a normal chow diet (*p < 0.001). (C) Western blot analysis for AR protein levels in hepatocytes and mHSC isolated from MCD mice (left panel). Images were obtained from separate gels, run under the same experimental conditions, blotted on separate PVDF membranes and processed for detection with the respective antibodies. Densitometric quantification normalized to beta-actin levels (right panel). Images are representative of three independent experiments (* p < 0.05).