Explore
 Validate
 Learn
Learn Western blot
Antibody data
- Antibody Data
- Antigen structure
- References [2]
- Comments [0]
- Validations
- Western blot [1]
- Immunocytochemistry [1]
- Other assay [2]
Submit
Validation data
Reference
Comment
Report error
- Product number
- 710184 - Provider product page

- Provider
- Invitrogen Antibodies
- Product name
- Pannexin 1 Recombinant Superclonal™ Antibody (11HCLC)
- Antibody type
- Other
- Antigen
- Synthetic peptide
- Description
- Recombinant rabbit Superclonal™ antibodies are unique offerings from Thermo Fisher Scientific. They are comprised of a selection of multiple different recombinant monoclonal antibodies, providing the best of both worlds - the sensitivity of polyclonal antibodies with the specificity of monoclonal antibodies - all delivered with the consistency only found in a recombinant antibody. While functionally the same as a polyclonal antibody - recognizing multiple epitope sites on the target and producing higher detection sensitivity for low abundance targets - a recombinant rabbit Superclonal™ antibody has a known mixture of light and heavy chains. The exact population can be produced in every lot, circumventing the biological variability typically associated with polyclonal antibody production. Note: Formerly called “Recombinant polyclonal antibody”, this product is now rebranded as “Recombinant Superclonal™ antibody”. The physical product and the performance remain unchanged.
- Reactivity
- Human
- Host
- Rabbit
- Isotype
- IgG
- Antibody clone number
- 11HCLC
- Vial size
- 100 μg
- Concentration
- 0.5 mg/mL
- Storage
- Store at 4°C short term. For long term storage, store at -20°C, avoiding freeze/thaw cycles.
Submitted references Pannexin1 Is Associated with Enhanced Epithelial-To-Mesenchymal Transition in Human Patient Breast Cancer Tissues and in Breast Cancer Cell Lines.
Primary tumor- and metastasis-derived colon cancer cells differently modulate connexin expression and function in human capillary endothelial cells.
Jalaleddine N, El-Hajjar L, Dakik H, Shaito A, Saliba J, Safi R, Zibara K, El-Sabban M
Cancers 2019 Dec 7;11(12)
Cancers 2019 Dec 7;11(12)
Primary tumor- and metastasis-derived colon cancer cells differently modulate connexin expression and function in human capillary endothelial cells.
Thuringer D, Berthenet K, Cronier L, Solary E, Garrido C
Oncotarget 2015 Oct 6;6(30):28800-15
Oncotarget 2015 Oct 6;6(30):28800-15
No comments: Submit comment
Supportive validation
- Submitted by
- Invitrogen Antibodies (provider)
- Main image
- Experimental details
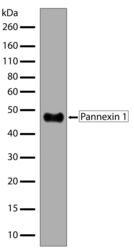
- Western blot analysis of PANX1 in whole cell extracts of MCF-7 using a PANX1 Recombinant Rabbit Superclonal™ Antibody (Product # 710184) at a dilution of 2 µg/mL. Samples were detected using chemiluminescence (ECL). Results show a band at ~48kDa.

Supportive validation
- Submitted by
- Invitrogen Antibodies (provider)
- Main image
- Experimental details
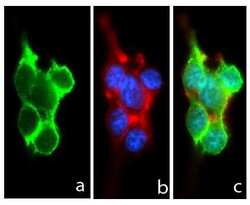
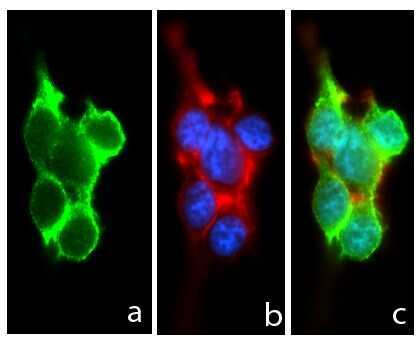
- Immunofluorescent analysis of Pannexin-1 in HEK293 cells using a Pannexin-1 Recombinant Rabbit Superclonal™ Antibody (Product # 710184) followed by detection using an Alexa Fluor 488-conjugated Goat anti-Rabbit secondary antibody (green) (Image A). b: Image of DAPI stained nucleus (blue) and Alexa Fluor 594 phalloidin stained actin (red) c: Composite image of cells showing cell-membrane and junction localization of Pannexin 1.
Supportive validation
- Submitted by
- Invitrogen Antibodies (provider)
- Main image

- Experimental details
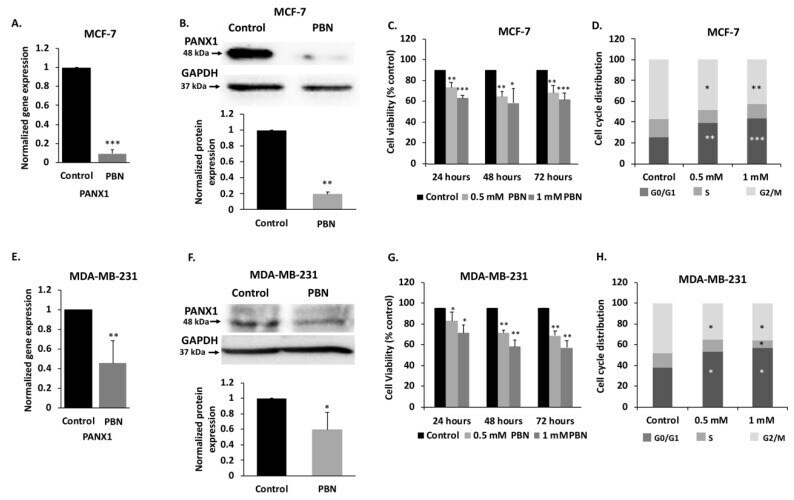
- Figure 3 PANX1 channel permeability inhibition reduces cell viability and induces cell cycle arrest in MDA-MB-231 and MCF-7 breast cancer cell lines. ( A ) mRNA levels of PANX1 in MCF-7 cells. qRT-PCR of PANX1, normalized to glyceraldehyde-3-phosphate dehydrogenase GAPDH, in cells treated with 1 mM PBN for 72 h. ( B ) Analysis of PANX1 protein levels using Western blotting in MCF-7 cells treated with 1 mM PBN for 72 h. Lower panel is a densitometry quantification of the PANX1 and GAPDH bands using Image Lab software. Values represent the average fold change in PANX1 expression, normalized to GAPDH, and relative to control, for a total of three Western blots. ( C ) Cell viability of MCF-7 cells treated with PBN was assessed by trypan blue dye exclusion assay. Cells were treated with 0.5 or 1 mM PBN for 24, 48 or 72 h. Average cell viability of three independent experiments is displayed as percentage of control (Details of whole blot can be found at Figure S3 and Table S1 ). ( D ) Cell cycle distribution analysis was performed by flow cytometry for MCF-7 cells treated with 0.5 mM and 1 mM PBN for 72 h and stained with propidium iodide for cell cycle analysis. Histogram displays averages from three independent experiments. ( E , F ) Same as panels A and B, but for MDA-MB-231 cells treated with 1 mM PBN for 72 h. ( G ) Same as (C) but for MDA-MB-231 cells treated with 0.5 or 1 mM PBN for 24, 48 or 72 h. ( H ) Same as in (D) but MDA-MB-231 cells were used instead. Control denotes
- Submitted by
- Invitrogen Antibodies (provider)
- Main image
- Experimental details
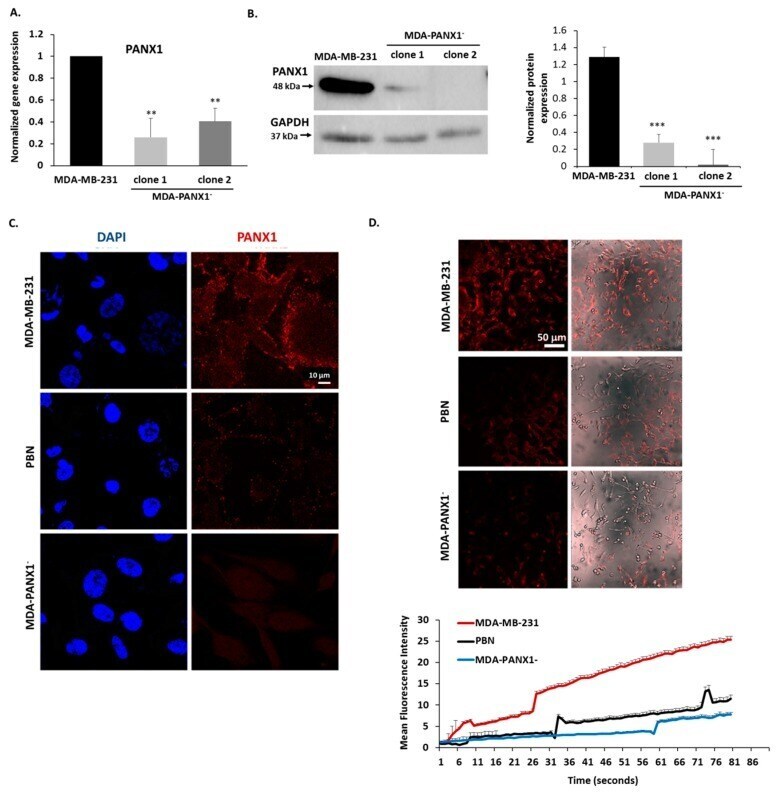
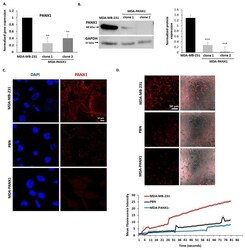
- Figure 4 Inhibition of PANX1 channel or genetic ablation of PANX1 gene abrogate ethidium bromide (EtBr) dye uptake by PANX1 channels. ( A ) PANX1 gene was knocked out in MDA-MB-231 cells using CRISPR/Cas9 gene editing. The bar graph shows qRT-PCR results of the mRNA levels of PANX1, normalized to GAPDH, in parental MDA-MB-231 cells and in CRISPR/Cas9 PANX1 knocked-out MDA-MB-231 cells (MDA-PANX1 - ; clone1 and clone 2 cells). ( B ) Representative Western Blot of PANX1 protein levels in parental MDA-MB-231 cells and in MDA-PANX1 - cells (MDA-PANX1 - ; clone1 and clone 2 cells). Lower panel is a densitometry quantification of the PANX1 and GAPDH bands using Image Lab software. Values represent the average fold change of PANX1 expression normalized to GAPDH. ( C ) Immunofluorescence images of PANX1 immunostaining in MDA-PANX1 - or MDA-MB-231 cells treated with 1 mM PBN for 72 h. Micrographs are representative of three independent experiments. ( D ) Representative fluorescence micrographs of parental untreated MDA-MB-231 cells, MDA-PANX1 - or MDA-MB-231 cells treated with 1 mM PBN showing EtBr uptake and mean fluorescence intensity (MFI). Cells, pre-treated with 1 mM PBN for 15 m, were incubated in 25 muM EtBr in low divalent physiological solution. EtBr uptake was monitored by live imaging at 37 degC, for 15 m and images were acquired at 10-second intervals. The MFI of 5 different fields in each micrograph was used to quantify overall fluorescence. Data are displayed as EtBr MFI