Explore
 Validate
 Learn
LearnPA5-20442
antibody from Invitrogen Antibodies
Targeting: ADGRA2
DKFZp434C211, DKFZp434J0911, FLJ14390, GPR124, KIAA1531, TEM5
 Western blot
Antibody data
- Antibody Data
- Antigen structure
- References [1]
- Comments [0]
- Validations
- Western blot [1]
- Immunocytochemistry [1]
- Immunohistochemistry [3]
- Other assay [3]
Submit
Validation data
Reference
Comment
Report error
- Product number
- PA5-20442 - Provider product page

- Provider
- Invitrogen Antibodies
- Product name
- TEM5 Polyclonal Antibody
- Antibody type
- Polyclonal
- Antigen
- Synthetic peptide
- Description
- A suggested positive control is rat kidney tissue lysate. PA5-20442 can be used with blocking peptide PEP-0559. Predicted species reactivity based on immunogen sequence: Mouse: (85%).
- Reactivity
- Human, Rat
- Host
- Rabbit
- Isotype
- IgG
- Vial size
- 100 μg
- Concentration
- 1 mg/mL
- Storage
- 4°C
Submitted references GPR124 facilitates pericyte polarization and migration by regulating the formation of filopodia during ischemic injury.
Chen DY, Sun NH, Lu YP, Hong LJ, Cui TT, Wang CK, Chen XH, Wang SS, Feng LL, Shi WX, Fukunaga K, Chen Z, Lu YM, Han F
Theranostics 2019;9(20):5937-5955
Theranostics 2019;9(20):5937-5955
No comments: Submit comment
Supportive validation
- Submitted by
- Invitrogen Antibodies (provider)
- Main image
- Experimental details
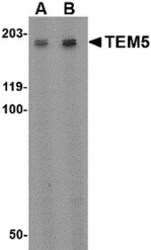
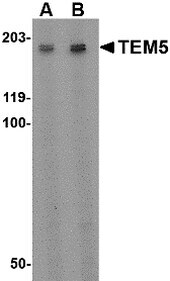
- Western Blot analysis of TEM5 in rat kidney tissue lysate with TEM5 Polyclonal Antibody (Product # PA5-20442) at (A) 2 µg/mL and (B) 4 µg/mL.
Supportive validation
- Submitted by
- Invitrogen Antibodies (provider)
- Main image
- Experimental details
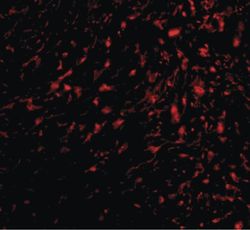
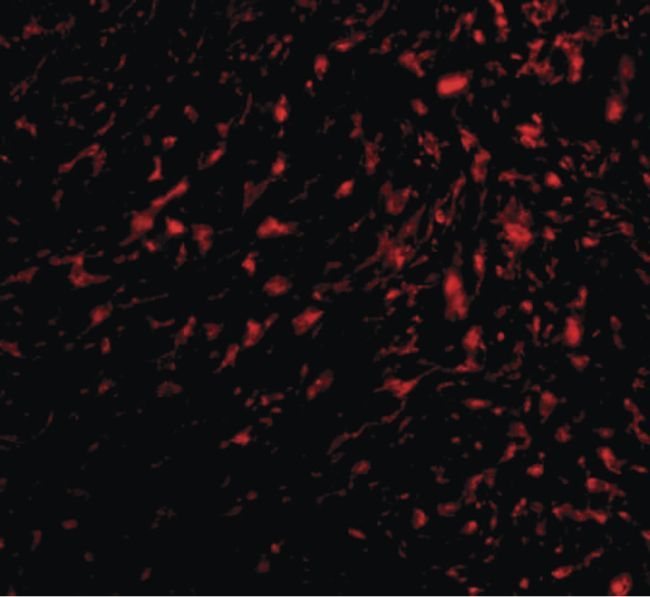
- Immunofluorescent analysis of human bladder tissue using a TEM5 polyclonal antibody (Product # PA5-20442) at a 20 µg/mL dilution.
Supportive validation
- Submitted by
- Invitrogen Antibodies (provider)
- Main image
- Experimental details
- Immunofluorescence of TEM5 in human bladder tissue with TEM5 Polyclonal Antibody (Product # PA5-20442) at 20 µg/mL.

- Submitted by
- Invitrogen Antibodies (provider)
- Main image
- Experimental details
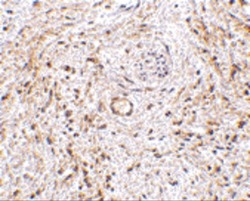
- Immunohistochemistry of TEM5 in human bladder tissue with TEM5 Polyclonal Antibody (Product # PA5-20442) at 5 µg/mL.

- Submitted by
- Invitrogen Antibodies (provider)
- Main image
- Experimental details
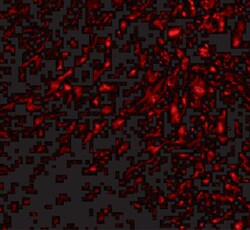
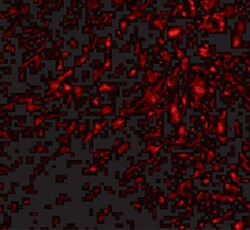
- Immunofluorescence of TEM5 in human bladder tissue with TEM5 Polyclonal Antibody (Product # PA5-20442) at 20 µg/mL.
Supportive validation
- Submitted by
- Invitrogen Antibodies (provider)
- Main image
- Experimental details
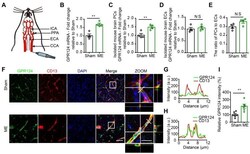
- Figure 1 Changes in GPR124 expression after ME induction in the brain. (A) Schematic representation of the microsphere embolism (ME) model. (B-D) Real-time PCR analysis of GPR124 mRNA expression in the cortical areas of the ipsilateral hemisphere ( B ), isolated primary mouse pericytes ( C ) and endothelial cells ( D ) from Sham and ME mice. The cortical areas of the ipsilateral hemisphere were dissected from mice at 72 h after injection of microspheres. Sham: n = 4; ME: n = 4. (E) Real-time PCR analysis of CD13 and CD31 mRNA expression in the cortical areas of Sham and ME mice, indicating the ratio of pericytes to endothelial cells. Sham: n = 4; ME: n = 4. ( F ) Maximum intensity projections of confocal images from brain sections stained for GPR124 (green), CD13 (red) and DAPI (blue, nuclei) at 72 h following ME. The images on the right are magnifications of the boxed regions in the images directly to their left. Scale bar: 50 mum, magnified images, 20 mum. ( G, H ) Plots of the fluorescence intensity in arbitrary units (AU) along the solid lines indicated in the high-magnification images in F for Sham ( G ) and ME ( H ), respectively. ( I ) Signal intensities of GPR124 staining quantified from F (dot plot, Sham: n = 6; ME: n = 6). *P < 0.05, and **P < 0.01 vs. Sham. The data are presented as the mean +- s.e.m. Statistical significance was determined by unpaired Student's t-test. NS, not statistically significant.
- Submitted by
- Invitrogen Antibodies (provider)
- Main image
- Experimental details
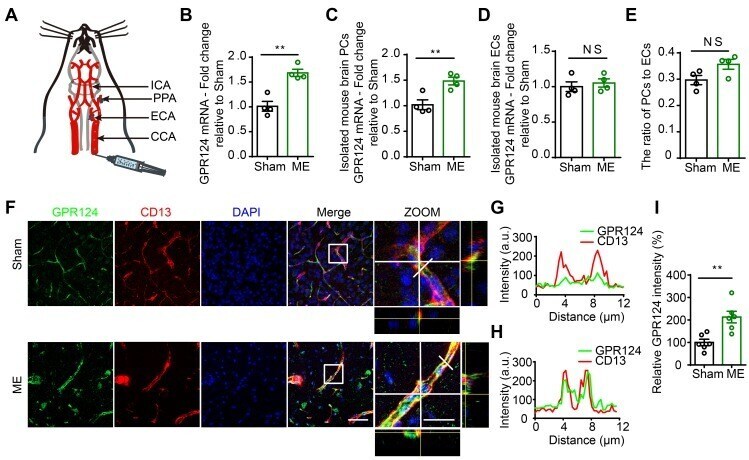
- Figure 2 GPR124 expression in focal adhesions in HBVPs. ( A, B ) Maximum intensity projections of confocal images from HBVPs stained for GPR124 (green), Vinculin (red, A ), Paxillin (red, B ), Phalloidin (magenta) and DAPI (blue, nuclei). The images on the right panel are magnifications of the boxed regions in the images. Scale bar: 40 mum (Left), magnified images, 5 mum. Representative stainings from three independent experiments are shown. ( C, D ) Isolated focal adhesions include the same proteins as focal adhesions found in intact HBVPs. Confocal fluorescence microscopy images of immunostained isolated focal adhesions demonstrating the presence of GPR124 (green), Vinculin (red, C ) and Paxillin (red, D ). Scale bar: 40 mum (Left), magnified images, 5 mum. ( E ) The localization of GPR124 and F-actin in HBVPs was observed by STORM. Note that there is a close interaction between GPR124 and the F-actin terminals. Scale bar: 10 mum. ( F ) Maximum intensity projections of confocal images from primary mouse brain pericytes stained for GPR124 (green), PDGF-beta (red), Phalloidin (magenta) and DAPI (blue, nuclei). The images on the right panel are magnifications of the boxed regions in the images. Scale bar: 40 mum (Left), magnified images, 5 mum. ( G, H ) Western blot comparison of protein concentration in total cell lysate (T), isolated focal adhesion fractions (F) and cell body fractions (C). Equal total protein was loaded in each lane. The ratio shown on the lower (F/C) indic

- Submitted by
- Invitrogen Antibodies (provider)
- Main image
- Experimental details
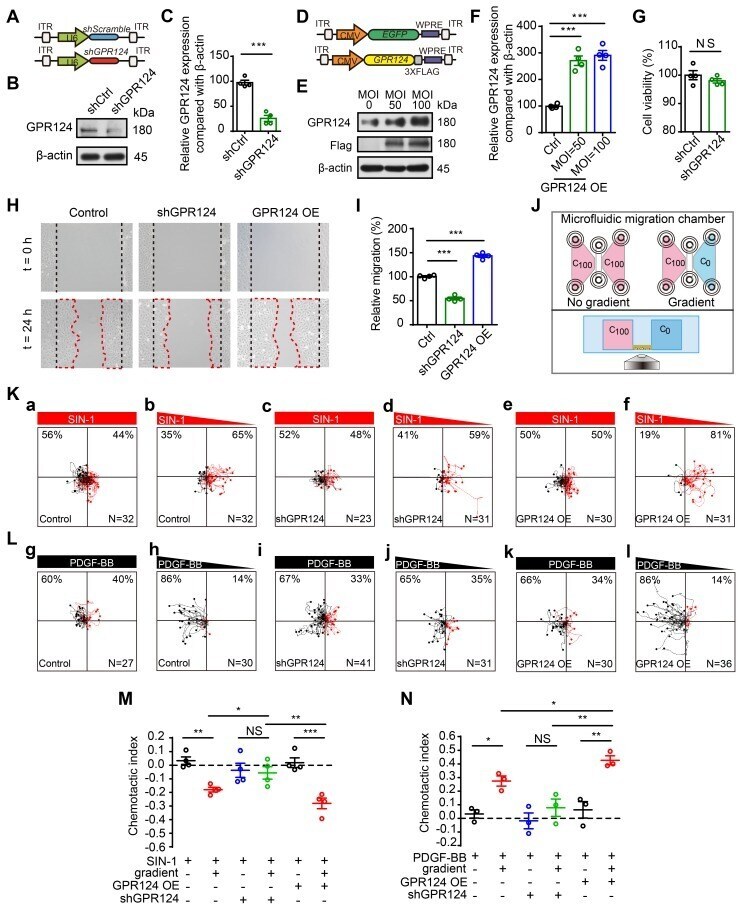
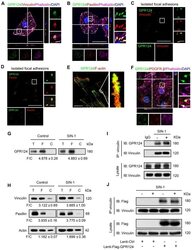
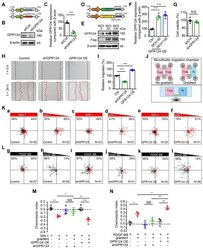
- Figure 4 GPR124-dependent signaling controls pericyte migration. ( A ) Diagram of the knockdown system. ( B ) Immunoblot analysis of GPR124 protein level in control HBVPs and in HBVPs transduced with a lentivirus expressing an shRNA to silence endogenous GPR124. ( C ) Quantitative analyses of the results as shown in ( B ) and presented in the bar graph as the densitometry ratio of the control from four independent experiments. ( D ) Diagram of the overexpression system. ( E ) Immunoblot analysis of GPR124 proteins in HBVPs transfected with either control or gene construct encoding GPR124 (FLAG-GPR124, MOI = 50 and 100) to confirm overexpression of GPR124. ( F ) Quantitative analyses of the results as shown in ( E ) and presented in the bar graph as the densitometry ratio of the control from four independent experiments. ( G ) Cell viability was measured by the CCK8 assay in Ctrl-HBVPs and shGPR124-HBVP (n = 4). (H) Representative images of control HBVPs (control), shGPR124 HBVPs (shGPR124) and GPR124-overexpressing HBVPs (GPR124 OE) at the beginning (t = 0 h) and end (t = 24 h) of the wound healing assay. The dashed lines (black) indicate the edges of the wound immediately after scratch. The dashed lines (red) outline the area of cell migration. (I) Quantification of relative migration in a wound healing assay after 24 h (normalized to control values; n = 4 in each group). (J) Schematic representation of the microfluidic migration chamber used for observing the chemotactic re