Explore
 Validate
 Learn
Learn Western blot
 Immunocytochemistry
Antibody data
- Antibody Data
- Antigen structure
- References [6]
- Comments [0]
- Validations
- Immunocytochemistry [3]
- Immunoprecipitation [1]
- Other assay [10]
Submit
Validation data
Reference
Comment
Report error
- Product number
- PA5-28802 - Provider product page

- Provider
- Invitrogen Antibodies
- Product name
- HES1 Polyclonal Antibody
- Antibody type
- Polyclonal
- Antigen
- Synthetic peptide
- Description
- Recommended positive controls: 293T, A431, H1299, HeLaS3, HepG2, Molt-4, Raji, mouse kidney, PC-12. Predicted reactivity: Mouse (100%), Rat (100%), Pig (100%), Bovine (100%). Store product as a concentrated solution. Centrifuge briefly prior to opening the vial.
- Reactivity
- Human, Mouse, Rat
- Host
- Rabbit
- Isotype
- IgG
- Vial size
- 100 μL
- Concentration
- 1.18 mg/mL
- Storage
- Store at 4°C short term. For long term storage, store at -20°C, avoiding freeze/thaw cycles.
Submitted references Genetic alterations of Keap1 confers chemotherapeutic resistance through functional activation of Nrf2 and Notch pathway in head and neck squamous cell carcinoma.
Downregulation of neurodevelopmental gene expression in iPSC-derived cerebral organoids upon infection by human cytomegalovirus.
Aberrant expression of semaphorin 6B affects cell phenotypes in thyroid carcinoma by activating the Notch signalling pathway.
Pleiotropic Roles of NOTCH1 Signaling in the Loss of Maturational Arrest of Human Osteoarthritic Chondrocytes.
Crosstalk between Androgen-ZIP9 Signaling and Notch Pathway in Rodent Sertoli Cells.
Disruption of androgen signaling during puberty affects Notch pathway in rat seminiferous epithelium.
Islam SS, Qassem K, Islam S, Parag RR, Rahman MZ, Farhat WA, Yeger H, Aboussekhra A, Karakas B, Noman ASM
Cell death & disease 2022 Aug 9;13(8):696
Cell death & disease 2022 Aug 9;13(8):696
Downregulation of neurodevelopmental gene expression in iPSC-derived cerebral organoids upon infection by human cytomegalovirus.
O'Brien BS, Mokry RL, Schumacher ML, Pulakanti K, Rao S, Terhune SS, Ebert AD
iScience 2022 Apr 15;25(4):104098
iScience 2022 Apr 15;25(4):104098
Aberrant expression of semaphorin 6B affects cell phenotypes in thyroid carcinoma by activating the Notch signalling pathway.
Lv XJ, Chen X, Wang Y, Yu S, Pang L, Huang C
Endokrynologia Polska 2021;72(1):29-36
Endokrynologia Polska 2021;72(1):29-36
Pleiotropic Roles of NOTCH1 Signaling in the Loss of Maturational Arrest of Human Osteoarthritic Chondrocytes.
Minguzzi M, Panichi V, D'Adamo S, Cetrullo S, Cattini L, Flamigni F, Mariani E, Borzì RM
International journal of molecular sciences 2021 Nov 5;22(21)
International journal of molecular sciences 2021 Nov 5;22(21)
Crosstalk between Androgen-ZIP9 Signaling and Notch Pathway in Rodent Sertoli Cells.
Kamińska A, Marek S, Pardyak L, Brzoskwinia M, Bilinska B, Hejmej A
International journal of molecular sciences 2020 Nov 5;21(21)
International journal of molecular sciences 2020 Nov 5;21(21)
Disruption of androgen signaling during puberty affects Notch pathway in rat seminiferous epithelium.
Kamińska A, Marek S, Pardyak L, Brzoskwinia M, Pawlicki P, Bilińska B, Hejmej A
Reproductive biology and endocrinology : RB&E 2020 Apr 16;18(1):30
Reproductive biology and endocrinology : RB&E 2020 Apr 16;18(1):30
No comments: Submit comment
Supportive validation
- Submitted by
- Invitrogen Antibodies (provider)
- Main image
- Experimental details
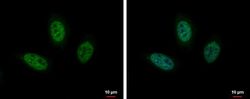
- Immunofluorescent analysis of HES1 showing staining in the nucleus of HeLa cells. HeLa cells were fixed in 4% paraformaldehyde at RT for 15 min and stained using a HES1 polyclonal antibody (Product # PA5-28802) diluted at 1:1000. Blue: Hoechst 33342 staining.
- Submitted by
- Invitrogen Antibodies (provider)
- Main image

- Experimental details
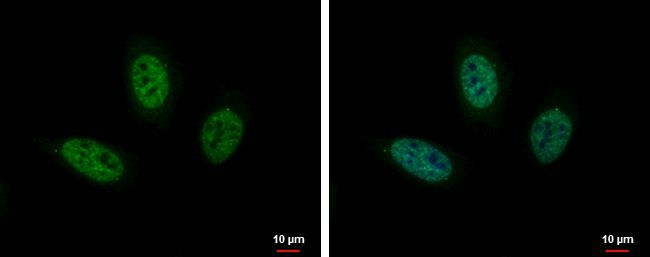
- Immunocytochemistry-Immunofluorescence analysis of HES1 was performed in HeLa cells fixed in 4% paraformaldehyde at RT for 15 min. Green: HES1 Polyclonal Antibody (Product # PA5-28802) diluted at 1:2000. Red: alpha Tubulin, a cytoskeleton marker. Blue: Hoechst 33342 staining.

- Submitted by
- Invitrogen Antibodies (provider)
- Main image

- Experimental details
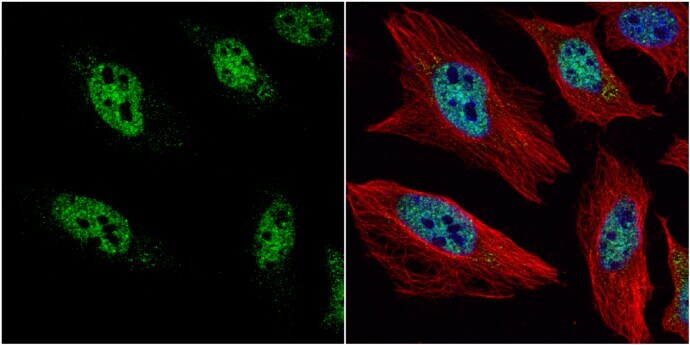
- Immunocytochemistry-Immunofluorescence analysis of HES1 was performed in HeLa cells fixed in 4% paraformaldehyde at RT for 15 min. Green: HES1 Polyclonal Antibody (Product # PA5-28802) diluted at 1:2000. Red: alpha Tubulin, a cytoskeleton marker. Blue: Hoechst 33342 staining.
Supportive validation
- Submitted by
- Invitrogen Antibodies (provider)
- Main image

- Experimental details
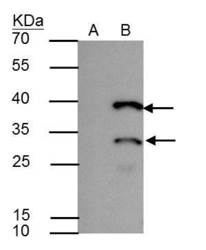
- HES1 antibody immunoprecipitates HES1 protein in IP experiments. IP Sample: A431 whole cell lysate/extract A : Control with 2.5 µg of pre-immune rabbit IgG B : Immunoprecipitation of HES1 by 2.5 µg of HES1 antibody (Product # PA5-28802) 12% SDS-PAGE The immunoprecipitated HES1 protein was detected by HES1 antibody (Product # PA5-28802) diluted at 1:1,000. Anti-rabbit IgG (HRP) was used as a secondary reagent.

Supportive validation
- Submitted by
- Invitrogen Antibodies (provider)
- Main image
- Experimental details
- HES1 antibody immunoprecipitates HES1 protein in IP experiments. IP Sample: A431 whole cell lysate/extract A : Control with 2.5 µg of pre-immune rabbit IgG B : Immunoprecipitation of HES1 by 2.5 µg of HES1 antibody (Product # PA5-28802) 12% SDS-PAGE The immunoprecipitated HES1 protein was detected by HES1 antibody (Product # PA5-28802) diluted at 1:1,000. Anti-rabbit IgG (HRP) was used as a secondary reagent.

- Submitted by
- Invitrogen Antibodies (provider)
- Main image
- Experimental details
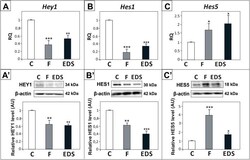
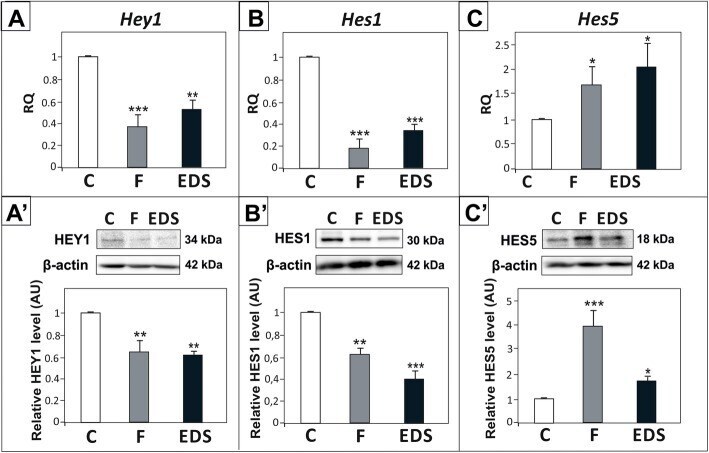
- Fig. 6 Effect of flutamide (F) and EDS on Hey1 , Hes1 , and Hes5 expression in rat testis. (A - C) Relative expression of Hey1, Hes1, and Hes5 mRNAs was determined using real-time RT-PCR analysis. The histograms are the quantitative representation of data of three independent analyses, each in triplicate ( n = 6 each group). The expression values of the individual genes were normalized to the mean expression of the reference genes ( Rn18s , B2m and Actb ) as an internal control. Relative quantification (RQ) is expressed as mean +- SD. Significant differences from control values are denoted as ** p < 0.01 and *** p < 0.001. (A'- C') Relative protein expression of HEY1, HES1 and HES5 was determined using western blot. The histograms are the quantitative representation after densitometry of data (mean +- SD) of three independent analyses ( n = 6 each group). The relative level of studied protein was normalized against its corresponding actin data point. The protein levels within the control group were arbitrarily set at 1. Significant differences from control values are denoted as * p < 0.05, ** p < 0.01, and *** p < 0.001
- Submitted by
- Invitrogen Antibodies (provider)
- Main image
- Experimental details
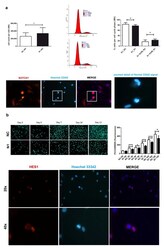
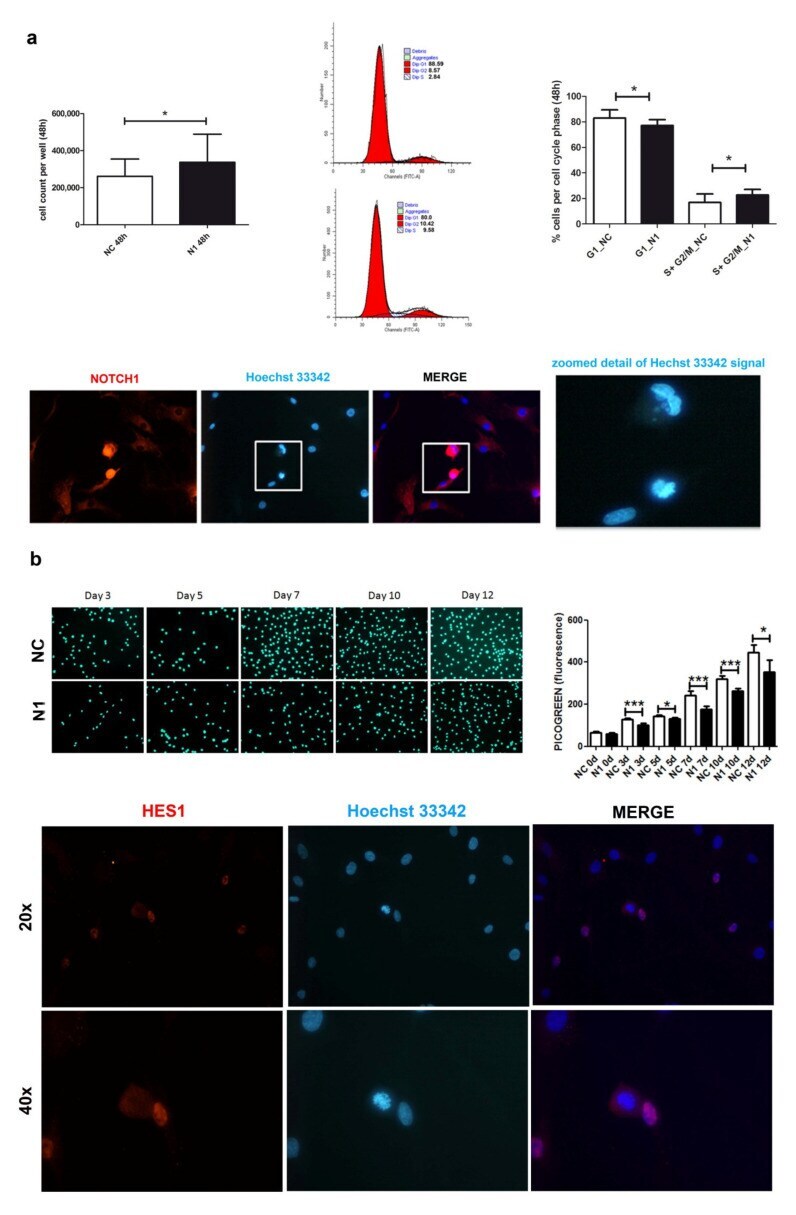
- Effects of NOTCH1 silencing on cell proliferation. ( a ) Early effects (at 48 h) of increased cell proliferation in different NOTCH1 KD primary chondrocyte cultures ( n = 7) in keeping with statistically significant increased percentage of cells in the S-G 2 M fraction as shown by one representative sample and cumulative data ( n = 4); * p < 0.05. Immunofluorescence indicates the close NOTCH1/DNA interaction during mitosis. Bottom: NOTCH1 immunofluorescence in chondrocytes at 72 h post control siRNA transfection. NOTCH1 staining (red), nuclei (blue), and merged images obtained with a NIKON Eclipse 90i fluorescence microscope equipped with 20 x objective lens. The white square indicates a detail that has been further zoomed and represented in the right image to indicate that the cells with strong NOTCH1 signal are caught during mitosis based on condensed chromatin. ( b ) Late effects (plating the cells recovered at 48 h post-transfection and assessment at days 0, 3, 5, 7, 10, 12) of delayed cell proliferation in NOTCH1 KD chondrocytes. Upper image shows the signal of the highly specific Picogreen staining of the nuclei of control cells (upper row) or NOTCH1 silenced cells (lower row). The right graph represents the mean +- SD of the fluorescence intensity obtained by scanning the bottom of the quintuplicate wells; * p < 0.05, *** p < 0.001. Bottom: HES1 immunofluorescence in chondrocytes at 72 h post control siRNA transfection. HES1 staining (red), nuclei (blue), and merged im
- Submitted by
- Invitrogen Antibodies (provider)
- Main image

- Experimental details
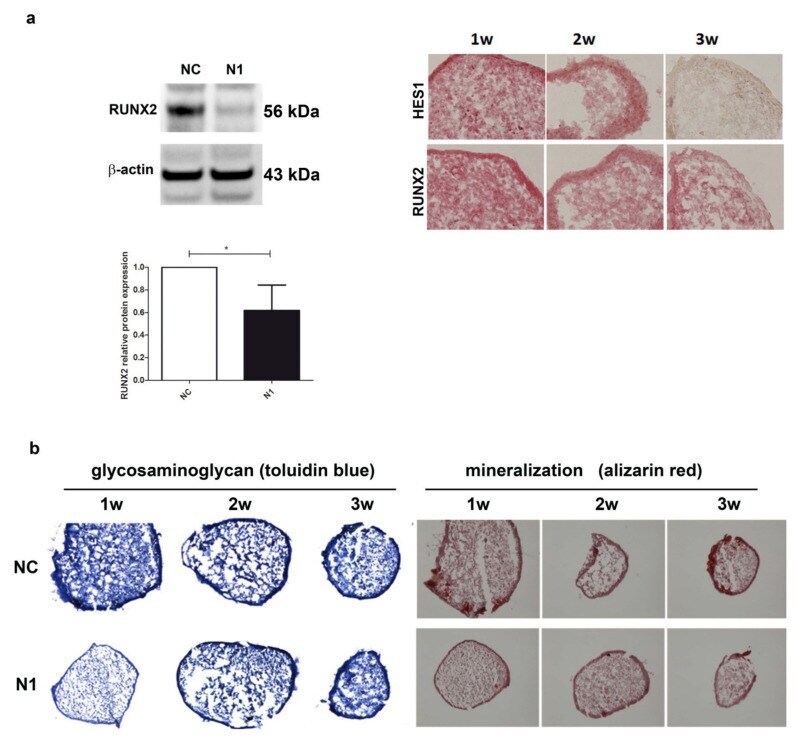
- Figure 5 Effects of NOTCH1 silencing in the differentiation of chondrocytes in 3-D cultures. ( a ) NOTCH1 silencing impacts on RUNX2 expression: left, a representative Western blot indicates that RUNX2 protein is significantly reduced in NOTCH1 silenced 3-D cultures at 1 week as confirmed in the cumulative assessment shown in the lower graph ( n = 5, * p < 0.05); right, immunohistochemistry imaging of the correlated reduced expression of RUNX2 and HES1 in micromass maturation across 1-3 weeks. ( b ) NOTCH1 silencing impacts on ECM maturation. Left, GAG deposition at 1, 2, and 3 weeks as evidenced by toluidin blue staining: GAG deposition resulted delayed in N1 KD 3-D constructs. Right: Alizarin Red staining on micromasses showed a markedly reduced calcium deposition at all time points in N1 KD micromasses. All images were obtained with a NIKON Eclipse 90i microscope equipped with 10x objective lens.
- Submitted by
- Invitrogen Antibodies (provider)
- Main image
- Experimental details
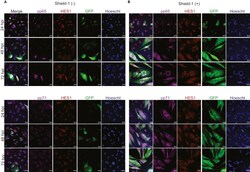
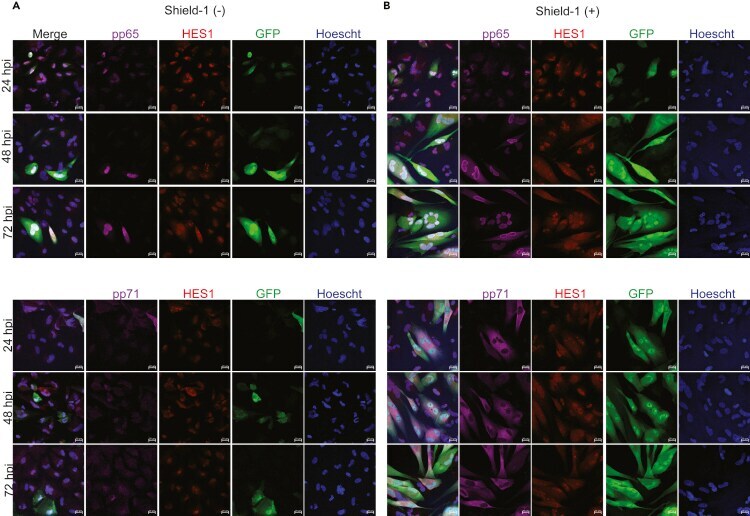
- NPCs infected with TB40r mGFP-IE-FKBP and administered Shield-1 show positive staining for viral tegument proteins pp65 and pp71 by 24 hpi NPCs were infected at 3 dpi with TB40r mGFP-IE-FKBP at an MOI of 1. One group was then supplemented with 1 muM Shield-1 daily (Shield-1 +) while the other was given vehicle (Shield-1 -), cells were fixed at noted times post infection for staining. (A) Immunocytochemical images from the Shield-1 (-) group at 24, 48, and 72 hpi for viral tegument proteins pp65 or pp71 (purple), neurodevelopmental transcription factor HES1 (red), GFP (green), Hoechst (blue), and merge. (B) Immunohistochemical images from the Shield (+) group using the same staining targets as (A). All images taken at 40X using Zeiss LSM980 with scale bar of 20 uM.
- Submitted by
- Invitrogen Antibodies (provider)
- Main image
- Experimental details
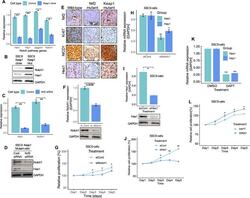
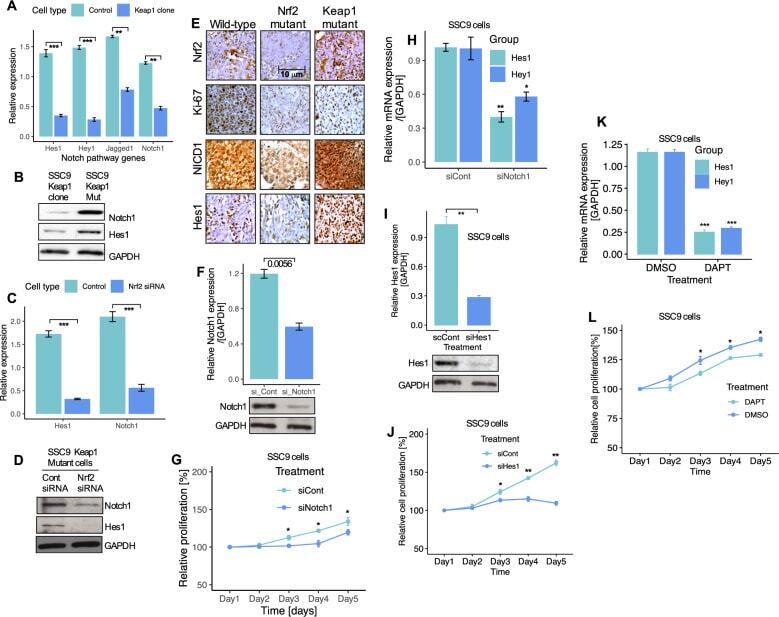
- Nrf2 regulates Notch signaling in HNSCC cells. A Expression of Notch1 and Notch target genes mRNA in control and Keap1- expressing SSC9 clone cells. B Expression of Notch1 and Hes1 proteins in Keap1 -mutant and Keap1- expressing SSC9 cells. C Notch1 and Hes1 mRNA and, D protein expression after Nrf2 knockdown in SSC9 cells. E Immunohistochemistry staining and expression of Nrf2 , Ki67, Notch1, and Hes1 in HNSCC clinical samples from wild-type, Nrf2 , and Keap1 mutant patients tumor tissues. F Notch1 expression in non-targeting control and Notch1 siRNA-treated SSC9 cells G Cell proliferation of SSC9 cells after knockdown of Notch1 by siRNA. H Relative mRNA expression of Hes1 and Hey1 after Notch1 knockdown in SSC9 cells. I Hes1 mRNA expression and, J Cell proliferation after knockdown of Hes1 siRNA in SSC9 cells. K Effects of Notch inhibitor DAPT and, L Assessment of cell growth after treating the cells with Notch inhibitor DAPT for 5-days. The mRNA expression levels were calculated and normalized relative to GAPDH. All experiments were run in triplicate and compared with the control group. Data presents as mean +- SEM (** P < 0.01, *** P < 0.001).
- Submitted by
- Invitrogen Antibodies (provider)
- Main image

- Experimental details
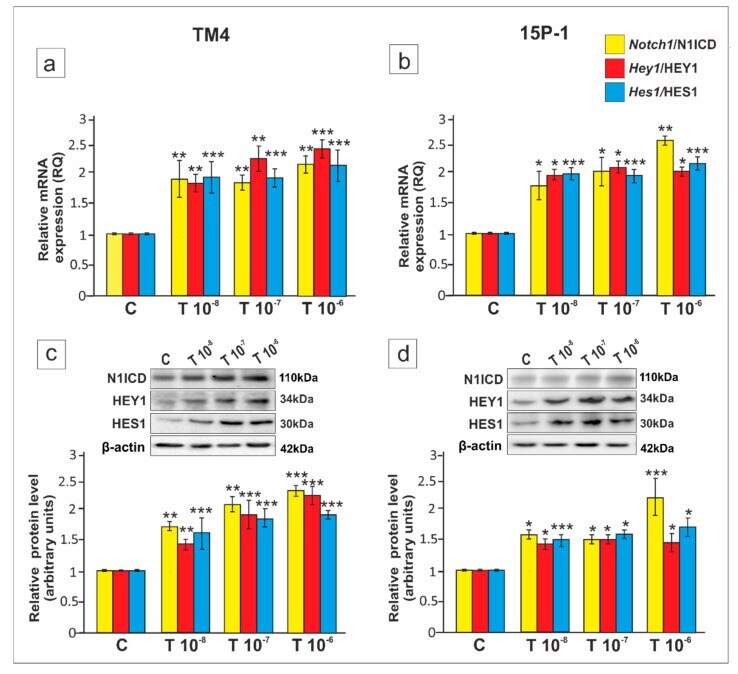
- Figure 1 The effect of testosterone on Notch1 , Hey1 and Hes1 mRNA, and Notch1 intracellular domain (N1ICD), HEY1 and HES1 protein expression in TM4 and 15P-1 Sertoli cell lines. Cells were treated with a vehicle (control, C), 10 -8 M, 10 -7 M or 10 -6 M testosterone (T) for 24 h ( a , b ) Relative expression of mRNAs (RQ) was determined using quantitative real-time RT-PCR analysis. The expression values of the individual genes were normalized to the mean expression of Rn18s , B2m , Gapdh and Actb . ( c , d ) Western blot detection of the proteins. The relative level of studied proteins was normalized to beta-actin. The protein levels within the control group were arbitrarily set at 1. The histograms are the quantitative representation of data (mean +- SD) of three independent experiments, each in triplicate. Significant differences from control values are denoted as * p < 0.05, ** p < 0.01, and *** p < 0.001.
- Submitted by
- Invitrogen Antibodies (provider)
- Main image
- Experimental details
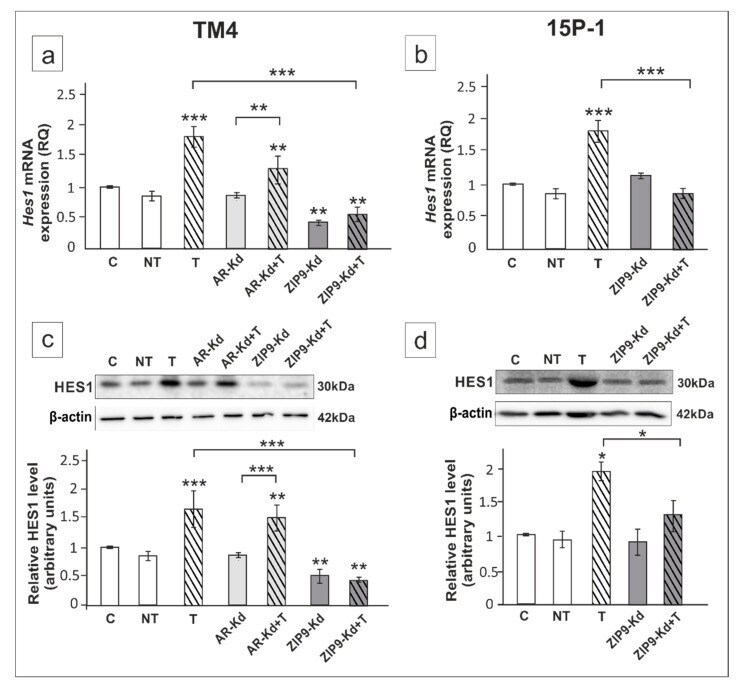
- Figure 8 The effect of AR and ZIP9 knockdown on Hes1 mRNA and HES1 protein expression in TM4 ( a , c ) and 15P-1 ( b , d ) Sertoli cells. Cells were treated with transfection reagent alone (C), transfection reagent + 5 x 10 -8 M non-targeting siRNA (negative control, NT), transfection reagent + 5 x 10 -8 M AR siRNA (AR-Kd) or ZIP9 siRNA (ZIP9-Kd). After 24 h 10 -8 M T or vehicle was added to the culture. ( a , b ) Relative expression of mRNAs (RQ) was determined using real-time RT-PCR analysis. The expression values of the individual genes were normalized to the mean expression of Rn18s , B2m , Gapdh and Actb . ( c , d ) Western blot detection of the proteins. The relative level of studied protein was normalized to beta-actin. The protein levels within the control group were arbitrarily set at 1. The histograms are the quantitative representation of data (mean +- SD) of three independent experiments, each in triplicate. Significant differences from control values are denoted as * p < 0.05, ** p < 0.01, and *** p < 0.001.
- Submitted by
- Invitrogen Antibodies (provider)
- Main image

- Experimental details
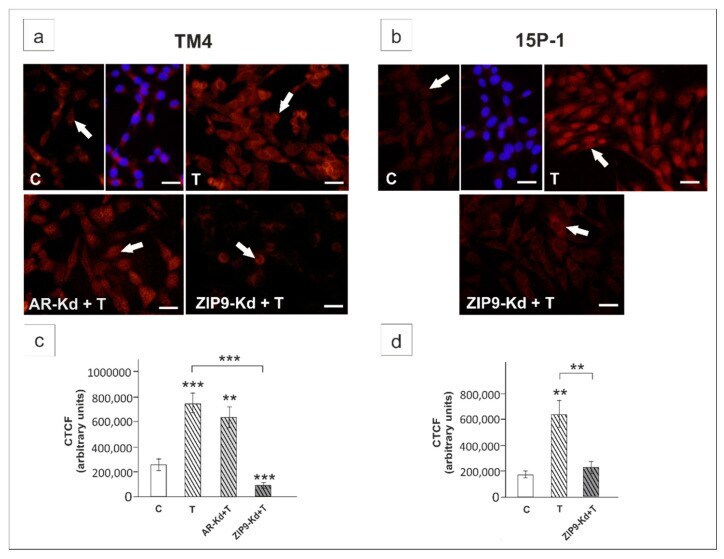
- Figure 9 Immunofluorescence analysis of HES1 expression in TM4 ( a , c ) and 15P-1 ( b , d ) cells following AR or ZIP9 knockdown. Cells were transfected with transfection reagent alone (C), transfection reagent + 5 x 10 -8 M AR siRNA (AR-Kd) or ZIP9 siRNA (ZIP9-Kd). After 24 h 10 -8 M T or vehicle was added to the culture. Cells were fixed after a 24 h incubation. ( a , b ) Representative microphotographs of TM4 and 15P-1 cultures. Arrows indicate positive signal. Sertoli cell nuclei were stained with DAPI (blue). Right panels in controls (C) represent the merged images. Scale bar = 25 um. ( c , d ) The fluorescence intensity was quantified using ImageJ and displayed in corrected total cell fluorescence (CTCF). Histograms represent the mean +- SD. Significant differences from control values are denoted as ** p < 0.01, and *** p < 0.001.
- Submitted by
- Invitrogen Antibodies (provider)
- Main image
- Experimental details
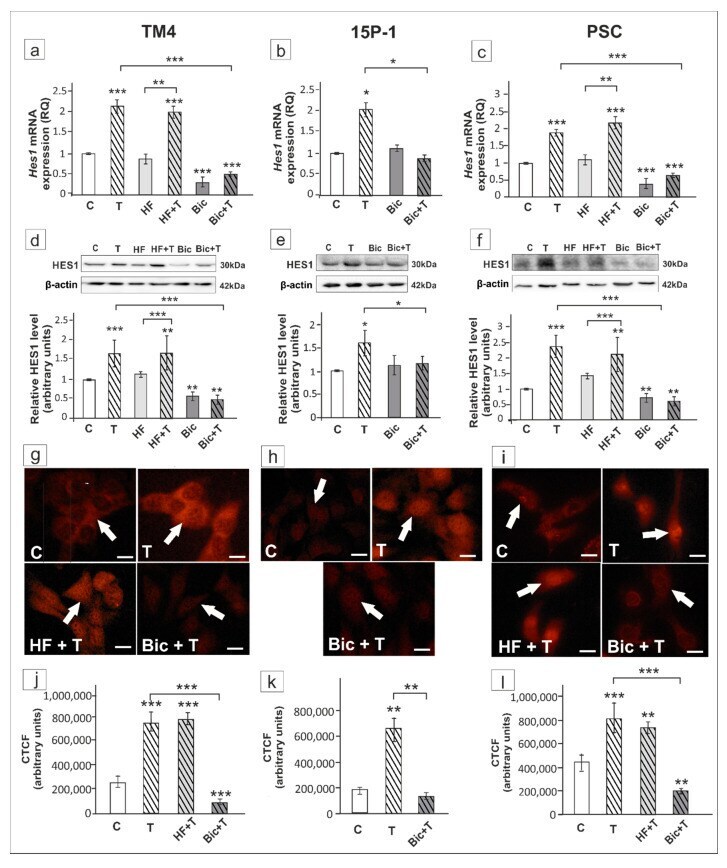
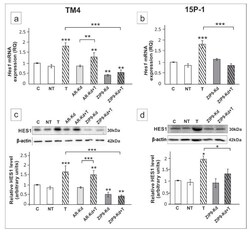
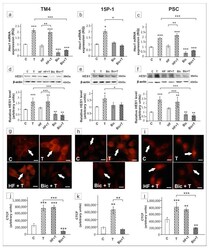
- Figure 10 The effect of hydroxyflutamide (HF) and bicalutamide (Bic) on Hes1 mRNA and HES1 protein expression in TM4 ( a , d , g , j ), 15P-1 ( b , e , h , k ), and primary (PSC; c , f , i , l ) Sertoli cells. Cells were treated with 10 -8 M testosterone (T), 10 -4 HF, HF + T, 10 -6 M Bic, Bic + T or vehicle (C) for 24 h. ( a - c ) Relative expression of mRNAs (RQ) was determined using real-time RT-PCR analysis. The expression values of the individual genes were normalized to the mean expression of Rn18s , B2m , Gapdh and Actb . ( d - f ) Western blot detection of the proteins. The relative level of studied protein was normalized to beta-actin. The protein levels within the control group were arbitrarily set at 1. The histograms are the quantitative representation of data (mean +- SD) of three independent experiments, each in triplicate. ( g - i ) Immunofluorescence analysis of HES1 expression. Arrows indicate positive signal. Scale bar = 10 um. ( j - l ) The fluorescence intensity was quantified using ImageJ and displayed in corrected total cell fluorescence (CTCF). Histograms represent the mean +- SD. Significant differences from control values are denoted as * p < 0.05, ** p < 0.01, and *** p < 0.001.