Explore
 Validate
 Learn
Learn Western blot
 Immunocytochemistry
Antibody data
- Antibody Data
- Antigen structure
- References [4]
- Comments [0]
- Validations
- Immunocytochemistry [2]
- Immunohistochemistry [1]
- Other assay [7]
Submit
Validation data
Reference
Comment
Report error
- Product number
- PA5-24949 - Provider product page

- Provider
- Invitrogen Antibodies
- Product name
- FABP7 Polyclonal Antibody
- Antibody type
- Polyclonal
- Antigen
- Synthetic peptide
- Description
- This antibody is predicted to react with bovine and chicken based on sequence homology.
- Reactivity
- Human, Mouse
- Host
- Rabbit
- Isotype
- IgG
- Vial size
- 400 μL
- Concentration
- 2 mg/mL
- Storage
- Store at 4°C short term. For long term storage, store at -20°C, avoiding freeze/thaw cycles.
Submitted references Disrupted Association of Sensory Neurons With Enveloping Satellite Glial Cells in Fragile X Mouse Model.
Profiling sensory neuron microenvironment after peripheral and central axon injury reveals key pathways for neural repair.
Satellite glial cells promote regenerative growth in sensory neurons.
FABP7 upregulation induces a neurotoxic phenotype in astrocytes.
Avraham O, Deng PY, Maschi D, Klyachko VA, Cavalli V
Frontiers in molecular neuroscience 2021;14:796070
Frontiers in molecular neuroscience 2021;14:796070
Profiling sensory neuron microenvironment after peripheral and central axon injury reveals key pathways for neural repair.
Avraham O, Feng R, Ewan EE, Rustenhoven J, Zhao G, Cavalli V
eLife 2021 Sep 29;10
eLife 2021 Sep 29;10
Satellite glial cells promote regenerative growth in sensory neurons.
Avraham O, Deng PY, Jones S, Kuruvilla R, Semenkovich CF, Klyachko VA, Cavalli V
Nature communications 2020 Sep 29;11(1):4891
Nature communications 2020 Sep 29;11(1):4891
FABP7 upregulation induces a neurotoxic phenotype in astrocytes.
Killoy KM, Harlan BA, Pehar M, Vargas MR
Glia 2020 Dec;68(12):2693-2704
Glia 2020 Dec;68(12):2693-2704
No comments: Submit comment
Supportive validation
- Submitted by
- Invitrogen Antibodies (provider)
- Main image

- Experimental details
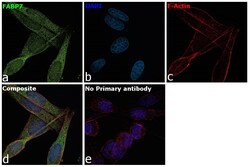
- Immunofluorescence analysis of Fatty acid-binding protein, brain was performed using 70% confluent log phase SK-MEL-5 cells. The cells were fixed with 4% paraformaldehyde for 10 minutes, permeabilized with 0.1% Triton™ X-100 for 15 minutes, and blocked with 2% BSA for 1 hour at room temperature. The cells were labeled with FABP7 Polyclonal Antibody (Product # PA5-24949) at 1:100 dilution in 0.1% BSA, incubated at 4 degree celsius overnight and then labeled with Donkey anti-Rabbit IgG (H+L) Highly Cross-Adsorbed Secondary Antibody, Alexa Fluor Plus 488 (Product # A32790), (1:2000 dilution), for 45 minutes at room temperature (Panel a: Green). Nuclei (Panel b:Blue) were stained with ProLong™ Diamond Antifade Mountant with DAPI (Product # P36962). F-actin (Panel c: Red) was stained with Rhodamine Phalloidin (Product # R415, 1:300 dilution). Panel d represents the merged image showing Cytosolic localization. Panel e represents control cells with no primary antibody to assess background. The images were captured at 60X with oil immersion magnification.

- Submitted by
- Invitrogen Antibodies (provider)
- Main image
- Experimental details
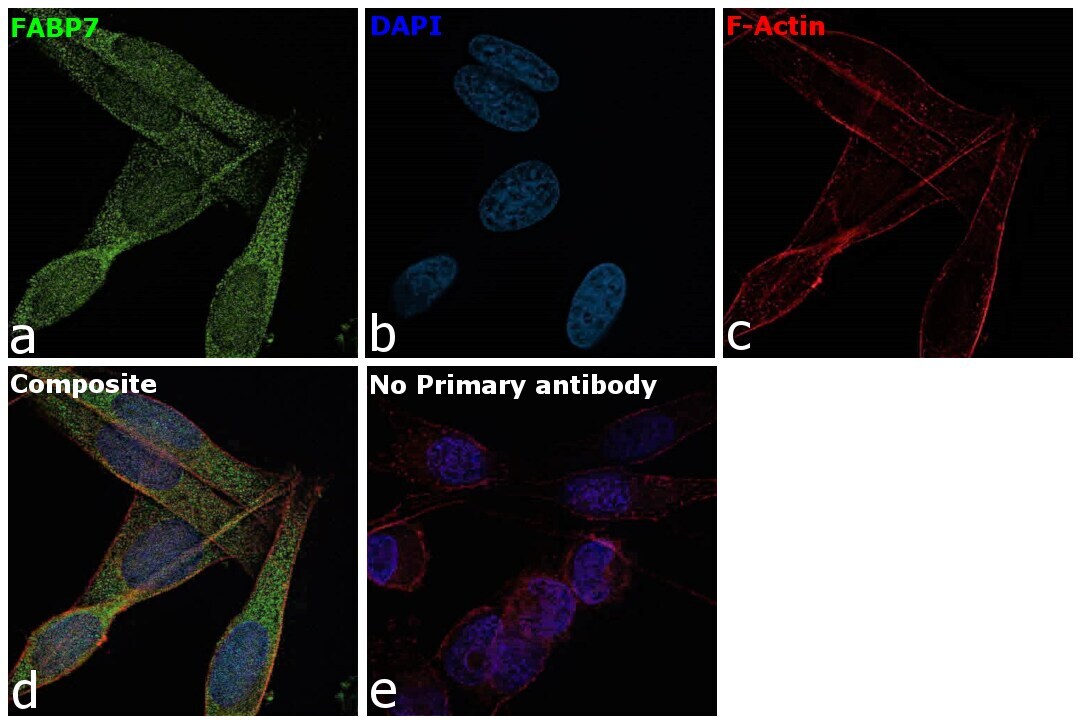
- Immunofluorescence analysis of Fatty acid-binding protein, brain was performed using 70% confluent log phase SK-MEL-5 cells. The cells were fixed with 4% paraformaldehyde for 10 minutes, permeabilized with 0.1% Triton™ X-100 for 15 minutes, and blocked with 2% BSA for 1 hour at room temperature. The cells were labeled with FABP7 Polyclonal Antibody (Product # PA5-24949) at 1:100 dilution in 0.1% BSA, incubated at 4 degree celsius overnight and then labeled with Donkey anti-Rabbit IgG (H+L) Highly Cross-Adsorbed Secondary Antibody, Alexa Fluor Plus 488 (Product # A32790), (1:2000 dilution), for 45 minutes at room temperature (Panel a: Green). Nuclei (Panel b:Blue) were stained with ProLong™ Diamond Antifade Mountant with DAPI (Product # P36962). F-actin (Panel c: Red) was stained with Rhodamine Phalloidin (Product # R415, 1:300 dilution). Panel d represents the merged image showing Cytosolic localization. Panel e represents control cells with no primary antibody to assess background. The images were captured at 60X with oil immersion magnification.
Supportive validation
- Submitted by
- Invitrogen Antibodies (provider)
- Main image
- Experimental details
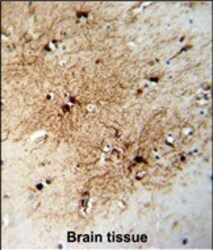
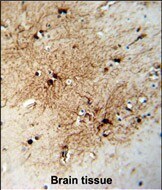
- Immunohistochemistry analysis of FABP7 in formalin fixed and paraffin embedded human brain tissue. Samples were incubated with FABP7 polyclonal antibody (Product # PA5-24949) followed by peroxidase conjugation of the secondary antibody and DAB staining. This data demonstrates the use of this antibody for immunohistochemistry. Clinical relevance has not been evaluated.
Supportive validation
- Submitted by
- Invitrogen Antibodies (provider)
- Main image
- Experimental details
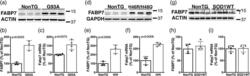
- 1 FIGURE Upregulation of FABP7 expression in mutant human superoxide dismutase 1 (hSOD1)-linked mouse models. (a,d,g) Western blot analysis of FABP7 expression in the lumbar spinal cord of age-matched nontransgenic (NonTG) and symptomatic hSOD1 G93A (G93A, about 140 days old) (a), or symptomatic hSOD1 H46R/H48Q (H46R/H48Q, about 210 days old) (d) or age-matched control hSOD1 WT mice (about 210 days old) (g). (b,e,h) Quantification of FABP7 protein levels shown in (a,d,g), respectively. FABP7 expression was quantified, normalized by the levels of a loading control and expressed as percentage of age-matched NonTG mice (each lane corresponds to a different animal, mean +- SD ). (c,f,i) Fabp7 mRNA levels in the lumbar spinal cord of age-matched NonTG and symptomatic G93A (c), or symptomatic H46R/H48Q (f), or age-matched hSOD1 WT (i) mice. Fabp7 mRNA levels were determined by real-time PCR and corrected by actin mRNA levels ( n = 3-4 mice, mean +- SD )

- Submitted by
- Invitrogen Antibodies (provider)
- Main image

- Experimental details
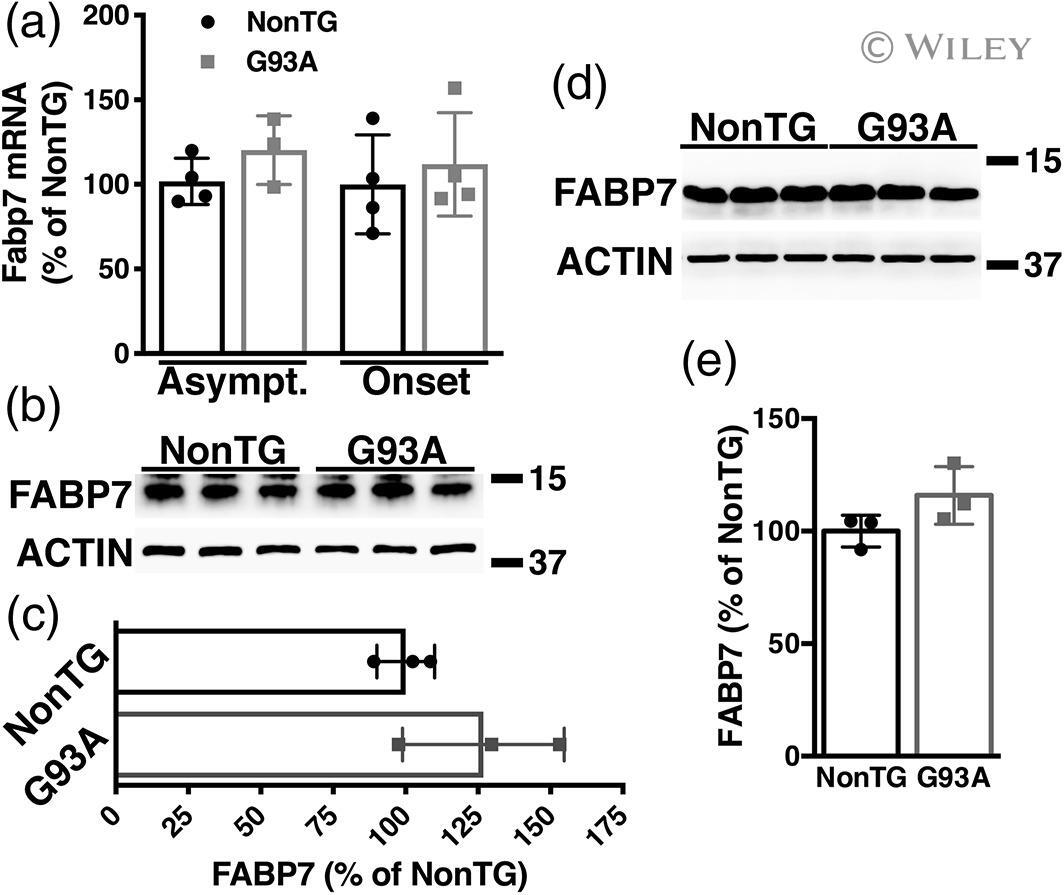
- 4 FIGURE FABP7 upregulation is not observed in presymptomatic human superoxide dismutase 1 (hSOD1) G93A mice. (a) Fabp7 mRNA levels in the lumbar spinal cord of 30 days old (asymptomatic) or 110 days old (around symptoms onset) hSOD1 G93A (G93A) mice and age-matched nontransgenic (NonTG) controls. Fabp7 mRNA levels were determined by real-time PCR and corrected by actin mRNA levels ( n = 3-4 mice, mean +- SD ). (b) Western blot analysis of FABP7 expression in the lumbar spinal cord of 110 days old G93A mice and age-matched NonTG controls. Each lane corresponds to a different animal. (c) Quantification of FABP7 protein levels shown in (b). FABP7 expression was quantified, normalized by ACTIN levels and expressed as percentage of age-matched NonTG mice (mean +- SD ). (d,e) Western blot analysis of FABP7 expression in neonatal spinal cord astrocyte cultures from NonTG and G93A mice. Quantification of FABP7 levels is shown in (e). FABP7 expression was quantified, normalized by ACTIN levels, and expressed as percentage of NonTG cultures (mean +- SD )
- Submitted by
- Invitrogen Antibodies (provider)
- Main image
- Experimental details
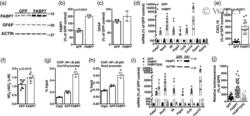
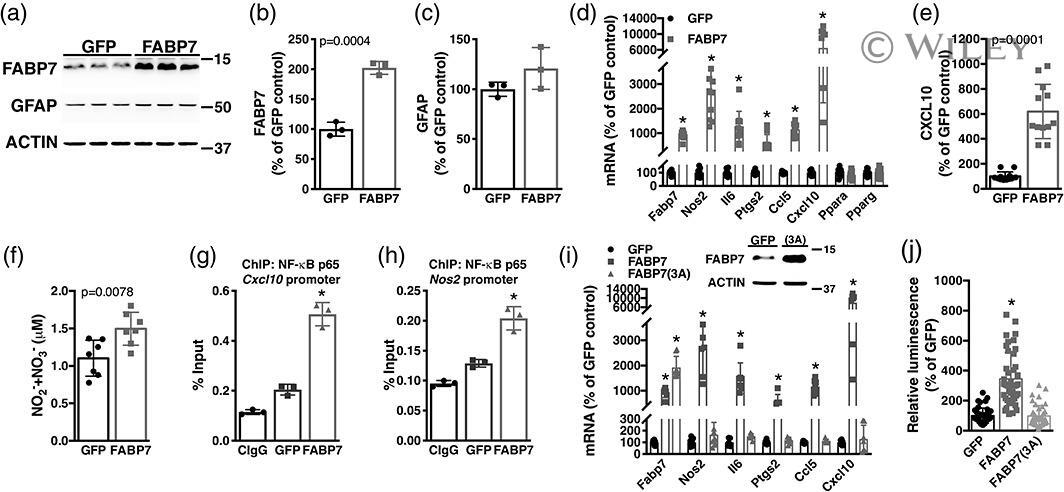
- 5 FIGURE Overexpression of FABP7 confers upon nontransgenic astrocytes a pro-inflammatory phenotype. (a) Primary confluent spinal cord astrocyte cultures obtained from neonatal nontransgenic (NonTG) mice were transduced with adenovirus expressing GFP or FABP7. After 48 hr, FABP7 and GFAP protein levels were determined and corrected by ACTIN levels. (b,c) Quantification of the images shown in (a). (d) Fabp7 , Nos2 , Il6 , Ptgs2 , Ccl5 , Cxcl10 , Ppara , and Pparg mRNA levels in astrocytes treated as in (a). mRNA levels were determined by real-time PCR and corrected by Actin mRNA levels. Data are expressed as percentage of GFP control cells. (e) CXCL10 levels in conditioned media (48 hr) from GFP or FABP7 overexpressing NonTG astrocytes. Data are expressed as percentage of GFP control cells. (f) Nitrite (NO 2 - ) and nitrate (NO 3 - ) levels in conditioned media (48 hr) from GFP or FABP7 overexpressing NonTG astrocytes. (g,h) Astrocytes were treated as in (a) and 48 hr later chromatin immunoprecipitation was performed with a preimmune IgG (CIgG) or an anti-NF-kappaB p65 subunit antibody. Purified DNA was analyzed by real-time PCR with specific primers flanking an NF-kappaB binding site in the Cxcl10 (g) or Nos2 (h) promoter. (i) Real-time PCR analysis of Fabp7 , Nos2 , Il6 , Ptgs2 , Ccl5 , and Cxcl10 mRNA expression levels 48 hr after FABP7 or FABP7(3A) overexpression in neonatal NonTG astrocytes. mRNA levels were corrected by Actin levels and expressed as percentage of GFP con
- Submitted by
- Invitrogen Antibodies (provider)
- Main image
- Experimental details
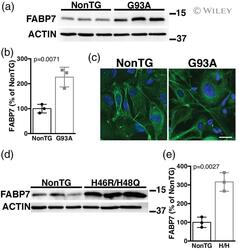
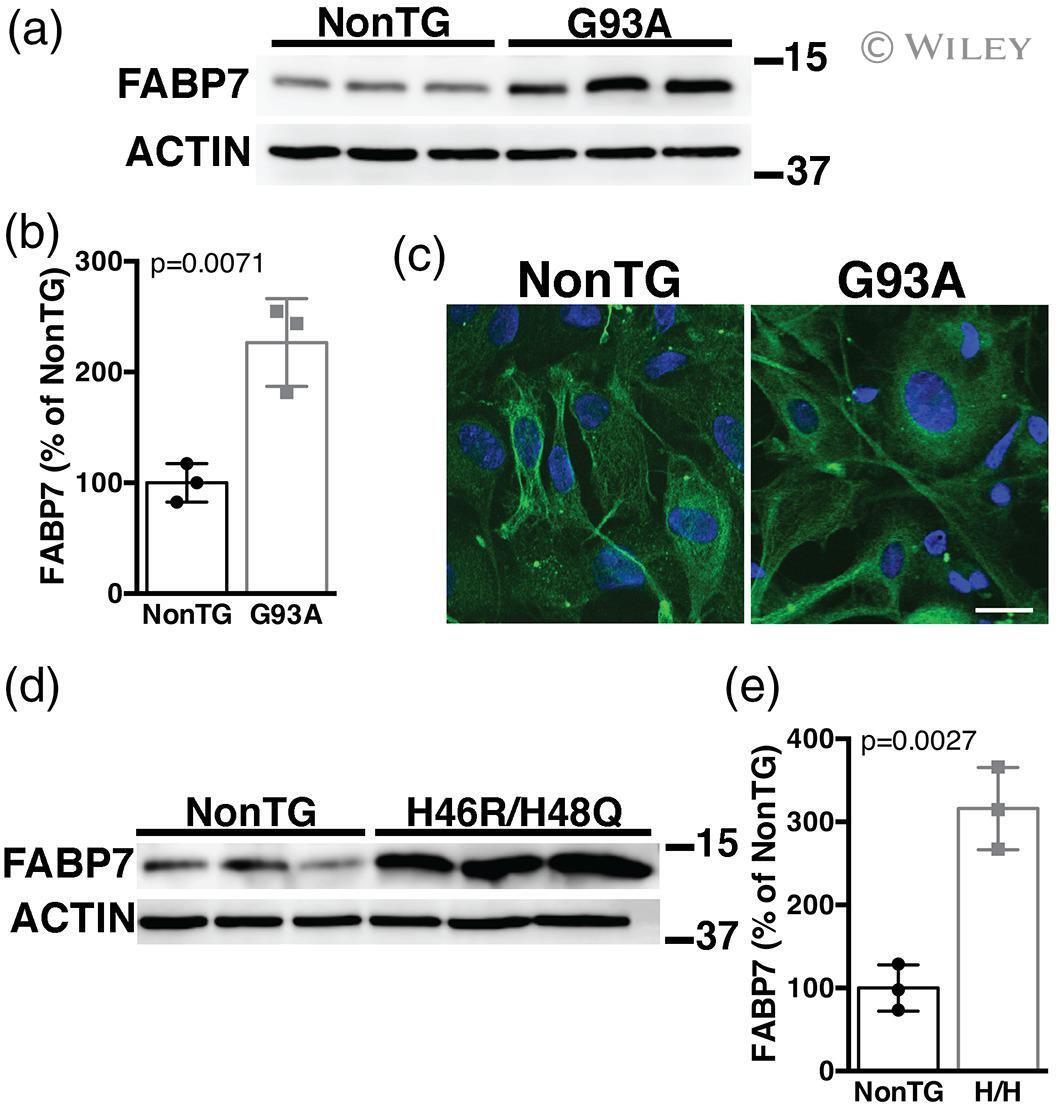
- 7 FIGURE Spinal cord astrocyte cultures obtained from symptomatic amyotrophic lateral sclerosis (ALS) mice display upregulated FABP7 expression. (a,b) Western blot analysis of FABP7 expression in astrocyte cultures obtained from age-matched nontransgenic (NonTG) and symptomatic human superoxide dismutase 1 (hSOD1) G93A (G93A) mice. Quantification of FABP7 levels is shown in (b). FABP7 expression was quantified, normalized by ACTIN levels and expressed as percentage of NonTG cultures (each lane corresponds to a different primary culture, mean +- SD ). (c) Representative microphotographs of astrocyte cultures from age-matched NonTG and symptomatic G93A mice immunostained for GFAP (green). Nuclei were counterstained with 4',6-diamidino-2-phenylindole dihydrochloride (DAPI) (blue). Scale bar: 50 mum. (d,e) Western blot analysis of FABP7 expression in astrocyte cultures from age-matched NonTG and symptomatic hSOD1 H46R/H48Q (H46R/H48Q) mice. Quantification of FABP7 levels is shown in (e). FABP7 expression was quantified, normalized by ACTIN levels and expressed as percentage of NonTG cultures (each lane corresponds to a different primary culture, mean +- SD ) [Color figure can be viewed at wileyonlinelibrary.com ]
- Submitted by
- Invitrogen Antibodies (provider)
- Main image
- Experimental details
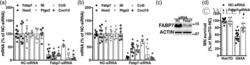
- 8 FIGURE Decreasing FABP7 expression in amyotrophic lateral sclerosis (ALS)-astrocytes confers protection to cocultured motor neurons (MNs). (a,b) Primary spinal cord astrocyte cultures from symptomatic human superoxide dismutase 1 (hSOD1) H46R/H48Q (H46R/H48Q) (a), and symptomatic hSOD1 G93A (G93A) (b) mice were transfected with a negative control (NC) or an Fabp7-siRNA. Six days after transfection, Fabp7 , Nos2 , Il6 , Ptgs2 , Ccl5 , and Cxcl10 mRNA levels were determined by real-time PCR and corrected by actin mRNA levels. Data are expressed as percentage of NC-siRNA-treated cells (* p < .05, different from NC-siRNA). (c) Representative image of Western blot analysis of FABP7 expression in primary spinal cord astrocytes from symptomatic G93A mice 6 days after transfection with an NC or an Fabp7-siRNA. (d) Primary spinal cord astrocyte cultures from age-matched nontransgenic (NonTG) and symptomatic G93A mice were treated as in (a). Six days after transfection, embryonic MN were plated on top. MN survival was determined 72 hr later. (* p < .05, different from NC-siRNA-treated NonTG, # p < .05, different from NC-siRNA-treated G93A). For all panels, data are expressed as mean +- SD

- Submitted by
- Invitrogen Antibodies (provider)
- Main image
- Experimental details
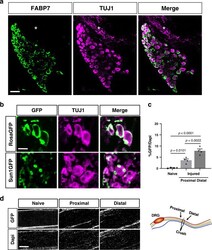
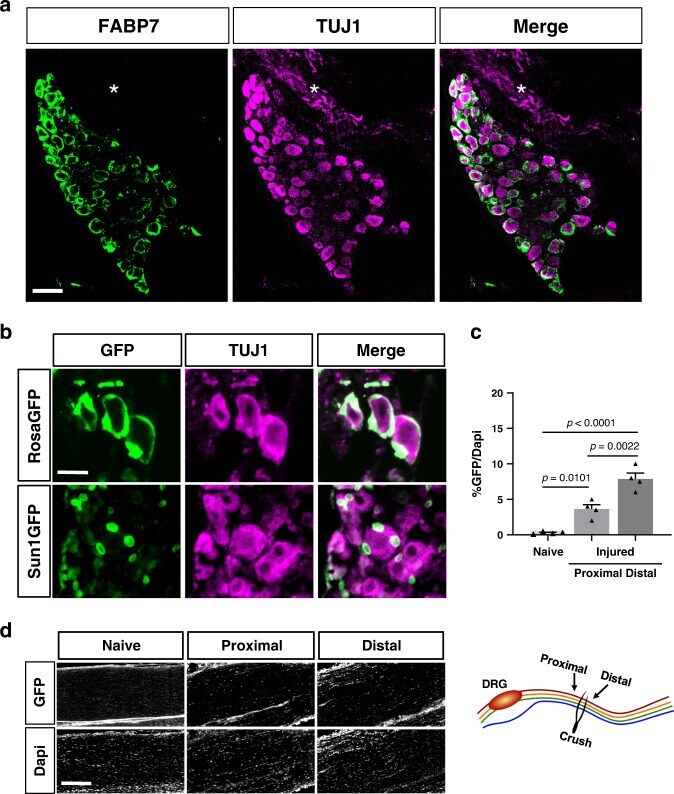
- Fig. 2 Fabp7 is a specific marker for SGC. a Representative images of immunofluorescence staining of mouse DRG sections with FABP7 (green) which labels SGC surrounding neurons marked with TUJ1 (magenta). No FABP7 expression in the axon rich area (asterisks) is observed. n = 3 biologically independent animals, Scale bar: 100 um. b BLBPCre-ER mice crossed with RosaGFP or Sun1GFP show expression of GFP in the SGC surrounding the neurons marked with TUJ1 (magenta). RosaGFP n = 3 and Sun1GFP n = 4 biologically independent animals, Scale bar: 50 um. c Quantification of sciatic nerves from BLBPCre-ER mice crossed with Sun1GFP . GFP positive nuclei were normalized to the total number of DAPI positive nuclei. One-way analysis of variance (ANOVA) followed by Sidak's multiple comparisons test. Data are presented as mean values +- SEM. Source data are provided as a Source Data file. d Representative images from naive and injured nerves, ~0.5 mm proximal and distal to the injury site as shown in the scheme. n = 4 biologically independent animals. Scale bar: 50 um.
- Submitted by
- Invitrogen Antibodies (provider)
- Main image

- Experimental details
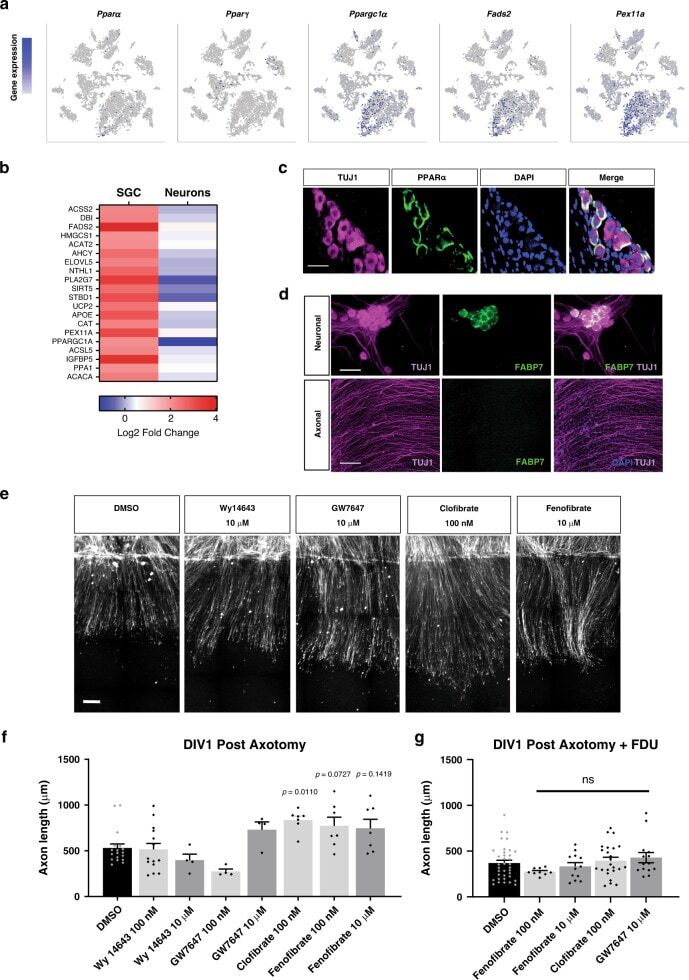
- Fig. 7 Activation of PPARalpha in SGC promotes axon regeneration in neuron-SGC cocultures. a t-SNE overlay for expression of the genes Pparalpha , Ppargamma , and Pparalpha target genes Ppargc1a , Fads2 , and Pex11a . b Heat map of PPARalpha target genes expression after nerve injury in SGC and neurons. c Representative images of DRG sections immunostained for PPARalpha (green) and TUJ1 (magenta). n = 3 biologically independent animals. Scale bar: 100 um. d Neuronal and axonal area in embryonic DRG spot co-cultures at DIV7, immunostained for FABP7 (green) and TUJ1 (magenta). n = 3 biologically independent experiments. Scale Bar: 100 um (neuronal) and 50 um (axonal). e Embryonic DRG spot co-cultures axotomized at DIV7 after a 24 h pre-treatment with the indicated PPARalpha agonists at the indicated concentration. Cultures were fixed after 24 h and stained with SCG10. Scale Bar: 50 um. f Distance of regenerating axons was measured from the injury site from images shown in ( e ). g Embryonic DRG spot culture was supplement with FDU (5-deoxyfluoruridine) to eliminate dividing cells in the culture. Axotomy was performed at DIV7 after a 24 h pre-treatment with the indicated PPARalpha agonists. Distance of regenerating axons was measured from injury site after 24 h. ns-non significant. n = 4 biologically independent animals examined over 2 independent experiments for ( f and g ). P values determined by One way ANOVA followed by Dunnett's multiple comparisons test are presented in (