Explore
 Validate
 Learn
LearnPA1-16931
antibody from Invitrogen Antibodies
Targeting: MAP1LC3A
ATG8E, LC3, LC3A, MAP1ALC3, MAP1BLC3
 Western blot
 ELISA Immunocytochemistry Immunoprecipitation Immunohistochemistry Flow cytometry Chromatin Immunoprecipitation Other assay
Antibody data
- Antibody Data
- Antigen structure
- References [0]
- Comments [0]
- Validations
- Western blot [6]
- Immunocytochemistry [3]
- Immunohistochemistry [1]
- Other assay [16]
Submit
Validation data
Reference
Comment
Report error
- Product number
- PA1-16931 - Provider product page

- Provider
- Invitrogen Antibodies
- Product name
- LC3A/LC3B Polyclonal Antibody
- Antibody type
- Polyclonal
- Antigen
- Synthetic peptide
- Description
- This antibody detects both LC3A and LC3B.|Western blot bands are seen at ~19 kDa, representing LC3-I, and ~17 kDa, representing LC3-II. The observed molecular weight of the protein may vary from the listed predicted molecular weight due to post translational modifications, post translation cleavages, relative charges, and other experimental factors. Recommended positive controls: LC3B overexpression lysate, mouse brain whole tissue lysate (adult whole normal), human brain whole tissue lysate (adult whole normal), Neuro2a whole cell lysate, Neuro2a Chloroquine-treated/untreated cell lysate, HeLa chloroquine-treated/untreated cell lysate This antibody is predicted to react with Bovine based on 100% sequence homology.
- Reactivity
- Human, Mouse, Rat, Canine, Zebrafish
- Host
- Rabbit
- Isotype
- IgG
- Vial size
- 100 µL
- Concentration
- 1 mg/mL
- Storage
- -20°C or -80°C if preferred
No comments: Submit comment
Supportive validation
- Submitted by
- Invitrogen Antibodies (provider)
- Main image

- Experimental details
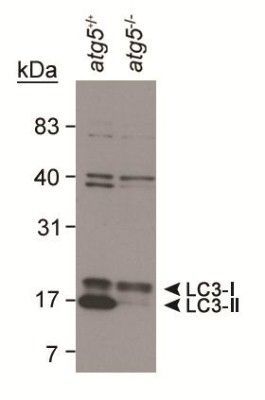
- Western blot analysis of LC3 in mouse ES cell lysates (Atg5-/- ES cells) using an LC3A/LC3B polyclonal antibody (Product # PA1-16931).
- Submitted by
- Invitrogen Antibodies (provider)
- Main image

- Experimental details
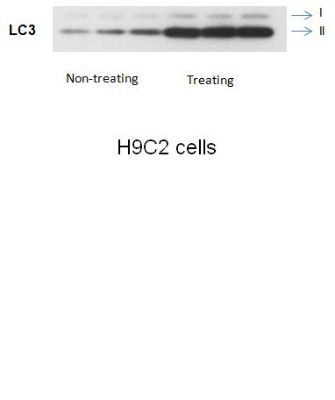
- Western blot analysis of LC3 in H9C2 cells using an LC3A/LC3B polyclonal antibody (Product # PA1-16931).
- Submitted by
- Invitrogen Antibodies (provider)
- Main image

- Experimental details
- Western blot analysis of LC3 in mouse HL-1 cell lysate using an LC3A/LC3B polyclonal antibody (Product # PA1-16931).
- Submitted by
- Invitrogen Antibodies (provider)
- Main image

- Experimental details
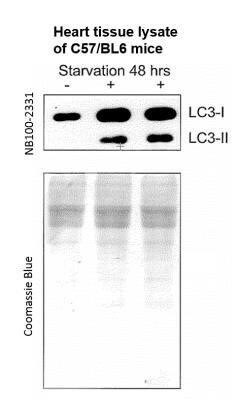
- Western blot analysis of LC3A/LC3B in heart tissue lysates. Samples were incubated in LC3A/LC3B polyclonal antibody (Product # PA1-16931). Heart tissue lysates from mice which were subjected or not to 48 hours of starvation. The signal was developed using ECL method and this LC3 antibody was found to detect both forms of LC3, i.e. LC3A and LC3B. As expected, the levels of LC3B form were higher in the heart tissue lysates from starved mice.
- Submitted by
- Invitrogen Antibodies (provider)
- Main image

- Experimental details
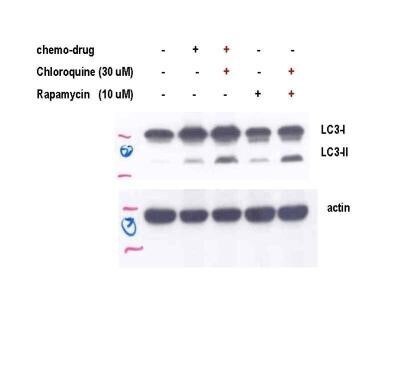
- Western blot analysis of LC3A/LC3B in human cell lysates. Sample was incubated in LC3A/LC3B polyclonal antibody (Product # PA1-16931).
- Submitted by
- Invitrogen Antibodies (provider)
- Main image
- Experimental details
- Western blot analysis of LC3A/LC3B in 0.5 mg/mL Neuro2A lysate. Samples were incubated in LC3A/LC3B polyclonal antibody (Product # PA1-16931). This experiment was performed under reducing conditions using the 12-230 kDa separation system.
Supportive validation
- Submitted by
- Invitrogen Antibodies (provider)
- Main image
- Experimental details
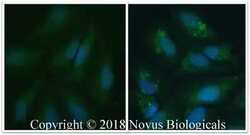
- Immunocytochemistry analysis of LC3A/LC3B in untreated HeLa cells (left panel) and HeLa cells that were treated with 50 µM CQ overnight (right panel). cells fixed for 10 minutes using 10% formalin and then permeabilized for 5 minutes using 1X PBS + 0.05% Triton X-100. Samples were incubated in LC3A/LC3B polyclonal antibody (Product # PA1-16931) using a dilution of 5 µg/mL overnight at 4 °C followed by anti-mouse DyLight 488 (Green) with a dilution of 1:500. Nuclei were counterstained with DAPI (Blue). Cells were imaged using a 40X objective.
- Submitted by
- Invitrogen Antibodies (provider)
- Main image

- Experimental details
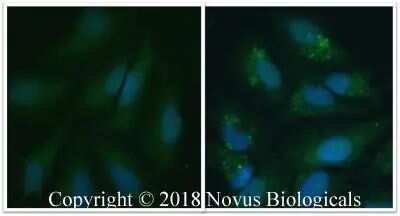
- Immunofluorescent analysis of LC3 in untreated HeLa cells (left panel) and HeLa cells treated with 50µM CQ overnight (right panel). Cells were fixed for 10 min using 10% formalin and permeabilized for 5 min using 1X PBS with 0.05% Triton X-100. Cells were incubated with anti-LC3 polyclonal antibody (Product # PA1-16931) at 5 µg/mL overnight at 4ºC, followed by detection using an anti-mouse DyLight 488 (Green) at a dilution of 1:500. Nuclei were counterstained with DAPI (Blue). Cells were imaged using a 40X magnification.

- Submitted by
- Invitrogen Antibodies (provider)
- Main image

- Experimental details
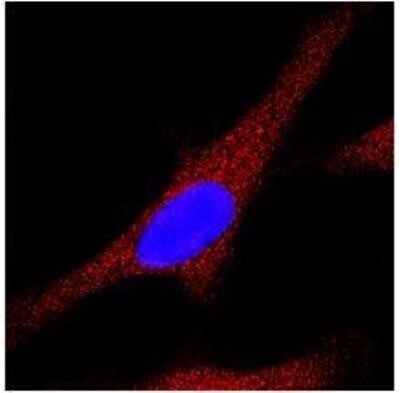
- Immunocytochemistry analysis of LC3A/LC3B in HeLa cells. Samples were incubated in LC3A/LC3B polyclonal antibody (Product # PA1-16931). Antibody (red). Nuclei were counterstained with DAPI (blue).
Supportive validation
- Submitted by
- Invitrogen Antibodies (provider)
- Main image

- Experimental details
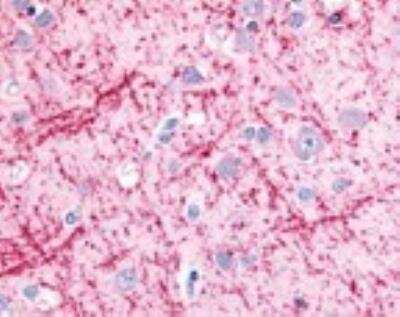
- Immunohistochemical analysis of LC3 in human cerebral cortex tissue using anti-LC3 polyclonal antibody (Product # PA1-16931).
Supportive validation
- Submitted by
- Invitrogen Antibodies (provider)
- Main image
- Experimental details
- NULL
- Submitted by
- Invitrogen Antibodies (provider)
- Main image

- Experimental details
- NULL
- Submitted by
- Invitrogen Antibodies (provider)
- Main image
- Experimental details
- NULL
- Submitted by
- Invitrogen Antibodies (provider)
- Main image
- Experimental details
- NULL
- Submitted by
- Invitrogen Antibodies (provider)
- Main image
- Experimental details
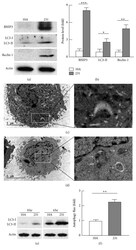
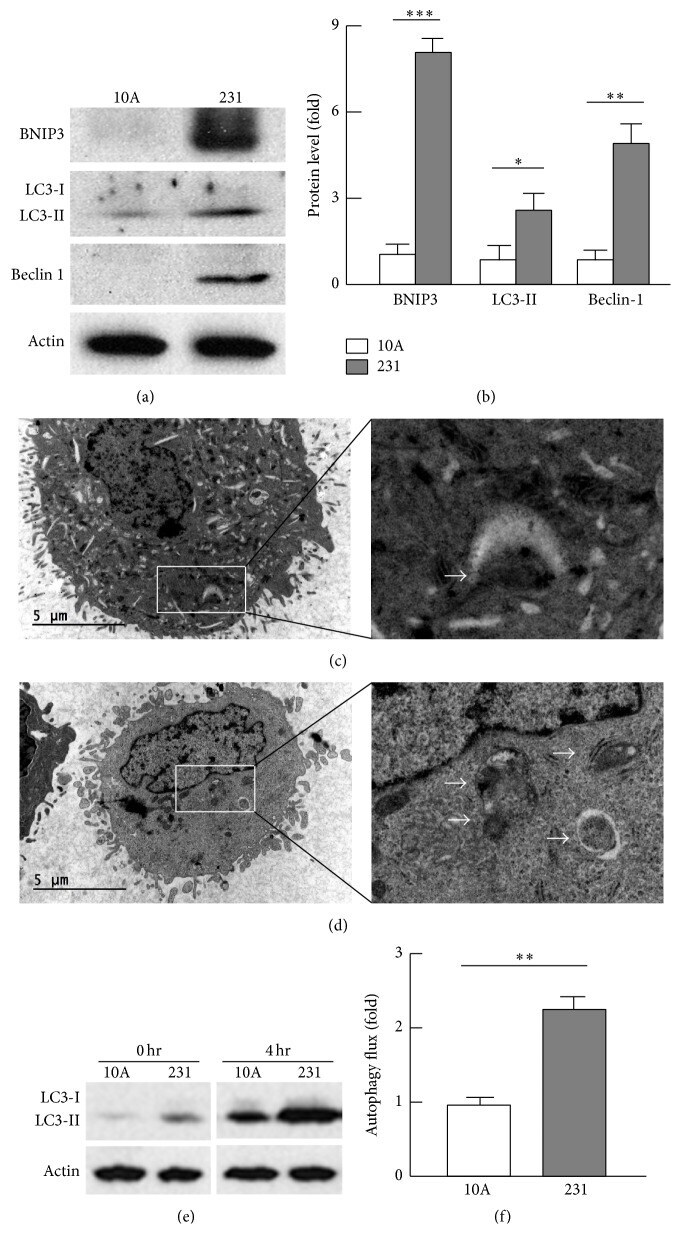
- Figure 4 Analysis of mitochondrial autophagy. (a)-(b) Analysis of the mitophagy biomarker (BNIP3) and autophagosome regulators (beclin-1 and LC3-II) by western blot (a) and densitometry (b). (c)-(d) Electron microscopic imaging revealed higher population of autophagic vacuoles engulfing mitochondria (indicated by arrows) in MDA-MB-231 (d) than in MCF-10A (c) cells. See supplemental Figure 2 for images at a higher magnification. (e)-(f) Measurement of autophagic flux by western blot (e) and densitometry (f). Autophagic flux was calculated as the difference between LC3-II levels in the absence (0 hr) and presence (4 hr) of autolysosome inhibitors bafilomycin A1 (0.1 mu M) and leupeptin (10 mu g/mL); n = 3-5; * p < 0.05, ** p < 0.01, and *** p < 0.001.
- Submitted by
- Invitrogen Antibodies (provider)
- Main image

- Experimental details
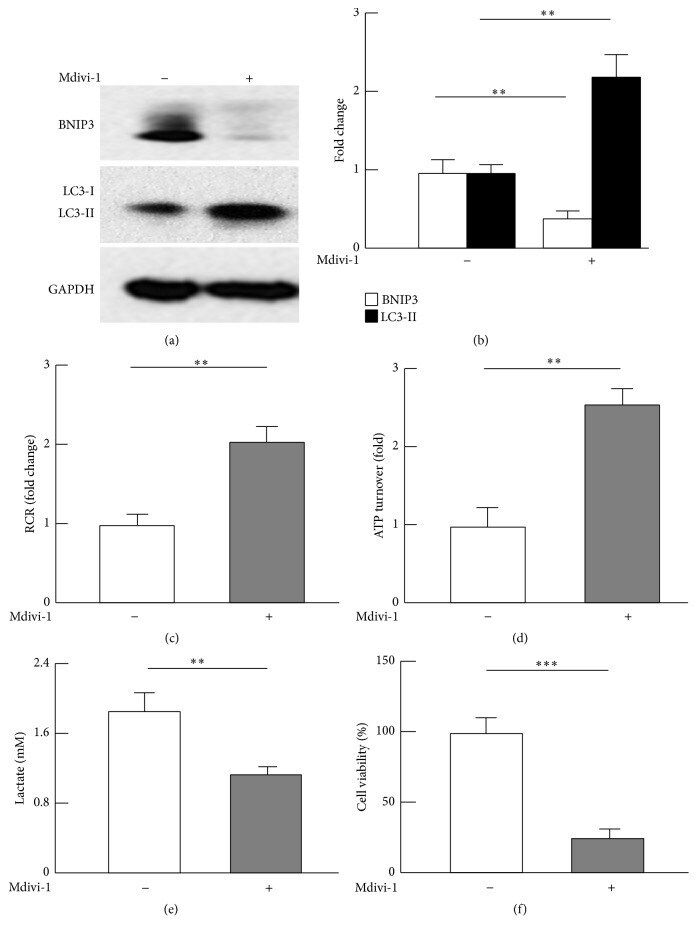
- Figure 5 Effects of Drp1 inhibitor Mdivi-1 on mitochondrial autophagy, metabolism, and viability of MDA-MB-231 cancer cells. (a)-(b) Mdivi-1 suppressed mitophagy marker BNIP3 and caused accumulation of LC3-II, indicative of reduced autophagic flux. MDA-MB-231 cells were cultured and treated with Mdivi-1 as described in the Materials and Methods, and the protein levels were analyzed by western blot (a) and densitometric (b) analysis; n = 3-5. (c)-(d) Mdivi-1 promoted mitochondrial oxidative capacity, as evaluated by respiratory control ratios (RCR) and ATP turnover. (e) Mdivi-1 suppressed glycolysis ( n = 3). (f) Mdivi-1 reduced breast cancer cell viability ( n = 5-7). ** p < 0.01 and *** p < 0.001.
- Submitted by
- Invitrogen Antibodies (provider)
- Main image

- Experimental details
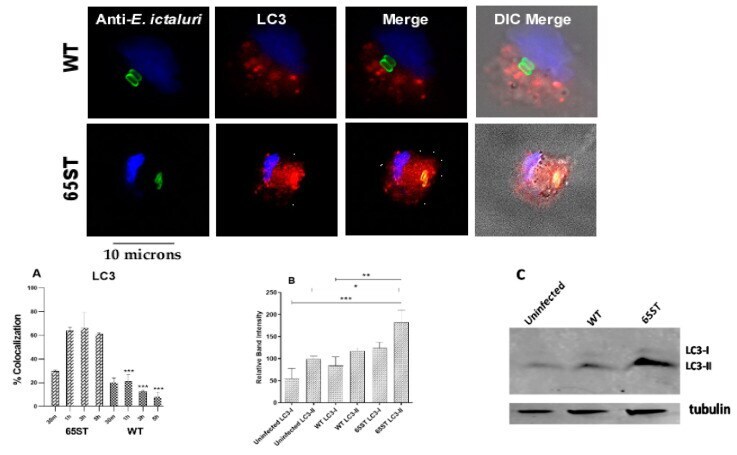
- Figure 3 Immunofluorescent micrograph showing the subcellular localization of WT and 65ST mutant of E. ictaluri (green) in relation to the autophagy marker LC3 (red) 3 h post-infection. The host cell nucleus is blue and the host cell is visible in DIC in the merged image. ( A ) Percentage of co-localization of E. ictaluri ECV with the autophagy marker LC3. Data are represented as the mean and standard error of the mean for three independent experiments. Asterisks indicate significant difference between WT and 65ST at different time points. (*** = p
- Submitted by
- Invitrogen Antibodies (provider)
- Main image
- Experimental details
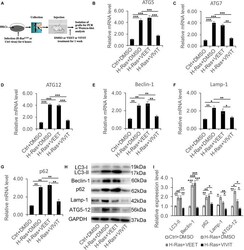
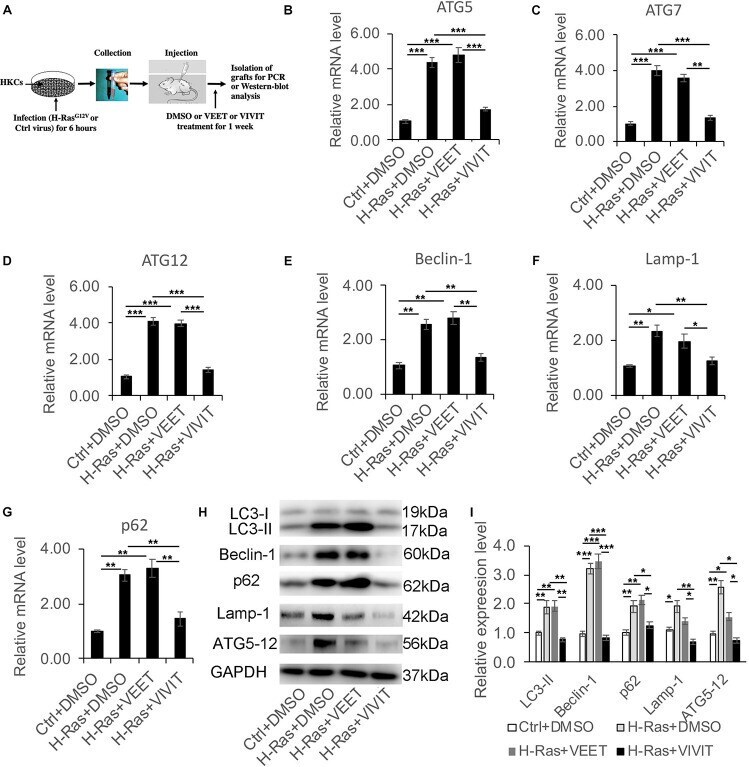
- FIGURE 3 Nuclear factor of activated T cells inhibitor VIVIT suppresses the increased expression of autophagy-associated genes induced by the overexpression of H-Ras in vivo . (A) Scheme of the in vivo assay: Human keratinocytes (HKCs) were infected with a H-Ras G12V expressing or a control retrovirus for 6 h, then were subcutaneously injected into the dorsal skin of NU/NU mice, after which the mice were treated with DMSO, VEET, or VIVIT by intraperitoneal injection. One week later, the grafts were collected for RT-PCR and western-blot analysis of autophagy-associated genes. (B-G) RT-PCR analysis of autophagy-associated genes as indicated from the grafts collected as shown in panel (A). (H) The grafts collected were lysed for immunoblotting analysis of autophagy-associated genes LC3, Beclin-1, p62, Lamp-1, and ATG5-12, GAPDH as a loading control. (I) Quantification of western-blot analysis shown in panel (H) for the relative expression levels of LC3, Beclin-1, p62, Lamp-1, and ATG5-12. Four mice ( n = 4) were used in each group, and error bars represent means +- SD; p values are indicated with ""*,"" * p < 0.05, ** p < 0.01, *** p < 0.005 when comparing two corresponding groups indicated with the black lines by Student's t -test.
- Submitted by
- Invitrogen Antibodies (provider)
- Main image
- Experimental details
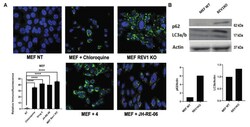
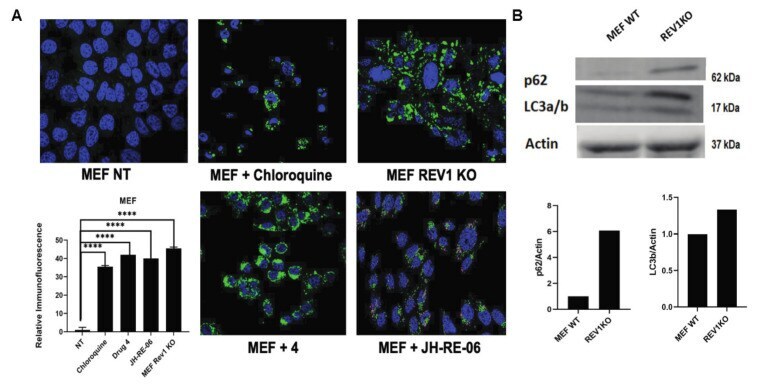
- Figure 3 REV1 inhibition triggers autophagy. ( A ) Immunofluorescence images show autophagy flux (green) in MEF WT cells treated with chloroquine (positive control), drug 4 (7922759), and JH-RE-06, with REV1KO cells as validation controls. The graph shows relative quantification of the cells expressing the green fluorescence signal. p -Values are **** p < 0.0001. Error bars represent standard deviations. p -Values were calculated by t -test. N >= 50. Images are at 40x. ( B ) Representative image of a Western blot showing expression of p62 and LC3a in MEF REV1 KO cells compared to the WT MEF. Graph shows relative quantification.
- Submitted by
- Invitrogen Antibodies (provider)
- Main image
- Experimental details
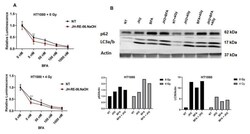
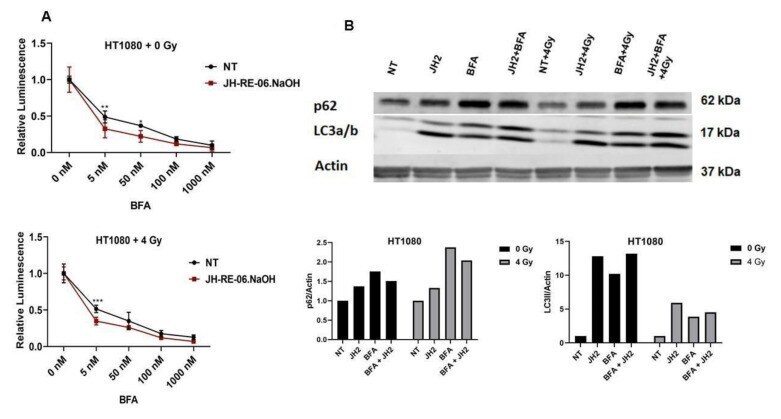
- Figure 4 Autophagy inhibition has a narrow range for sensitizing cancer cells treated with ionizing radiation and REV1 inhibitors. ( A ) Graphs show relative luminescence in HT1080 cells treated with 0 or 4 Gy ionizing radiation in the presence of increasing doses of autophagy inhibitor BFA and 1 uM of JH-RE-06.NaOH. ( B ) Representative Western blot images show expression patterns of p62 and LC3a/b in HT1080 cells treated with JH-RE-06.NaOH at 1 mM, BFA at 50 mM, and ionizing radiation at 0 and 4 Gy, respectively. Graphs show relative quantification of p62 and LC3a/b expression in HT1080 cells from the Western blots above. p -Values are * p < 0.05, ** p < 0.01, and *** p < 0.001. Error bars represent standard deviations. p values were calculated by 2-way ANOVA. N = 6 for all values.
- Submitted by
- Invitrogen Antibodies (provider)
- Main image
- Experimental details
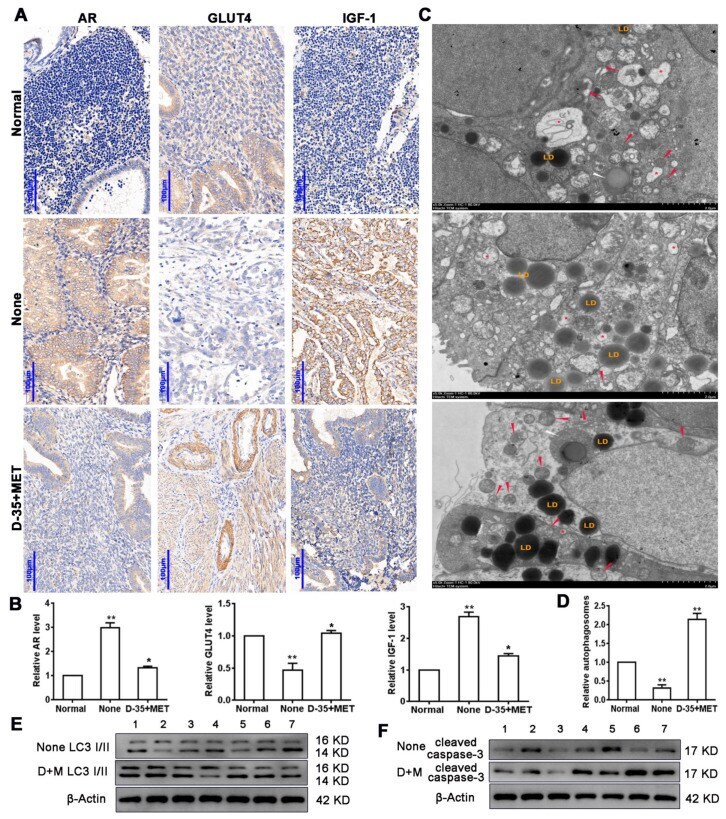
- Figure 1 Diane-35 and metformin reduced AR and IGF-1 expression and increased GLUT4 expression in the early-stage tumor tissue of PCOS patients with EC. Immunohistochemistry ( A ) and PCR analysis ( B ) for AR, GLUT4, and IGF-1 in endometrial carcinoma tissue, scale bars = 100 mum. Transmission electron microscope analysis of patients' tissues: autophagosomes: red arrow, autolysosome: white arrow, lysosome: red asterisk, and lipid droplet: LD, scale bars = 2 mum ( C , D ). Western blotting analysis of LC3 I/II ( E ) and cleaved caspase-3 ( F ) expression levels from 7 different patient samples. Data are shown as the mean +- S.D. * p < 0.05 and ** p < 0.01, ANOVA.
- Submitted by
- Invitrogen Antibodies (provider)
- Main image
- Experimental details
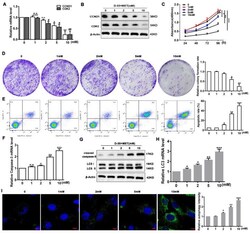
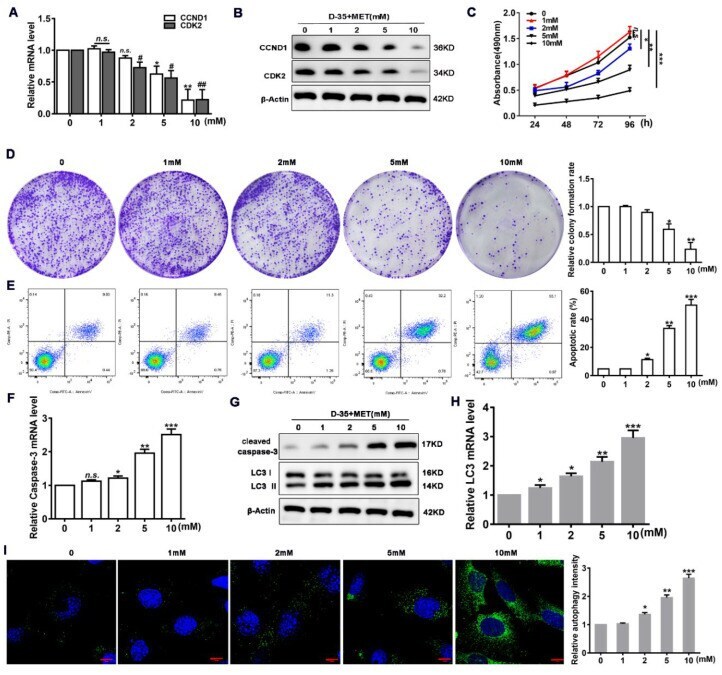
- Figure 2 Diane-35 and metformin promote apoptosis and autophagy in EC cells. Human endometrial carcinoma (Ishikawa) cells were treated with increasing concentrations of Diane-35 and metformin (0, 1, 2, 5, and 10 mM) for 24 h. Then, qRT-PCR ( A ) and Western blot ( B ) analyses were used to assess cell proliferation genes CCND1and CDK2 and protein expression. CCK-8 ( C ) and colony formation assay ( D ) were used to evaluate proliferation, and flow cytometry ( E ) was performed to assess apoptosis. Apoptotic biomarker, cleaved caspase-3, was assessed by qRT-PCR ( F ) and Western blot ( G ) analyses. Cell autophagic markers were assessed by qRT-PCR ( H ), Western blotting ( G ), and immunofluorescence staining for LC3 (green) and DAPI (blue) ( I ). Data are shown as the mean +- S.D., n = 3. n.s. = no statistically significant differences. * p < 0.05, # p < 0.05, ** p < 0.01, ## p < 0.01 and *** p < 0.001, ANOVA. Scale bars = 10 mum.
- Submitted by
- Invitrogen Antibodies (provider)
- Main image
- Experimental details
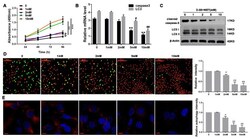
- Figure 3 Diane-35 and metformin repressed ovarian granulosa cells apoptosis in a murine model of PCOS. Ovarian granulosa cells were isolated from mice ovaries. Then, cells were treated with increasing concentrations of Diane-35 and metformin (0, 1, 2, 5, and 10 mM) for 24 h. A CCK-8 assay was performed to measure cell viability ( A ). RT-PCR ( B ) and Western blotting ( C ) were used to detect cleaved caspase-3 and LC3 expression in granulosa cells. Granulosa cells apoptosis was determined by the Tunel assay, scale bars = 100 mum ( D ). Immunofluorescence assay was performed using LC3 I/II antibody, red for LC3, scale bars = 10 mum ( E ). Data are shown as the mean +- S.D., n = 3. n.s. = no statistically significant differences. * p < 0.05, # p < 0.05, ** p < 0.01, ## p < 0.01 and *** p < 0.001, ANOVA.

- Submitted by
- Invitrogen Antibodies (provider)
- Main image

- Experimental details
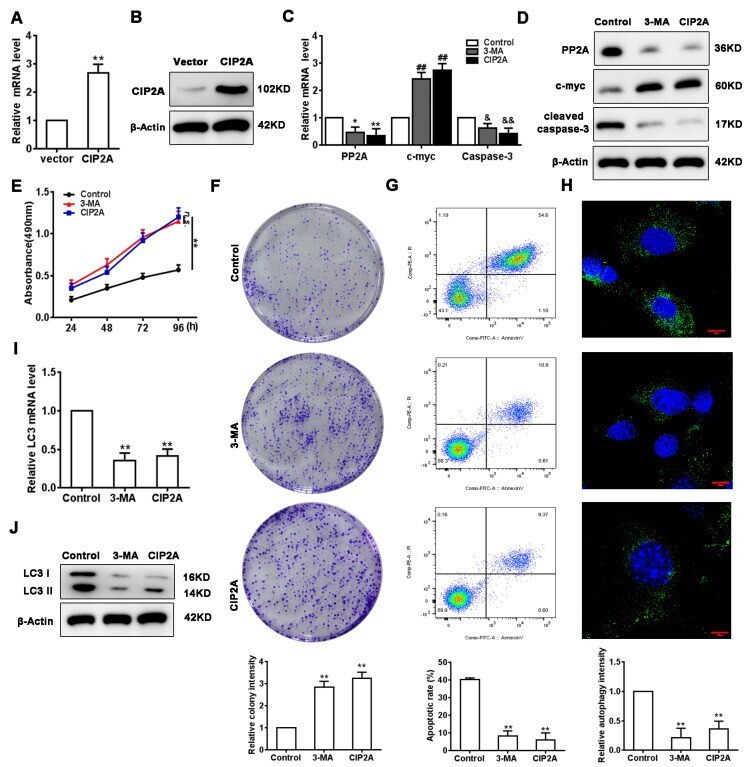
- Figure 6 Verification of the PI3K/mTORC1 pathway on Diane-35 and metformin-mediated autophagy. ( A , B ) Transfection efficiency of the CIP2A overexpression system in Ishikawa cells. ( C , D ) mRNA and protein levels of PP2A, c-Myc, and cleaved caspase-3 in cells subjected to different treatments. CCK-8 ( E ), colony formation ( F ), and flow cytometry ( G ) were performed to measure apoptosis in Ishikawa cells after pretreatment with 3-methyladenine (3-MA, 5mM) or transfection with the CIP2A overexpression vector. All the cells were treated with Diane-35 and metformin (10 mM). ( H - J ) Cell autophagy was determined using the LC3 level measured by qRT-PCR, Western blotting, and immunofluorescence. Data are shown as the mean +- S.D. n.s. = no statistically significant differences. * p < 0.05, & p < 0.05, and ** p < 0.01, ## p < 0.05, && p < 0.01, ANOVA. Scale bars = 10 mum.
- Submitted by
- Invitrogen Antibodies (provider)
- Main image
- Experimental details
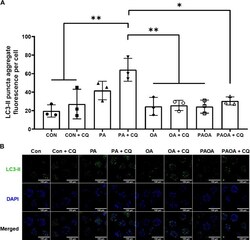
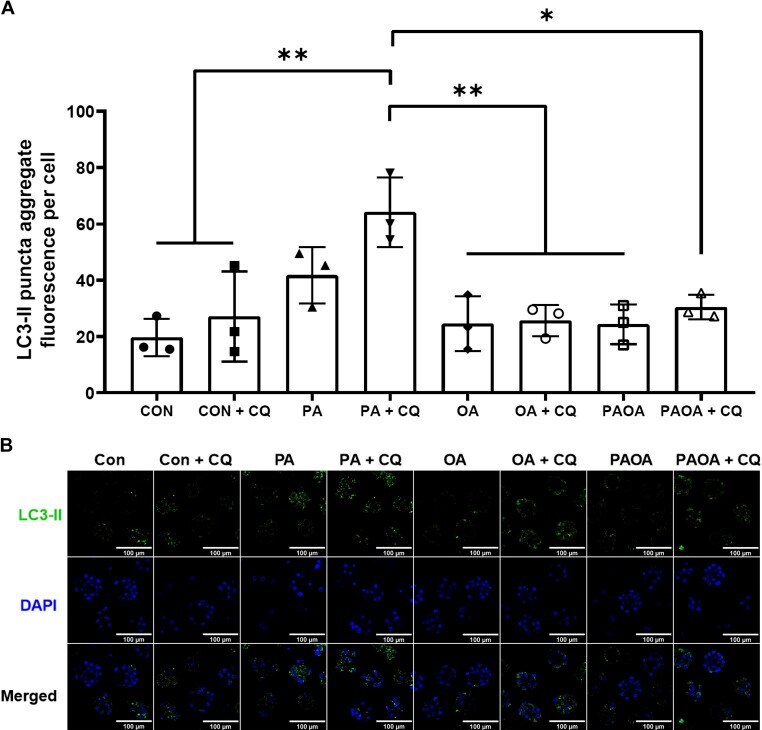
- Figure 7. Autophagosome formation of embryos after NEFA +- CQ treatment for 40 h. A : LC3-II puncta aggregate fluorescence per cell (+-SD) after 40 h of treatment with 100 uM PA, 250 uM OA, 100 uM PA and 250 uM OA, or KSOMaa medium alone (control), with 75 uM chloroquine (CQ) treatment for the last 2 h. Only embryos of 8-cell stage and later were included. n = 3, one-way ANOVA and Tukey's HSD post hoc test. Significant differences are indicated by * P < 0.05 and ** P < 0.01. After CQ treatment, fluorescence of LC3-II puncta aggregate per cell of PA group was significantly higher than other treatment groups [ P = 0.0047 (vs. control + CQ); P = 0.0032 (vs. OA + CQ); P = 0.0106 (vs. PA + OA + CQ)], suggesting a higher level of autophagosome formation in the PA group. B : representative images of LC3-II aggregate puncta formation after NEFA +- CQ treatment for 40 h. Scale bars = 100 um. Con, control; HSD, honestly significant difference; KSOMaa, potassium simplex optimization media with amino acid; LC3, light chain 3; NEFA, nonesterified fatty acid; OA, oleic acid; PA, palmitic acid.
- Submitted by
- Invitrogen Antibodies (provider)
- Main image
- Experimental details
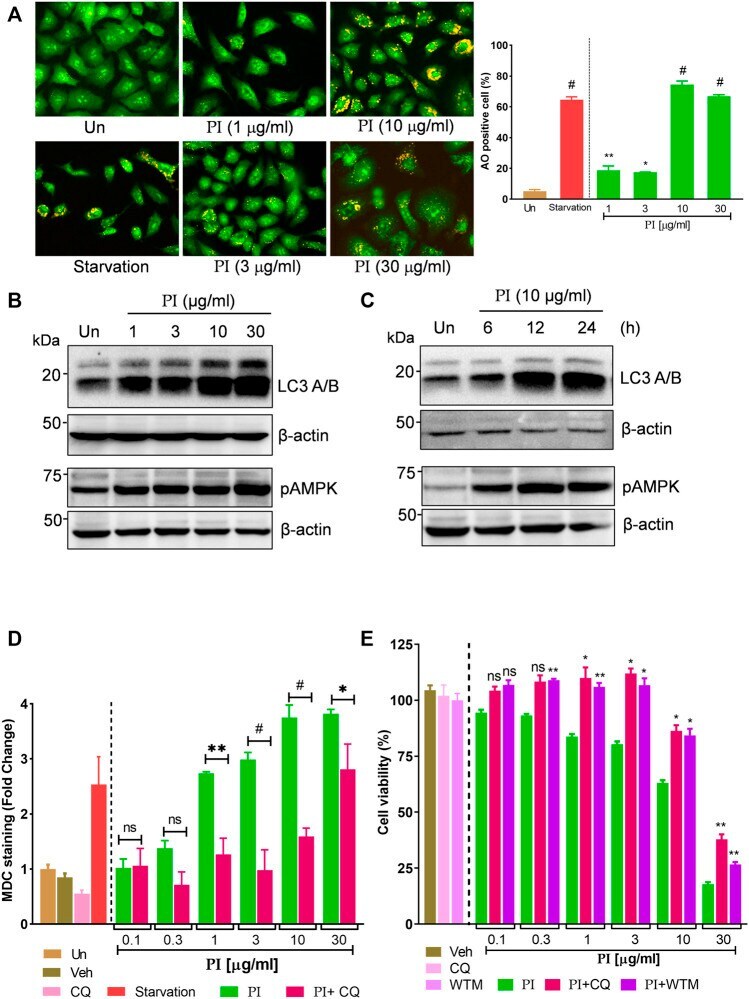
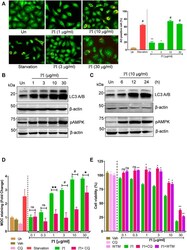
- FIGURE 4 Pistacia integerrima induces AMPK-dependent autophagic cell death in lung cancer cells. (A) Acridine orange staining of A549 cells post 24 h treatment with PI at indicated doses. Each image is zoomed in to clearly show the acidic vacuoles. The right panel shows the percentage of cells positive for acidic vesicular organelles (AO) in each treatment. Significance is evaluated with respect to untreated. (B) Whole cell lysates of A549 cells, post 24 h of treatment at indicated doses, were subjected to Western blotting using antibodies against LC3 A/B and pAMPK. beta -Actin served as a loading control. (B) Whole cell lysates of A549 cells treated at 10 mug/ml of PI for 6, 12, and 24 h time periods were subjected to Western blotting using antibodies against LC3 A/B and pAMPK. beta -Actin served as the loading control. (D) A549 cells treated with PI alone or together with chloroquine (CQ) for 24 h were stained with MDC. Fluorescence was expressed as fold change with respect to untreated. A significant difference in fold change of MDC staining is calculated in PI + CQ treatment with respect to PI. (E) Cell viability with Alamar blue was assessed in A549 cells treated with indicated treatments for 24 h. Cells were treated with chloroquine (CQ) at 10 muM and wortmannin (WTM) at 500 nM concentration. Significance in PI + CQ and PI + WTM is calculated with respect to PI alone. Error bars represent mean +- SEM; significance of data represented as * p < 0.05, ** p < 0.005, *** p