Explore
 Validate
 Learn
LearnPA5-22990
antibody from Invitrogen Antibodies
Targeting: MAP1LC3A
ATG8E, LC3, LC3A, MAP1ALC3, MAP1BLC3
 Western blot
 Immunocytochemistry
Antibody data
- Antibody Data
- Antigen structure
- References [2]
- Comments [0]
- Validations
- Immunocytochemistry [2]
- Immunohistochemistry [2]
- Flow cytometry [1]
- Other assay [1]
Submit
Validation data
Reference
Comment
Report error
- Product number
- PA5-22990 - Provider product page

- Provider
- Invitrogen Antibodies
- Product name
- LC3A Polyclonal Antibody
- Antibody type
- Polyclonal
- Antigen
- Recombinant full-length protein
- Description
- In ICC/IF, autophagosome formation has been seen in HeLa cells after treatment with 50uM chloroquine. Suggested positive control: human brain lysate, LC3 overexpression lysate.
- Reactivity
- Human, Mouse, Rat, Bovine, Zebrafish
- Host
- Rabbit
- Isotype
- IgG
- Vial size
- 100 μL
- Concentration
- 1.0 mg/mL
- Storage
- Store at 4°C short term. For long term storage, store at -20°C, avoiding freeze/thaw cycles.
Submitted references Involvement of the TNF-α/SATB2 axis in the induced apoptosis and inhibited autophagy of osteoblasts by the antipsychotic Risperidone.
Diethylstilbestrol (DES) induces autophagy in thymocytes by regulating Beclin-1 expression through epigenetic modulation.
Zhang S, He W, Li A, Zhao C, Chen Y, Xu C, Zhang Q, Zheng D, Chen M, Miao H, Huang Y
Molecular medicine (Cambridge, Mass.) 2022 May 3;28(1):46
Molecular medicine (Cambridge, Mass.) 2022 May 3;28(1):46
Diethylstilbestrol (DES) induces autophagy in thymocytes by regulating Beclin-1 expression through epigenetic modulation.
Singh NP, Miranda K, Singh UP, Nagarkatti P, Nagarkatti M
Toxicology 2018 Dec 1;410:49-58
Toxicology 2018 Dec 1;410:49-58
No comments: Submit comment
Supportive validation
- Submitted by
- Invitrogen Antibodies (provider)
- Main image

- Experimental details
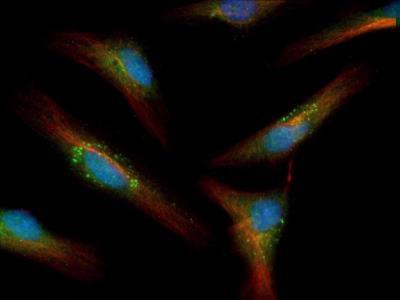
- Immunocytochemistry analysis of LC3A in HeLa cells. Samples were incubated in LC3A polyclonal antibody (Product # PA5-22990) followed by DyLight 488 (green). Cells were treated overnight with 50 µM chloroquine to induce autophagosome formation. Nuclei and alpha-tubulin were counterstained with DAPI (blue) and DyLight 550 (red).
- Submitted by
- Invitrogen Antibodies (provider)
- Main image

- Experimental details
- Immunocytochemistry analysis of LC3A in HeLa cells. Samples were incubated in LC3A polyclonal antibody (Product # PA5-22990) followed by DyLight 488 (green). Cells were treated overnight with 50 µM chloroquine to induce autophagosome formation. Nuclei and alpha-tubulin were counterstained with DAPI (blue) and DyLight 550 (red).

Supportive validation
- Submitted by
- Invitrogen Antibodies (provider)
- Main image
- Experimental details
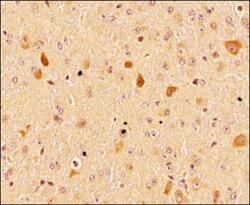
- Immunohistochemical analysis of LC3A in formalin-fixed paraffin-embedded tissue section of mouse brain. Samples were incubated in LC3A polyclonal antibody (Product # PA5-22990) using a dilution of 1:300 followed by a HRP-labeled secondary antibody and DAB reagent. The sections/nuclei were further counterstained with hematoxylin. Note the diffused cytoplasmic staining of LC3 in all of the cells with highest positivity in various neurons.
- Submitted by
- Invitrogen Antibodies (provider)
- Main image
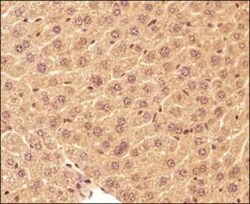
- Experimental details
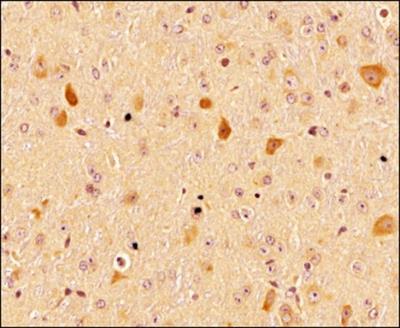
- Immunohistochemical analysis of LC3A in formalin-fixed paraffin-embedded tissue section of mouse liver. Samples were incubated in LC3A polyclonal antibody (Product # PA5-22990) using a dilution of 1:300 followed by a HRP-labeled secondary antibody and DAB reagent. The sections/nuclei were further counterstained with hematoxylin. Note the diffused cytoplasmic staining of LC3 in all of the hepatocytes and other liver cells.

Supportive validation
- Submitted by
- Invitrogen Antibodies (provider)
- Main image
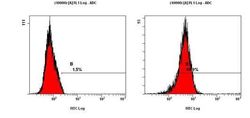
- Experimental details
- Flow cytometry analysis of LC3A using a polyclonal antibody (Product # PA5-22990).

Supportive validation
- Submitted by
- Invitrogen Antibodies (provider)
- Main image
- Experimental details
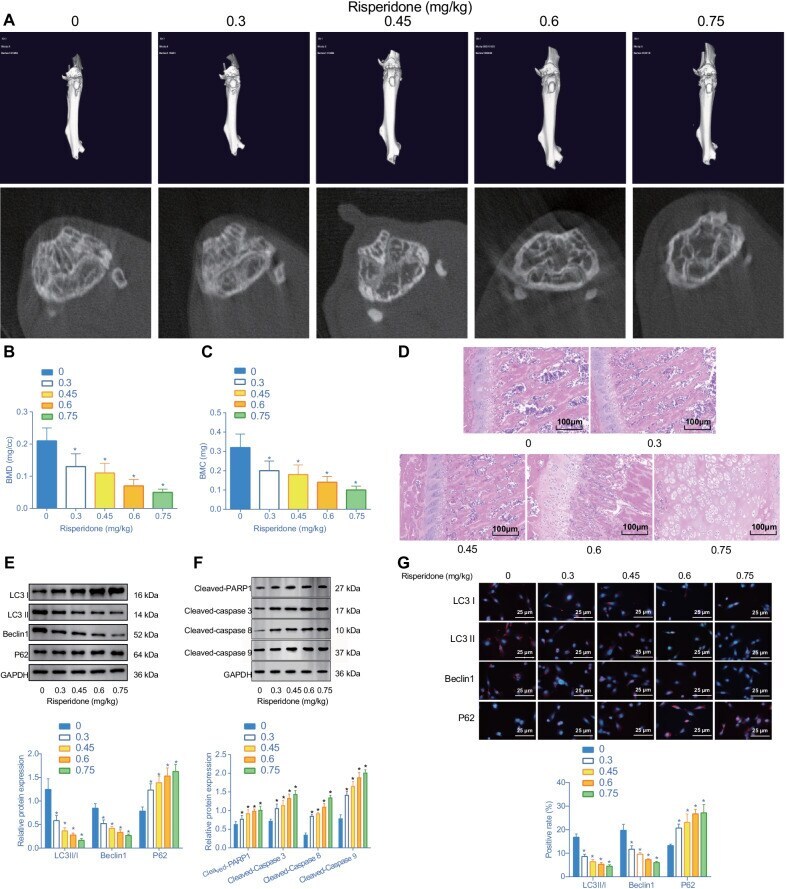
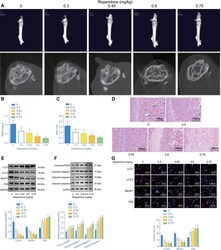
- Risperidone causes an inhibition of autophagy and a promotion of apoptosis in femur tissues of mice. Mice were treated with 0, 0.3, 0.45, 0.6, 0.75 mg/kg of Risperidone. A representative micro-CT 3D and plan scan images of cross-sectional area of femur tissues. B statistical analysis of BMD in femur tissues of mice assessed by micro-CT. C statistical analysis of BMC in femur tissues of mice. D representative images of HE staining in femur tissues of mice. E Western blot analysis of autophagy-related proteins (LC3 II/I, Beclin1, and p62) expression in femur tissues of mice. The band intensity was assessed. F Western blot analysis of apoptosis-related proteins (cleaved PARP1, cleaved caspase-3, cleaved caspase-8 and cleaved caspase-9). Different numbers represent different concentrations of Risperidone (mg/kg). G co-localization of LC3 II (red), LC3 I (red), Beclin1 (red), and p62 (red) with the osteoblast marker RUNX2 (green) by double-labeled immunofluorescence, wherein the nucleus is labeled by DAPI (blue). * p < 0.05, compared with the treatment of 0 mg/kg of Risperidone. The experiments are repeated 3 times