Explore
 Validate
 Learn
Learn Western blot
 Immunocytochemistry
Antibody data
- Antibody Data
- Antigen structure
- References [1]
- Comments [0]
- Validations
- Immunocytochemistry [5]
- Immunohistochemistry [4]
- Other assay [3]
Submit
Validation data
Reference
Comment
Report error
- Product number
- PA5-62086 - Provider product page

- Provider
- Invitrogen Antibodies
- Product name
- SRSF2 Polyclonal Antibody
- Antibody type
- Polyclonal
- Antigen
- Recombinant full-length protein
- Description
- Immunogen sequence: LKVDNLTYRT SPDSLRRVFE KYGRVGDVYI PR Highest antigen sequence identity to the following orthologs: Mouse - 97%, Rat - 97%.
- Reactivity
- Human
- Host
- Rabbit
- Isotype
- IgG
- Vial size
- 100 μL
- Concentration
- 0.20 mg/mL
- Storage
- Store at 4°C short term. For long term storage, store at -20°C, avoiding freeze/thaw cycles.
Submitted references A splicing factor switch controls hematopoietic lineage specification of pluripotent stem cells.
Li Y, Wang D, Wang H, Huang X, Wen Y, Wang B, Xu C, Gao J, Liu J, Tong J, Wang M, Su P, Ren S, Ma F, Li HD, Bresnick EH, Zhou J, Shi L
EMBO reports 2021 Jan 7;22(1):e50535
EMBO reports 2021 Jan 7;22(1):e50535
No comments: Submit comment
Supportive validation
- Submitted by
- Invitrogen Antibodies (provider)
- Main image

- Experimental details
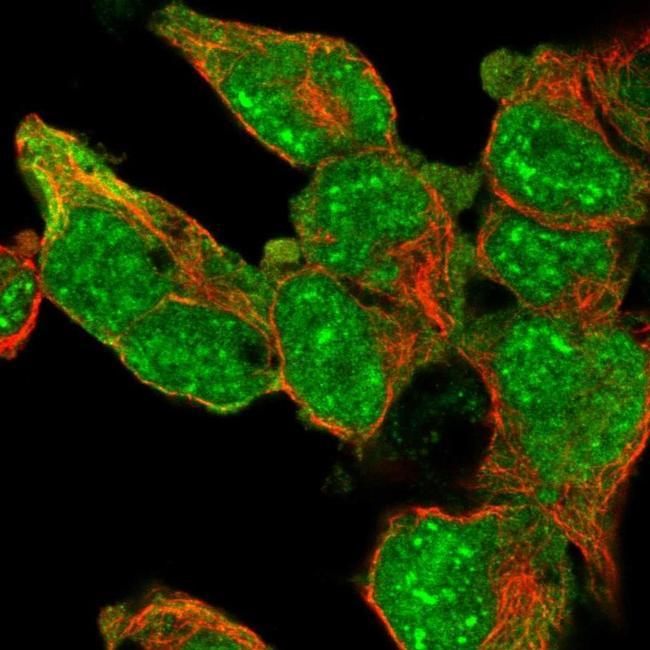
- Immunofluorescent staining of SRSF2 in human cell line HEK 293 shows positivity in nucleus & cytoplasm. Samples were probed using a SRSF2 Polyclonal Antibody (Product # PA5-62086).
- Submitted by
- Invitrogen Antibodies (provider)
- Main image
- Experimental details
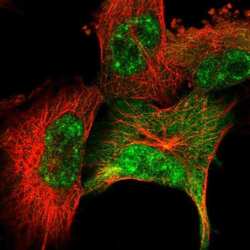
- Immunofluorescent staining of SRSF2 in human cell line U-251 MG using a SRSF2 Polyclonal Antibody (Product # PA5-62086) shows localization to nuclear speckles and cytosol.

- Submitted by
- Invitrogen Antibodies (provider)
- Main image
- Experimental details
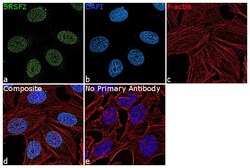
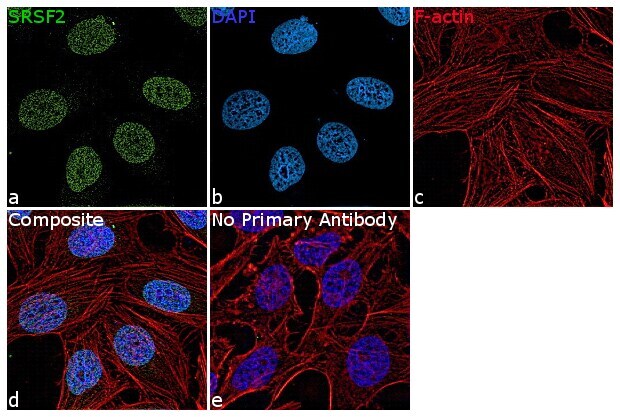
- Immunofluorescence analysis of SRSF2 was performed using HeLa cells. The cells were fixed with 4% paraformaldehyde for 10 minutes, permeabilized with 0.1% Triton™ X-100 for 15 minutes, and blocked with 2% BSA for 1 hour at room temperature. The cells were labeled with SRSF2 Polyclonal Antibody (Product # PA5-62086) at 5 µg/mL in 0.1% BSA, incubated at 4 degree Celsius overnight and then labeled with Goat anti-Rabbit IgG (H+L) Superclonal™ Recombinant Secondary Antibody, Alexa Fluor® 488 conjugate (Product # A27034) at a dilution of 1:2000 for 45 minutes at room temperature (Panel a: green). Nuclei (Panel b: blue) were stained with ProLong™ Diamond Antifade Mountant with DAPI (Product # P36962). F-actin (Panel c: red) was stained with Rhodamine Phalloidin (Product # R415, 1:300). Panel d represents the merged image showing nuclear localization. Panel e represents control cells with no primary antibody to assess background. The images were captured at 60X magnification.
- Submitted by
- Invitrogen Antibodies (provider)
- Main image

- Experimental details
- Immunofluorescent staining of SRSF2 in human cell line U-251 MG using a SRSF2 Polyclonal Antibody (Product # PA5-62086) shows localization to nuclear speckles and cytosol.

- Submitted by
- Invitrogen Antibodies (provider)
- Main image

- Experimental details
- Immunofluorescence analysis of SRSF2 was performed using HeLa cells. The cells were fixed with 4% paraformaldehyde for 10 minutes, permeabilized with 0.1% Triton™ X-100 for 15 minutes, and blocked with 2% BSA for 1 hour at room temperature. The cells were labeled with SRSF2 Polyclonal Antibody (Product # PA5-62086) at 5 µg/mL in 0.1% BSA, incubated at 4 degree Celsius overnight and then labeled with Goat anti-Rabbit IgG (Heavy Chain) Superclonal™ Recombinant Secondary Antibody, Alexa Fluor® 488 conjugate (Product # A27034) at a dilution of 1:2000 for 45 minutes at room temperature (Panel a: green). Nuclei (Panel b: blue) were stained with ProLong™ Diamond Antifade Mountant with DAPI (Product # P36962). F-actin (Panel c: red) was stained with Rhodamine Phalloidin (Product # R415, 1:300). Panel d represents the merged image showing nuclear localization. Panel e represents control cells with no primary antibody to assess background. The images were captured at 60X magnification.

Supportive validation
- Submitted by
- Invitrogen Antibodies (provider)
- Main image
- Experimental details
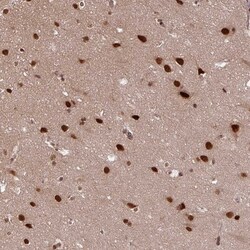
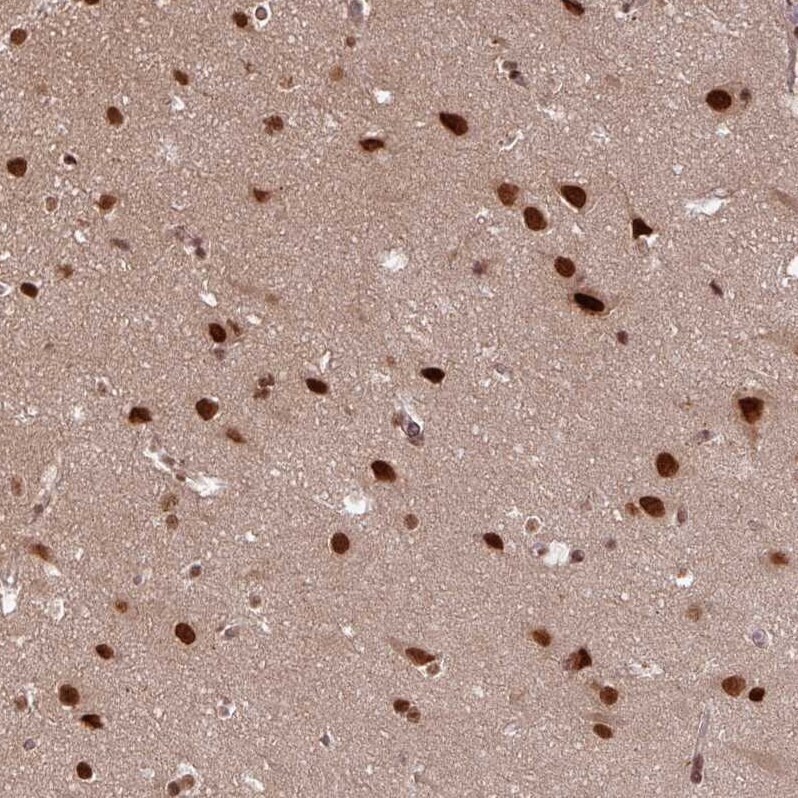
- Immunohistochemical staining of SRSF2 in human cerebral cortex using SRSF2 Polyclonal Antibody (Product # PA5-62086) shows strong nuclear positivity in neurons.
- Submitted by
- Invitrogen Antibodies (provider)
- Main image
- Experimental details
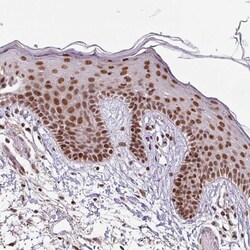
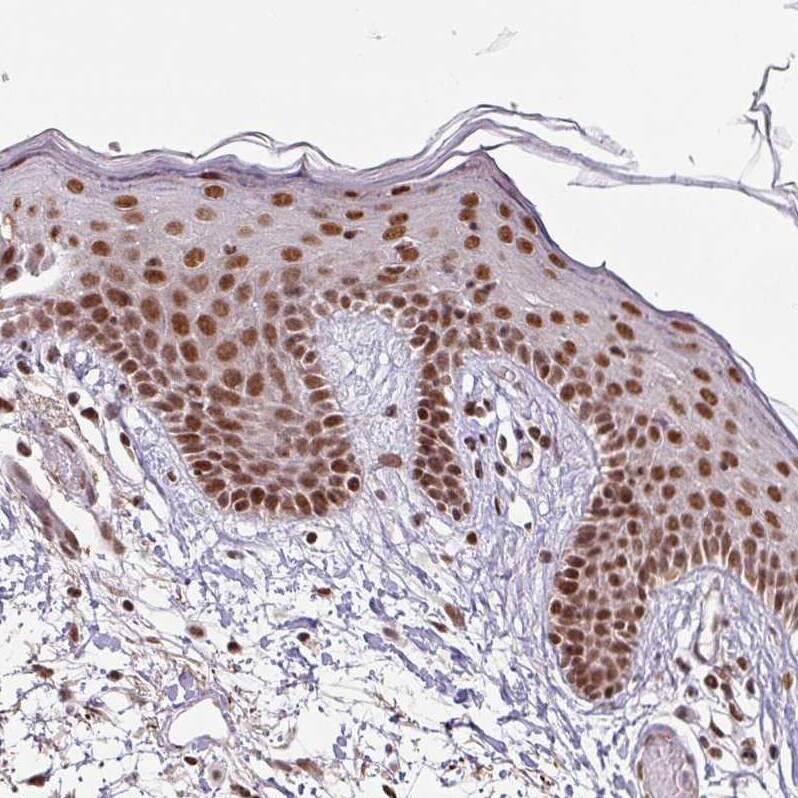
- Immunohistochemical staining of SRSF2 in human skin using SRSF2 Polyclonal Antibody (Product # PA5-62086) shows moderate to strong nuclear positivity in squamous epithelial cells.
- Submitted by
- Invitrogen Antibodies (provider)
- Main image
- Experimental details
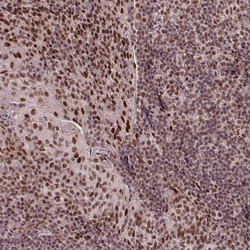
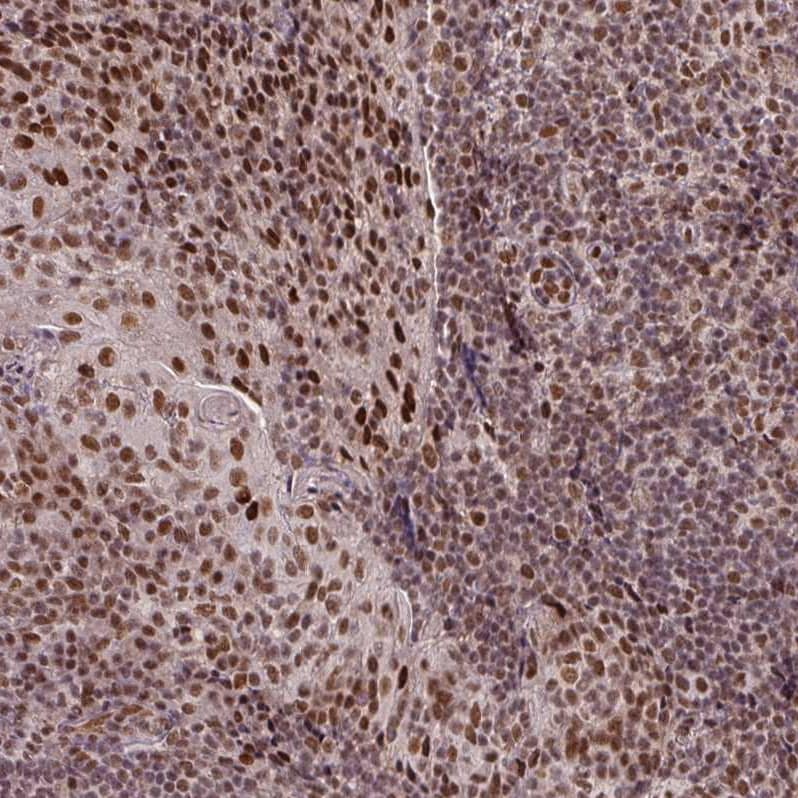
- Immunohistochemical staining of SRSF2 in human tonsil using SRSF2 Polyclonal Antibody (Product # PA5-62086) shows moderate to strong nuclear positivity in germinal center cells.
- Submitted by
- Invitrogen Antibodies (provider)
- Main image

- Experimental details
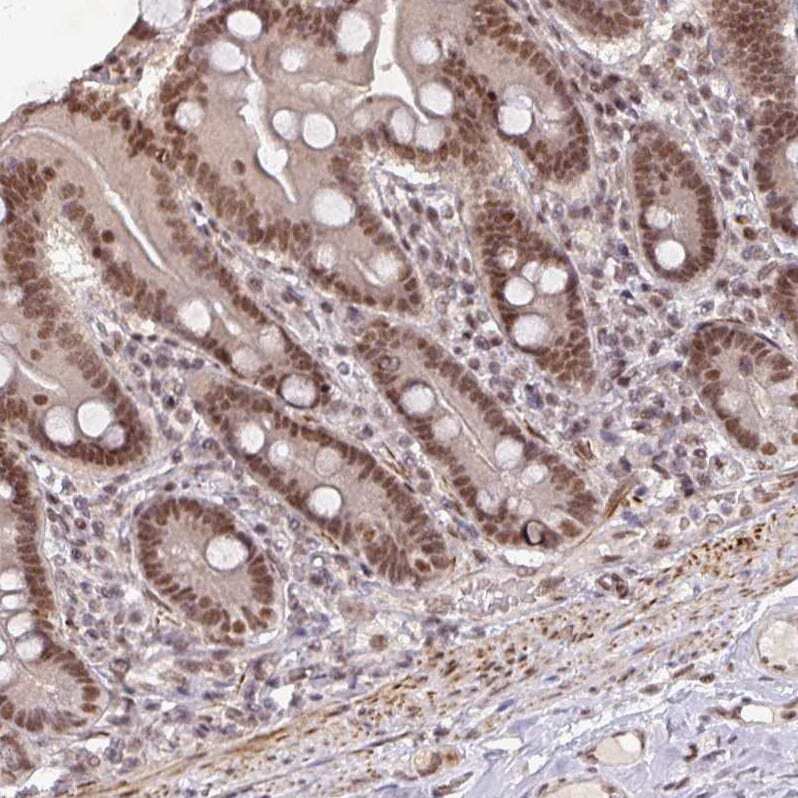
- Immunohistochemical staining of SRSF2 in human duodenum using SRSF2 Polyclonal Antibody (Product # PA5-62086) shows moderate nuclear positivity in glandular cells.
Supportive validation
- Submitted by
- Invitrogen Antibodies (provider)
- Main image
- Experimental details
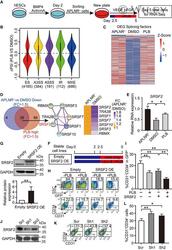
- 3 Figure Disruption of the splicing factor switch impacts EPC specification The schematic depicting experimental strategy for RNA-Seq. APLNR + cells on day 2 were FACS-purified and treated with 1.25 nM or 2.5 nM PLB from day 2.5 to 5 during hematopoietic differentiation. Then, the day 2-purified APLNR + cells, day 5-differentiated cells with or without PLB treatment were harvested for RNA-Seq. n = 2 technical replicates. The violin plot represents distributions of statistically significant DeltaPSI for different types of splicing events by comparison of PLB-treated cells vs DMSO control. The number of differential splicing events regulated by 2.5 nM PLB is denoted in brackets. we analyzed the differential splicing events with genes FPKM > 1 in at least one differentiation stage. Among them, the cutoffs of PSI > 0.2 and FDR < 0.05 were used to define differential splicing events. The dotted line indicates DeltaPSI = 0. The heatmap shows the expression of differentially expressed splicing factors in APLNR + cells, day 5-differentiated cells treated with DMSO or 2.5 nM PLB. The differentially expressed splicing factors were defined as fold change of FPKM > 1.5 between APLNR + cells and DMSO-treated cells. The heatmap was scaled with Z-Score using the log 2 (FPKM) expression of differentially expressed splicing factors. n = 2 technical replicates. The Venn diagram presents the intersection between highly expressed genes in APLNR + cells (APLNR + cells vs. DMSO-treated cells; FC >

- Submitted by
- Invitrogen Antibodies (provider)
- Main image
- Experimental details
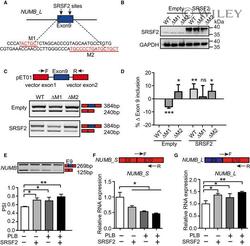
- 5 Figure Splicing factor SRSF2 modulates NUMB exon 9 splicing A The putative SRSF2 binding motifs on NUMB exon 9 (labeled as red), predicted by RBPmap. M1 refers to motif 1 and M2 refers to motif 2. B Western blotting showing the overexpression of SRSF2 in 293T cells, which was co-transfected with NUMB reporters of WT, DeltaM1, or DeltaM2. DeltaM1 or DeltaM2 represents plasmid deleting corresponding binding site. C A minigene splicing reporter assay showing SRSF2 promoted the generation of NUMB_L isoform via M1 but not M2. The upper panel indicating the pET01 vector that contains two constitutive NUMB exons. The representative RT-PCR electropherogram showing the expression of NUMB_L and NUMB_S isoforms in WT, DeltaM1, or DeltaM2 transfected 293T cells with or without SRSF2 overexpression, respectively. D The bar graph showing the normalized exon 9 inclusion from the RT-PCR electropherogram of (C) to the WT control cells. P -values were determined by an unpaired two-tailed Student's t -test. E On day 5 of hematopoietic differentiation, the inclusion or exclusion of NUMB exon 9 were detected by RT-PCR with 1.25 nM PLB supplementation or SRSF2 exogenous expression alone or their combinational treatment from day 2.5. The bar graph showing the signaling intensity of each specific band from the RT-PCR electropherogram. F, G The top panel depicts the location of specific primers targeting NUMB_S and NUMB_L isoform. The bottom bar graph showing the expression of NUMB_S and NUMB_L in

- Submitted by
- Invitrogen Antibodies (provider)
- Main image
- Experimental details
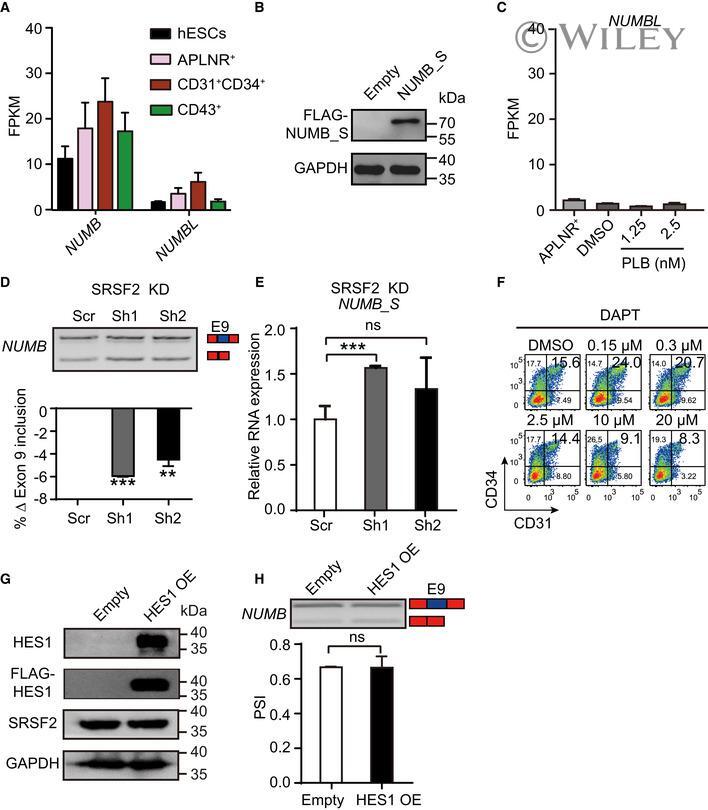
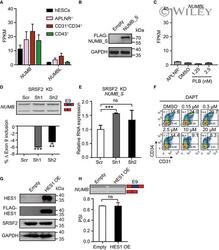
- EV5 Figure NUMB Expression and its splicing regulation Expression of NUMB and its family member NUMBLIKE ( NUMBL ) during human hematopoietic development by RNA-Seq. Western blotting showing NUMB-S overexpression upon DOX induction with anti-FLAG antibody. The GAPDH gene was used as a loading control. Expression of NUMBL in day 2-APLNR + cells, day 5-DMSO-treated, and day 5-PLB-treated cells. The upper panel is a representative RT-PCR electropherogram showing the inclusion or exclusion of NUMB exon 9 in SRSF2 depleted cells on day 5 of differentiation. The bar graph showing the changes of exon 9 inclusion obtained from the RT-PCR electropherogram. RT-qPCR measuring the expression of NUMB-S in SRSF2 depleted cells on day 5 of differentiation. The representative FACS plots of CD31 + CD34 + cells at day 5 of differentiation after treatment with DMSO and NOTCH inhibitor DAPT at various concentrations from day 2.5 to 5. Western blotting showing the expression of HES1 (detected by endogenous HES1 antibody as well as anti-FLAG antibody) and SRSF2 in 293T cells. GADPH acts as a loading control. The splicing of NUMB exon 9 after HES1 overexpression. The top panel is a representative RT-PCR electropherogram showing the inclusion or exclusion of NUMB exon 9 without or with HES1 overexpression. The quantification is presented in the bottom bar graph. Data information: Results given are mean +- SD. P -values were determined by unpaired two-tailed Student's t -test in (D), (E), and (H). ns