Explore
 Validate
 Learn
Learn Western blot
 Immunocytochemistry
Antibody data
- Antibody Data
- Antigen structure
- References [3]
- Comments [0]
- Validations
- Immunocytochemistry [2]
- Immunohistochemistry [1]
- Other assay [3]
Submit
Validation data
Reference
Comment
Report error
- Product number
- PA5-35203 - Provider product page

- Provider
- Invitrogen Antibodies
- Product name
- ATG7 Polyclonal Antibody
- Antibody type
- Polyclonal
- Antigen
- Synthetic peptide
- Description
- This antibody is predicted to react with rat based on sequence homology.
- Reactivity
- Human, Mouse
- Host
- Rabbit
- Isotype
- IgG
- Vial size
- 400 μL
- Concentration
- 2 mg/mL
- Storage
- Store at 4°C short term. For long term storage, store at -20°C, avoiding freeze/thaw cycles.
Submitted references Disruption of Atg7-dependent autophagy causes electromotility disturbances, outer hair cell loss, and deafness in mice.
Metformin alleviates hyperglycemia-induced endothelial impairment by downregulating autophagy via the Hedgehog pathway.
Chick Embryo: A Preclinical Model for Understanding Ischemia-Reperfusion Mechanism.
Zhou H, Qian X, Xu N, Zhang S, Zhu G, Zhang Y, Liu D, Cheng C, Zhu X, Liu Y, Lu L, Tang J, Chai R, Gao X
Cell death & disease 2020 Oct 24;11(10):913
Cell death & disease 2020 Oct 24;11(10):913
Metformin alleviates hyperglycemia-induced endothelial impairment by downregulating autophagy via the Hedgehog pathway.
Niu C, Chen Z, Kim KT, Sun J, Xue M, Chen G, Li S, Shen Y, Zhu Z, Wang X, Liang J, Jiang C, Cong W, Jin L, Li X
Autophagy 2019 May;15(5):843-870
Autophagy 2019 May;15(5):843-870
Chick Embryo: A Preclinical Model for Understanding Ischemia-Reperfusion Mechanism.
Fauzia E, Barbhuyan TK, Shrivastava AK, Kumar M, Garg P, Khan MA, Robertson AAB, Raza SS
Frontiers in pharmacology 2018;9:1034
Frontiers in pharmacology 2018;9:1034
No comments: Submit comment
Supportive validation
- Submitted by
- Invitrogen Antibodies (provider)
- Main image

- Experimental details
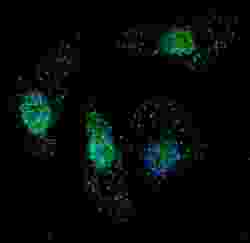
- Immunofluorescent analysis of ATG7 showing staining in the cytoplasm of U-251 cells. U251 cells were treated with Chloroquine (50uM, 16h), fixed with 4% PFA (20 min) and permeabilized with Triton X-100 (0.2%, 30 min). Cells were probed with an ATG7 polyclonal antibody (Product # PA5-35203) (1:100, 2h at room temperature) followed by detection using a fluorescent conjugated secondary antibody (green) (1:1000, 1h). Nuclei were stained with Hoechst 33342 (blue) (10 µg/mL, 5 min).

- Submitted by
- Invitrogen Antibodies (provider)
- Main image
- Experimental details
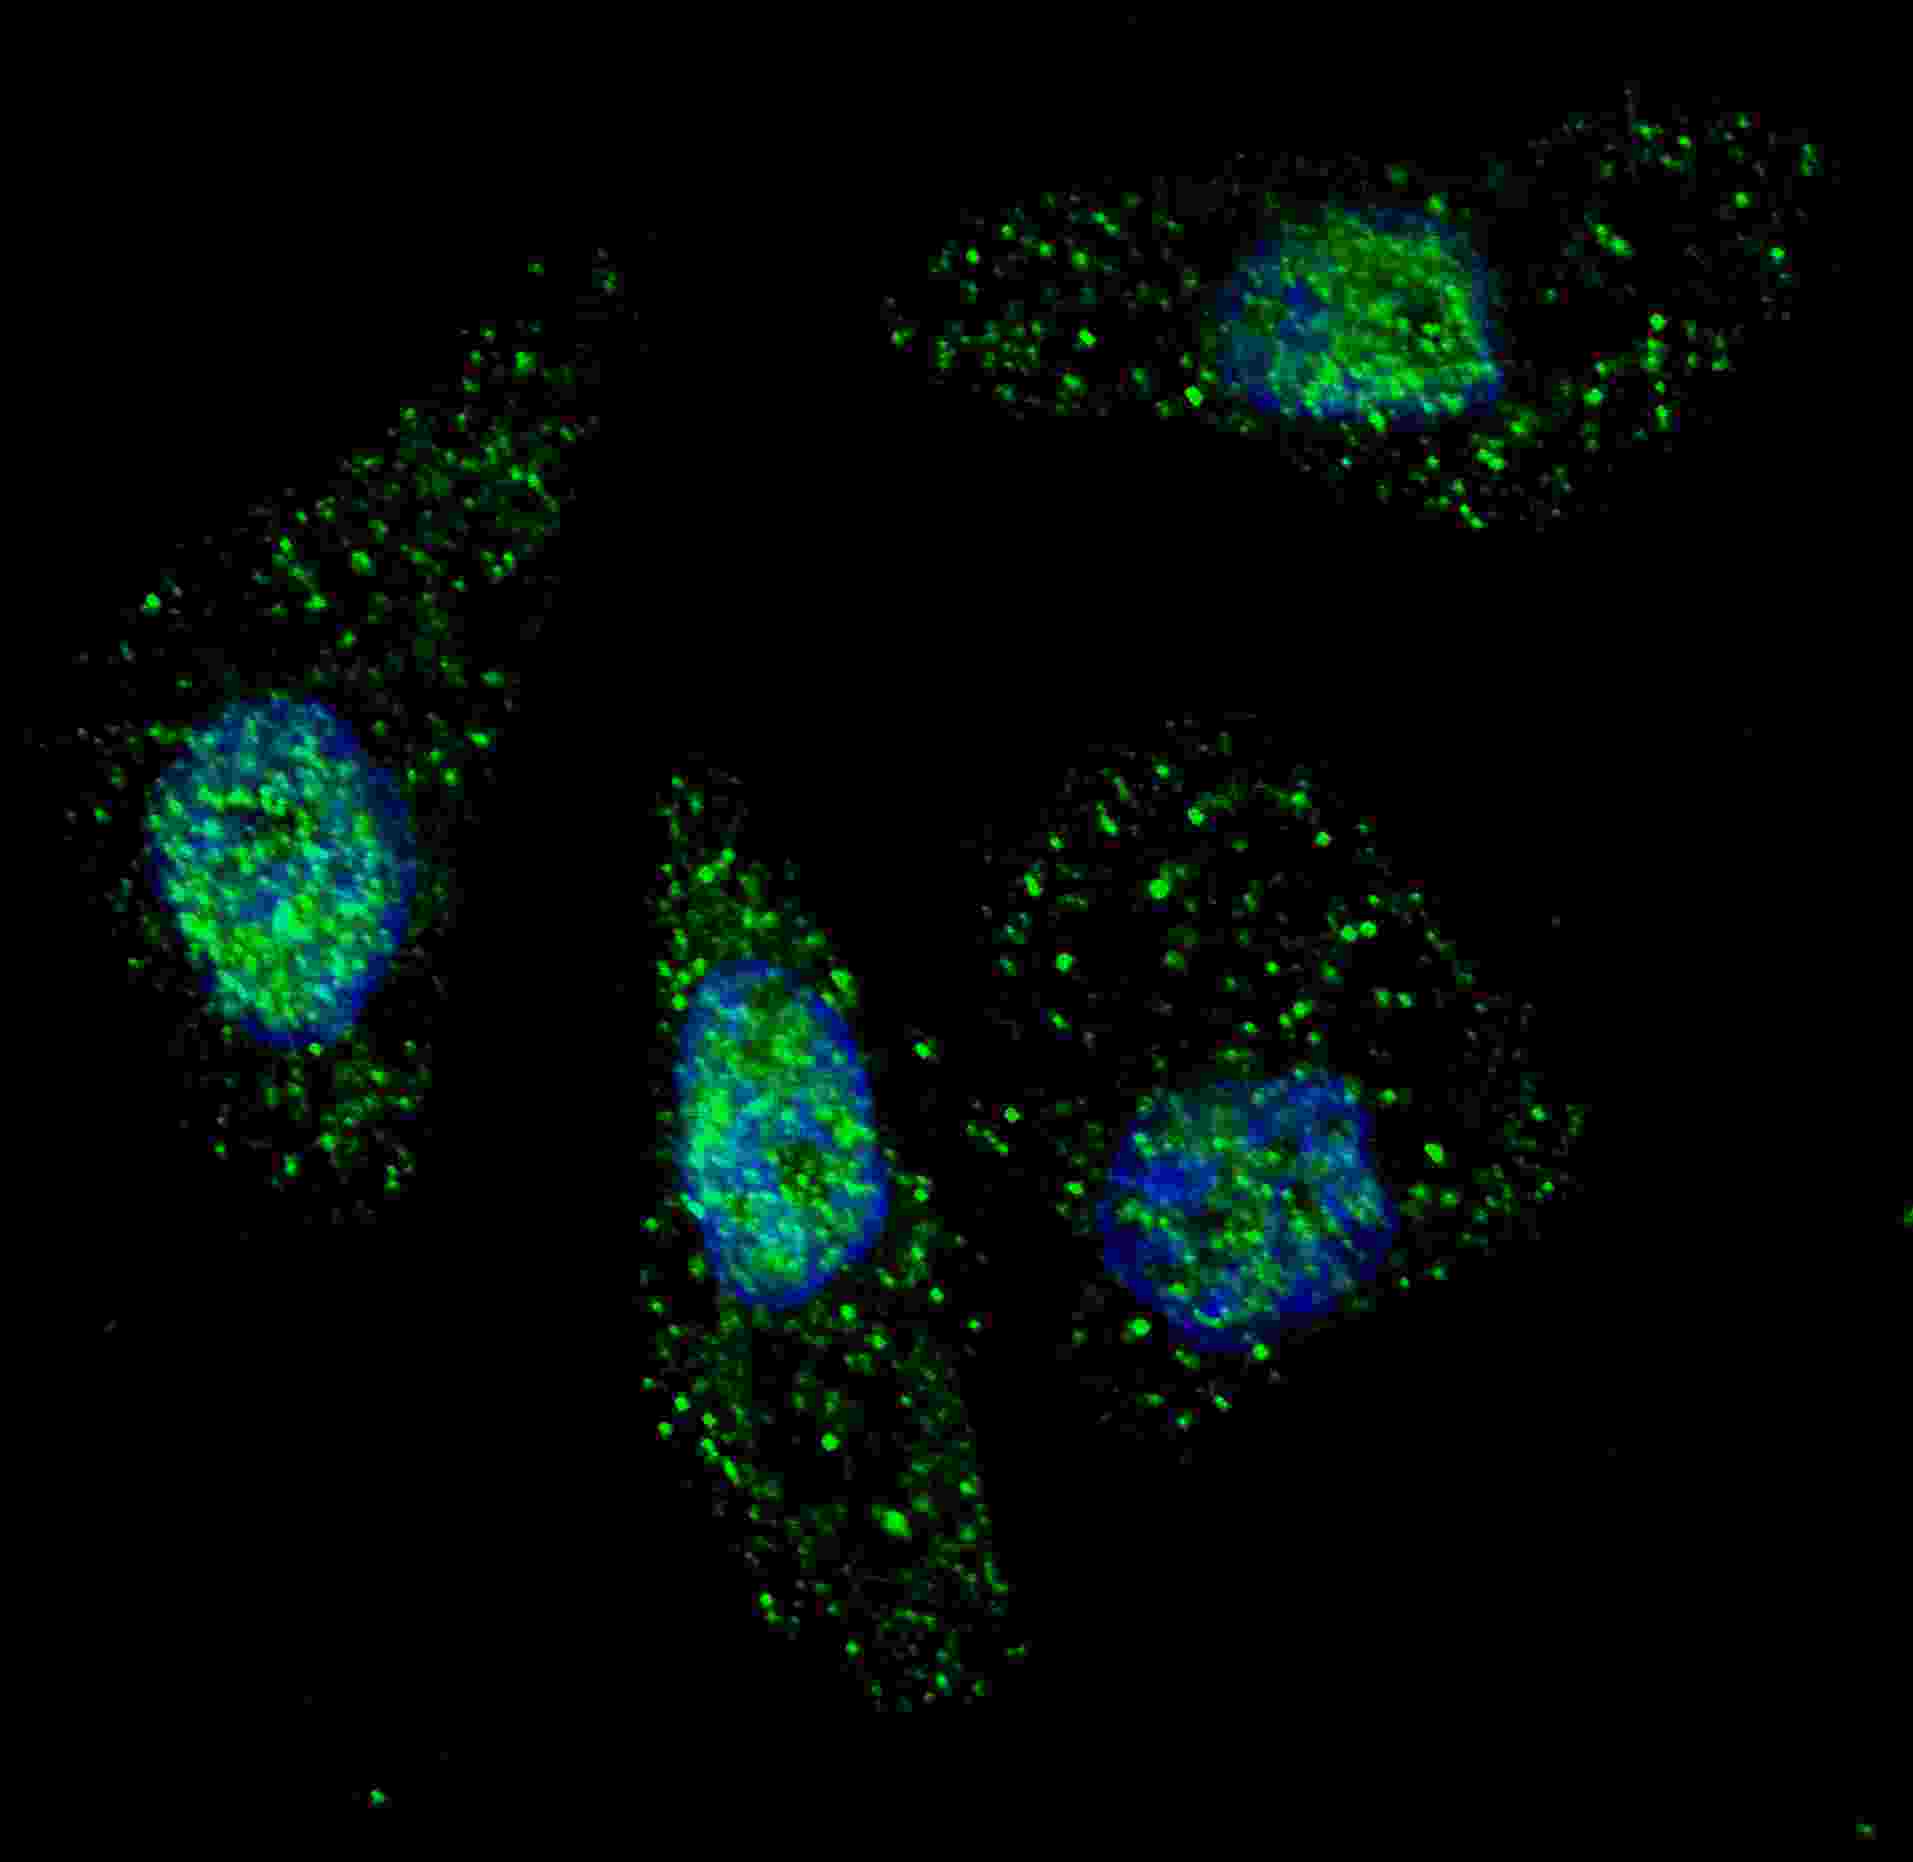
- Immunocytochemistry analysis of ATG7 in U251 cells. Samples were incubated with ATG7 polyclonal antibody (Product # PA5-35203) using a dilution of 1:200 for 2 hr at room temperature followed by Alexa Fluor® 488 conjugated donkey anti-rabbit antibody (green) at a dilution of 1:1,000 for 1hr. Cells were treated with Chloroquine (50 μM, 16hr), then fixed with 4% PFA (20 min), and permeabilized with Triton X-100 (0.2%, 30 min). Nuclei were counterstained with Hoechst 33342 (blue) (10 µg/mL, 5 min). ATG7 immunoreactivity is localized to autophagic vacuoles in the cytoplasm of U251 cells.
Supportive validation
- Submitted by
- Invitrogen Antibodies (provider)
- Main image
- Experimental details
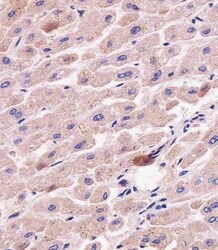
- Immunohistochemistry analysis of ATG7 in paraformaldehyde-fixed, paraffin-embedded human liver tissue sections. Samples were incubated with ATG7 polyclonal antibody (Product # PA5-35203) using a dilution of 1:25 for 1 hours at 37°C followed by an undiluted biotinylated goat polyvalent antibody. Tissue was fixed with formaldehyde and blocked with 3% BSA for 0.5 hour at room temperature; antigen retrieval was by heat mediation with a citrate buffer (pH 6).

Supportive validation
- Submitted by
- Invitrogen Antibodies (provider)
- Main image

- Experimental details
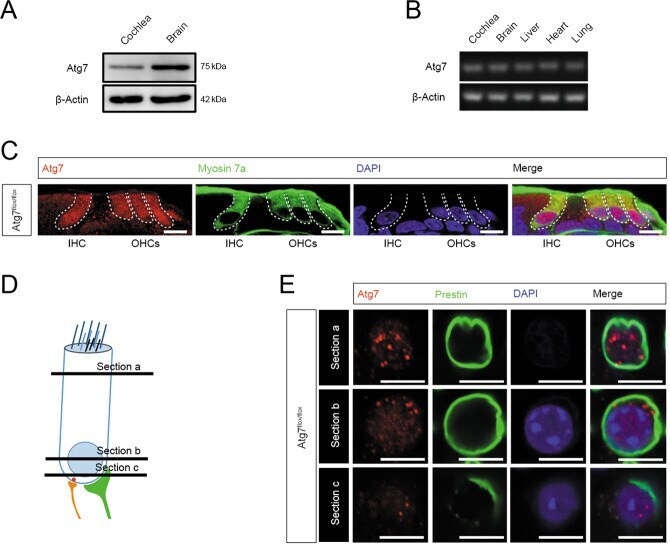
- Fig. 1 OHCs and IHCs expressed the highest levels of Atg7 in the cochlea. A Representative immunoblot of Atg7 protein in the cochlea. B Expression of the Atg7 gene was analyzed by RT-PCR. C Atg7 was evident in OHCs and IHCs in the cochlear cryosections. D , E Atg7 puncta were distributed throughout the OHC cell bodies as indicated in the infracuticular, nuclear, and basal pool sections. N = 6 for each group (western blot: N = 3). Scale bar: A - C : 5 mum; D , E : 10 mum.
- Submitted by
- Invitrogen Antibodies (provider)
- Main image
- Experimental details
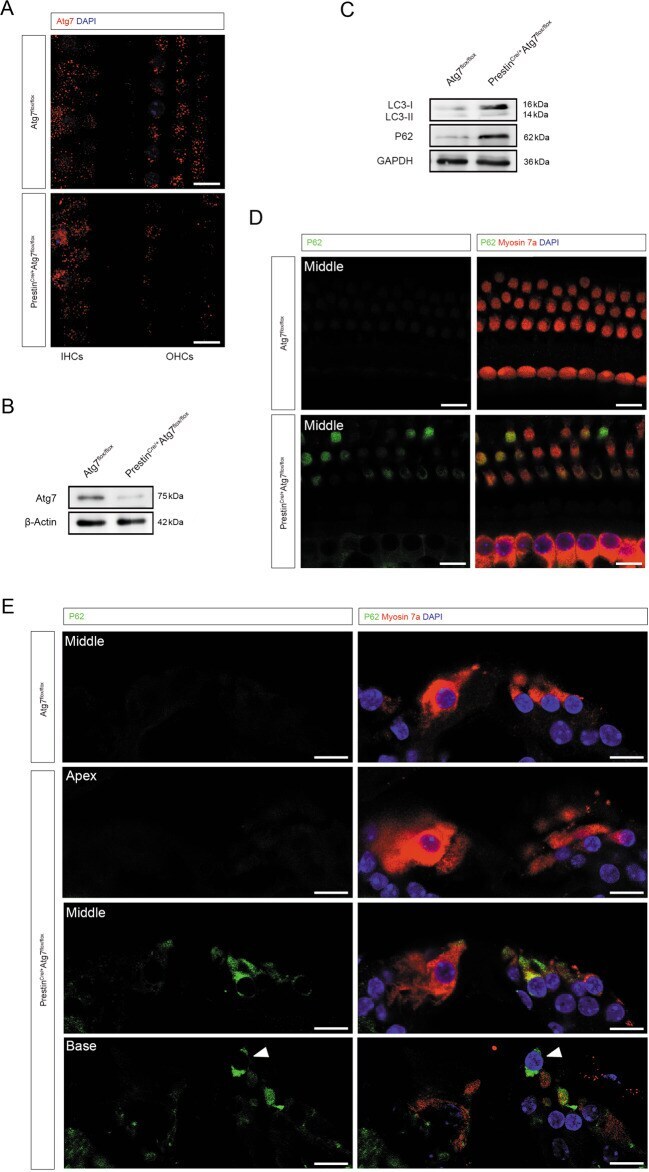
- Fig. 2 Abnormal autophagy in Atg7-deficient OHCs. A Representative immunostaining images showing efficient knockout of Atg7 in the OHCs and not in the IHCs. B Western blot showed that Atg7 was largely suppressed in the cochlear whole mount of Prestin Cre/+ Atg7 flox/flox mice. C Representative immunoblots showing elevated P62, increased LC3-I, and decreased LC3-II/LC3-I ratio. D P62 accumulated in Atg7-deficient OHCs, showing a colorful mosaic pattern when co-stained with myosin 7a. E P62 aggregated in the mutant OHCs, especially at middle and basal turns. An OHC in the basal turn was extruded from the sensory epithelium (white arrowhead). N = 6 for each group (western blot: N = 3). Scale bar: 10 mum.
- Submitted by
- Invitrogen Antibodies (provider)
- Main image

- Experimental details
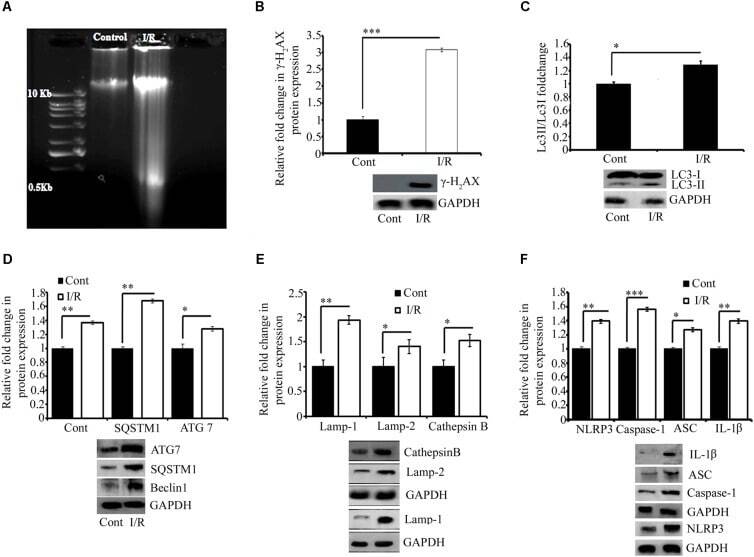
- FIGURE 3 Representative pictures of effect of I/R on DNA damage, cell survival, and inflammation. (A) DNA gel electrophoresis diagram. (B) The phosphorylation of H2AX in response to I/R-induced DNA damage ( *** P < 0.001 vs. control). Western blot analysis expression level of LC3 I/II ( * P < 0.05) (C) , Beclin1 ( *** P < 0.001), SQSTM1 ( * P < 0.05), and ATG7 ( ** P < 0.01) (D) and lysosomal associated proteins Lamp1 ( ** P < 0.01), Lamp2 ( * P < 0.05), and Cathepsin B ( * P < 0.05) (E) in total protein extract from RVA of I/R treated vs. control group. (F) The expression of NLRP3 ( *** P < 0.001), Caspase-1 ( ** P < 0.01), ASC ( ** P < 0.01), and IL-1beta ( ** P < 0.01). Results represent mean +- SE ( n = 3). The graph shows the densitometry quantification of western blot bands. Here control group represented Sham group. * P < 0.05, ** P < 0.01, and *** P < 0.001.