Explore
 Validate
 Learn
Learn Western blot
 Immunocytochemistry
Antibody data
- Antibody Data
- Antigen structure
- References [4]
- Comments [0]
- Validations
- Immunocytochemistry [8]
- Flow cytometry [1]
- Other assay [2]
Submit
Validation data
Reference
Comment
Report error
- Product number
- MA1-060 - Provider product page

- Provider
- Invitrogen Antibodies
- Product name
- Cytohesin 1 Monoclonal Antibody (2E11)
- Antibody type
- Monoclonal
- Antigen
- Purifed from natural sources
- Description
- MA1-060 detects cytohesin-1 from human and mouse cells as well as recombinant human protein. MA1-060 has been successfully used in Western blot and IF procedures. By Western blot, this antibody detects an ~48 kDa protein representing cytohesin-1. The MA1-060 immunogen is purified, His-tagged cytohesin-1.
- Reactivity
- Human, Mouse
- Host
- Mouse
- Isotype
- IgG
- Antibody clone number
- 2E11
- Vial size
- 100 μg
- Concentration
- 1 mg/mL
- Storage
- -20°C, Avoid Freeze/Thaw Cycles
Submitted references CRL5-dependent regulation of the small GTPases ARL4C and ARF6 controls hippocampal morphogenesis.
HGF-induced migration depends on the PI(3,4,5)P(3)-binding microexon-spliced variant of the Arf6 exchange factor cytohesin-1.
Characterization of cytohesin-1 monoclonal antibodies: expression in neutrophils and during granulocytic maturation of HL-60 cells.
Characterization of cytohesin-1 monoclonal antibodies: expression in neutrophils and during granulocytic maturation of HL-60 cells.
Han JS, Hino K, Li W, Reyes RV, Canales CP, Miltner AM, Haddadi Y, Sun J, Chen CY, La Torre A, Simó S
Proceedings of the National Academy of Sciences of the United States of America 2020 Sep 15;117(37):23073-23084
Proceedings of the National Academy of Sciences of the United States of America 2020 Sep 15;117(37):23073-23084
HGF-induced migration depends on the PI(3,4,5)P(3)-binding microexon-spliced variant of the Arf6 exchange factor cytohesin-1.
Ratcliffe CDH, Siddiqui N, Coelho PP, Laterreur N, Cookey TN, Sonenberg N, Park M
The Journal of cell biology 2019 Jan 7;218(1):285-298
The Journal of cell biology 2019 Jan 7;218(1):285-298
Characterization of cytohesin-1 monoclonal antibodies: expression in neutrophils and during granulocytic maturation of HL-60 cells.
Garceau V, Houle MG, Chouinard F, Gagnon S, Harbour D, Naccache PH, Bourgoin SG
Journal of immunological methods 2001 Mar 1;249(1-2):121-36
Journal of immunological methods 2001 Mar 1;249(1-2):121-36
No comments: Submit comment
Supportive validation
- Submitted by
- Invitrogen Antibodies (provider)
- Main image

- Experimental details
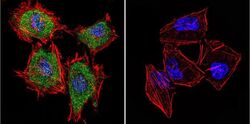
- Immunofluorescent analysis of Cytohesin 1 in HeLa Cells. Cells were grown on chamber slides and fixed with formaldehyde prior to staining. Cells were probed without (control) or with a Cytohesin 1 monoclonal antibody (Product # MA1-060) at a dilution of 1:20 overnight at 4 C, washed with PBS and incubated with a DyLight-488 conjugated secondary antibody (Product # 35503). Cytohesin 1 staining (green), F-Actin staining with Phalloidin (red) and nuclei with DAPI (blue) is shown. Images were taken at 60X magnification.
- Submitted by
- Invitrogen Antibodies (provider)
- Main image
- Experimental details
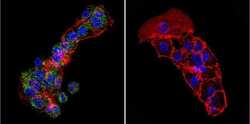
- Immunofluorescent analysis of Cytohesin 1 in HepG2 Cells. Cells were grown on chamber slides and fixed with formaldehyde prior to staining. Cells were probed without (control) or with a Cytohesin 1 monoclonal antibody (Product # MA1-060) at a dilution of 1:20 overnight at 4 C, washed with PBS and incubated with a DyLight-488 conjugated secondary antibody (Product # 35503). Cytohesin 1 staining (green), F-Actin staining with Phalloidin (red) and nuclei with DAPI (blue) is shown. Images were taken at 60X magnification.

- Submitted by
- Invitrogen Antibodies (provider)
- Main image

- Experimental details
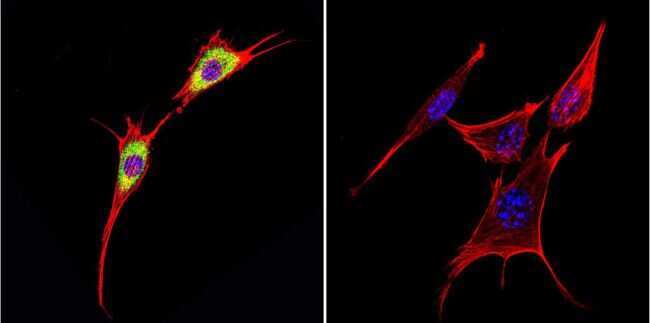
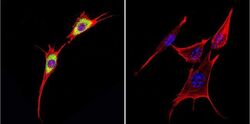
- Immunofluorescent analysis of Cytohesin 1 in NIH-3T3 Cells. Cells were grown on chamber slides and fixed with formaldehyde prior to staining. Cells were probed without (control) or with a Cytohesin 1 monoclonal antibody (Product # MA1-060) at a dilution of 1:20 overnight at 4 C, washed with PBS and incubated with a DyLight-488 conjugated secondary antibody (Product # 35503). Cytohesin 1 staining (green), F-Actin staining with Phalloidin (red) and nuclei with DAPI (blue) is shown. Images were taken at 60X magnification.
- Submitted by
- Invitrogen Antibodies (provider)
- Main image
- Experimental details
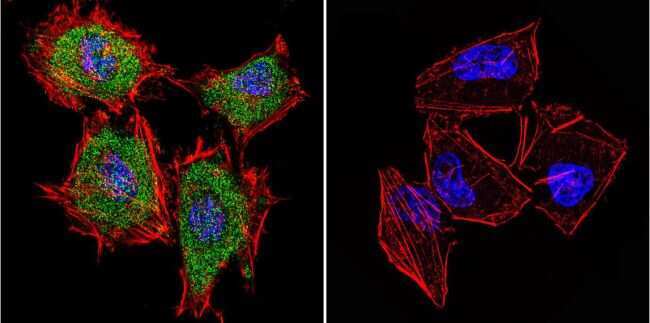
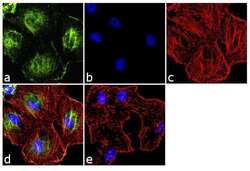
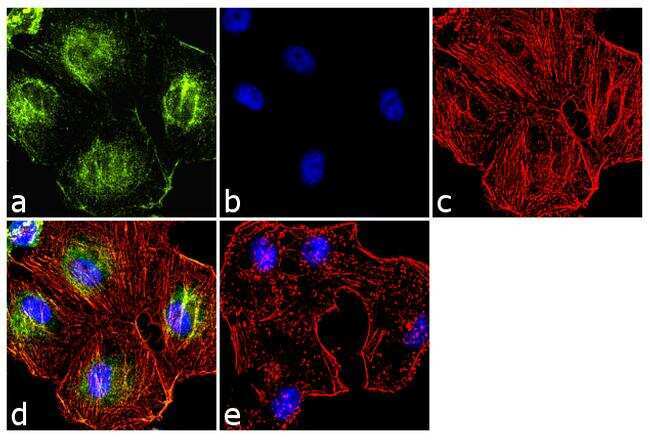
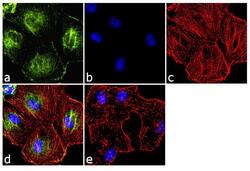
- Immunofluorescence analysis of Cytohesin 1 was done on 70% confluent log phase HeLa cells. The cells were fixed with 4% paraformaldehyde for 10 minutes, permeabilized with 0.1% Triton™ X-100 for 10 minutes, and blocked with 1% BSA for 1 hour at room temperature. The cells were labeled with Cytohesin 1 (2E11) Mouse Monoclonal Antibody (Product # MA1-060) at 2 µg/mL in 0.1% BSA and incubated for 3 hours at room temperature and then labeled with Goat anti-Mouse IgG (H+L) Superclonal™ Secondary Antibody, Alexa Fluor® 488 conjugate (Product # A28175) at a dilution of 1:2000 for 45 minutes at room temperature (Panel a: green). Nuclei (Panel b: blue) were stained with SlowFade® Gold Antifade Mountant with DAPI (Product # S36938). F-actin (Panel c: red) was stained with Alexa Fluor® 555 Rhodamine Phalloidin (Product # R415, 1:300). Panel d is a merged image showing cytoplasmic and membranous localization. Panel e is a no primary antibody control. The images were captured at 60X magnification.
- Submitted by
- Invitrogen Antibodies (provider)
- Main image
- Experimental details
- Immunofluorescent analysis of Cytohesin 1 in HeLa Cells. Cells were grown on chamber slides and fixed with formaldehyde prior to staining. Cells were probed without (control) or with a Cytohesin 1 monoclonal antibody (Product # MA1-060) at a dilution of 1:20 overnight at 4 C, washed with PBS and incubated with a DyLight-488 conjugated secondary antibody (Product # 35503). Cytohesin 1 staining (green), F-Actin staining with Phalloidin (red) and nuclei with DAPI (blue) is shown. Images were taken at 60X magnification.

- Submitted by
- Invitrogen Antibodies (provider)
- Main image

- Experimental details
- Immunofluorescent analysis of Cytohesin 1 in HepG2 Cells. Cells were grown on chamber slides and fixed with formaldehyde prior to staining. Cells were probed without (control) or with a Cytohesin 1 monoclonal antibody (Product # MA1-060) at a dilution of 1:20 overnight at 4 C, washed with PBS and incubated with a DyLight-488 conjugated secondary antibody (Product # 35503). Cytohesin 1 staining (green), F-Actin staining with Phalloidin (red) and nuclei with DAPI (blue) is shown. Images were taken at 60X magnification.

- Submitted by
- Invitrogen Antibodies (provider)
- Main image
- Experimental details
- Immunofluorescent analysis of Cytohesin 1 in NIH-3T3 Cells. Cells were grown on chamber slides and fixed with formaldehyde prior to staining. Cells were probed without (control) or with a Cytohesin 1 monoclonal antibody (Product # MA1-060) at a dilution of 1:20 overnight at 4 C, washed with PBS and incubated with a DyLight-488 conjugated secondary antibody (Product # 35503). Cytohesin 1 staining (green), F-Actin staining with Phalloidin (red) and nuclei with DAPI (blue) is shown. Images were taken at 60X magnification.

- Submitted by
- Invitrogen Antibodies (provider)
- Main image
- Experimental details
- Immunofluorescence analysis of Cytohesin 1 was done on 70% confluent log phase HeLa cells. The cells were fixed with 4% paraformaldehyde for 10 minutes, permeabilized with 0.1% Triton™ X-100 for 10 minutes, and blocked with 1% BSA for 1 hour at room temperature. The cells were labeled with Cytohesin 1 (2E11) Mouse Monoclonal Antibody (Product # MA1-060) at 2 µg/mL in 0.1% BSA and incubated for 3 hours at room temperature and then labeled with Goat anti-Mouse IgG (H+L) Superclonal™ Secondary Antibody, Alexa Fluor® 488 conjugate (Product # A28175) at a dilution of 1:2000 for 45 minutes at room temperature (Panel a: green). Nuclei (Panel b: blue) were stained with SlowFade® Gold Antifade Mountant with DAPI (Product # S36938). F-actin (Panel c: red) was stained with Alexa Fluor® 555 Rhodamine Phalloidin (Product # R415, 1:300). Panel d is a merged image showing cytoplasmic and membranous localization. Panel e is a no primary antibody control. The images were captured at 60X magnification.

Supportive validation
- Submitted by
- Invitrogen Antibodies (provider)
- Main image
- Experimental details
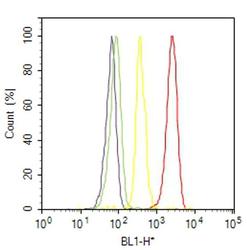
- Flow cytometry analysis of Cytohesin 1 was done on Raji cells. Cells were fixed with 70% ethanol for 10 minutes, permeabilized with 0.25% Triton™ X-100 for 20 minutes, and blocked with 5% BSA for 30 minutes at room temperature. Cells were labeled with Cytohesin 1 Mouse Monoclonal Antibody (MA1060, red histogram) or with mouse isotype control (yellow histogram) at 3-5 ug/million cells in 2.5% BSA. After incubation at room temperature for 2 hours, the cells were labeled with Alexa Fluor® 488 Rabbit Anti-Mouse Secondary Antibody (A11059) at a dilution of 1:400 for 30 minutes at room temperature. The representative 10,000 cells were acquired and analyzed for each sample using an Attune® Acoustic Focusing Cytometer. The purple histogram represents unstained control cells and the green histogram represents no-primary-antibody control.

Supportive validation
- Submitted by
- Invitrogen Antibodies (provider)
- Main image
- Experimental details
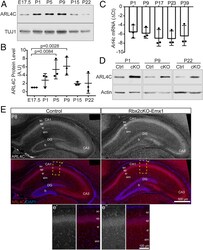
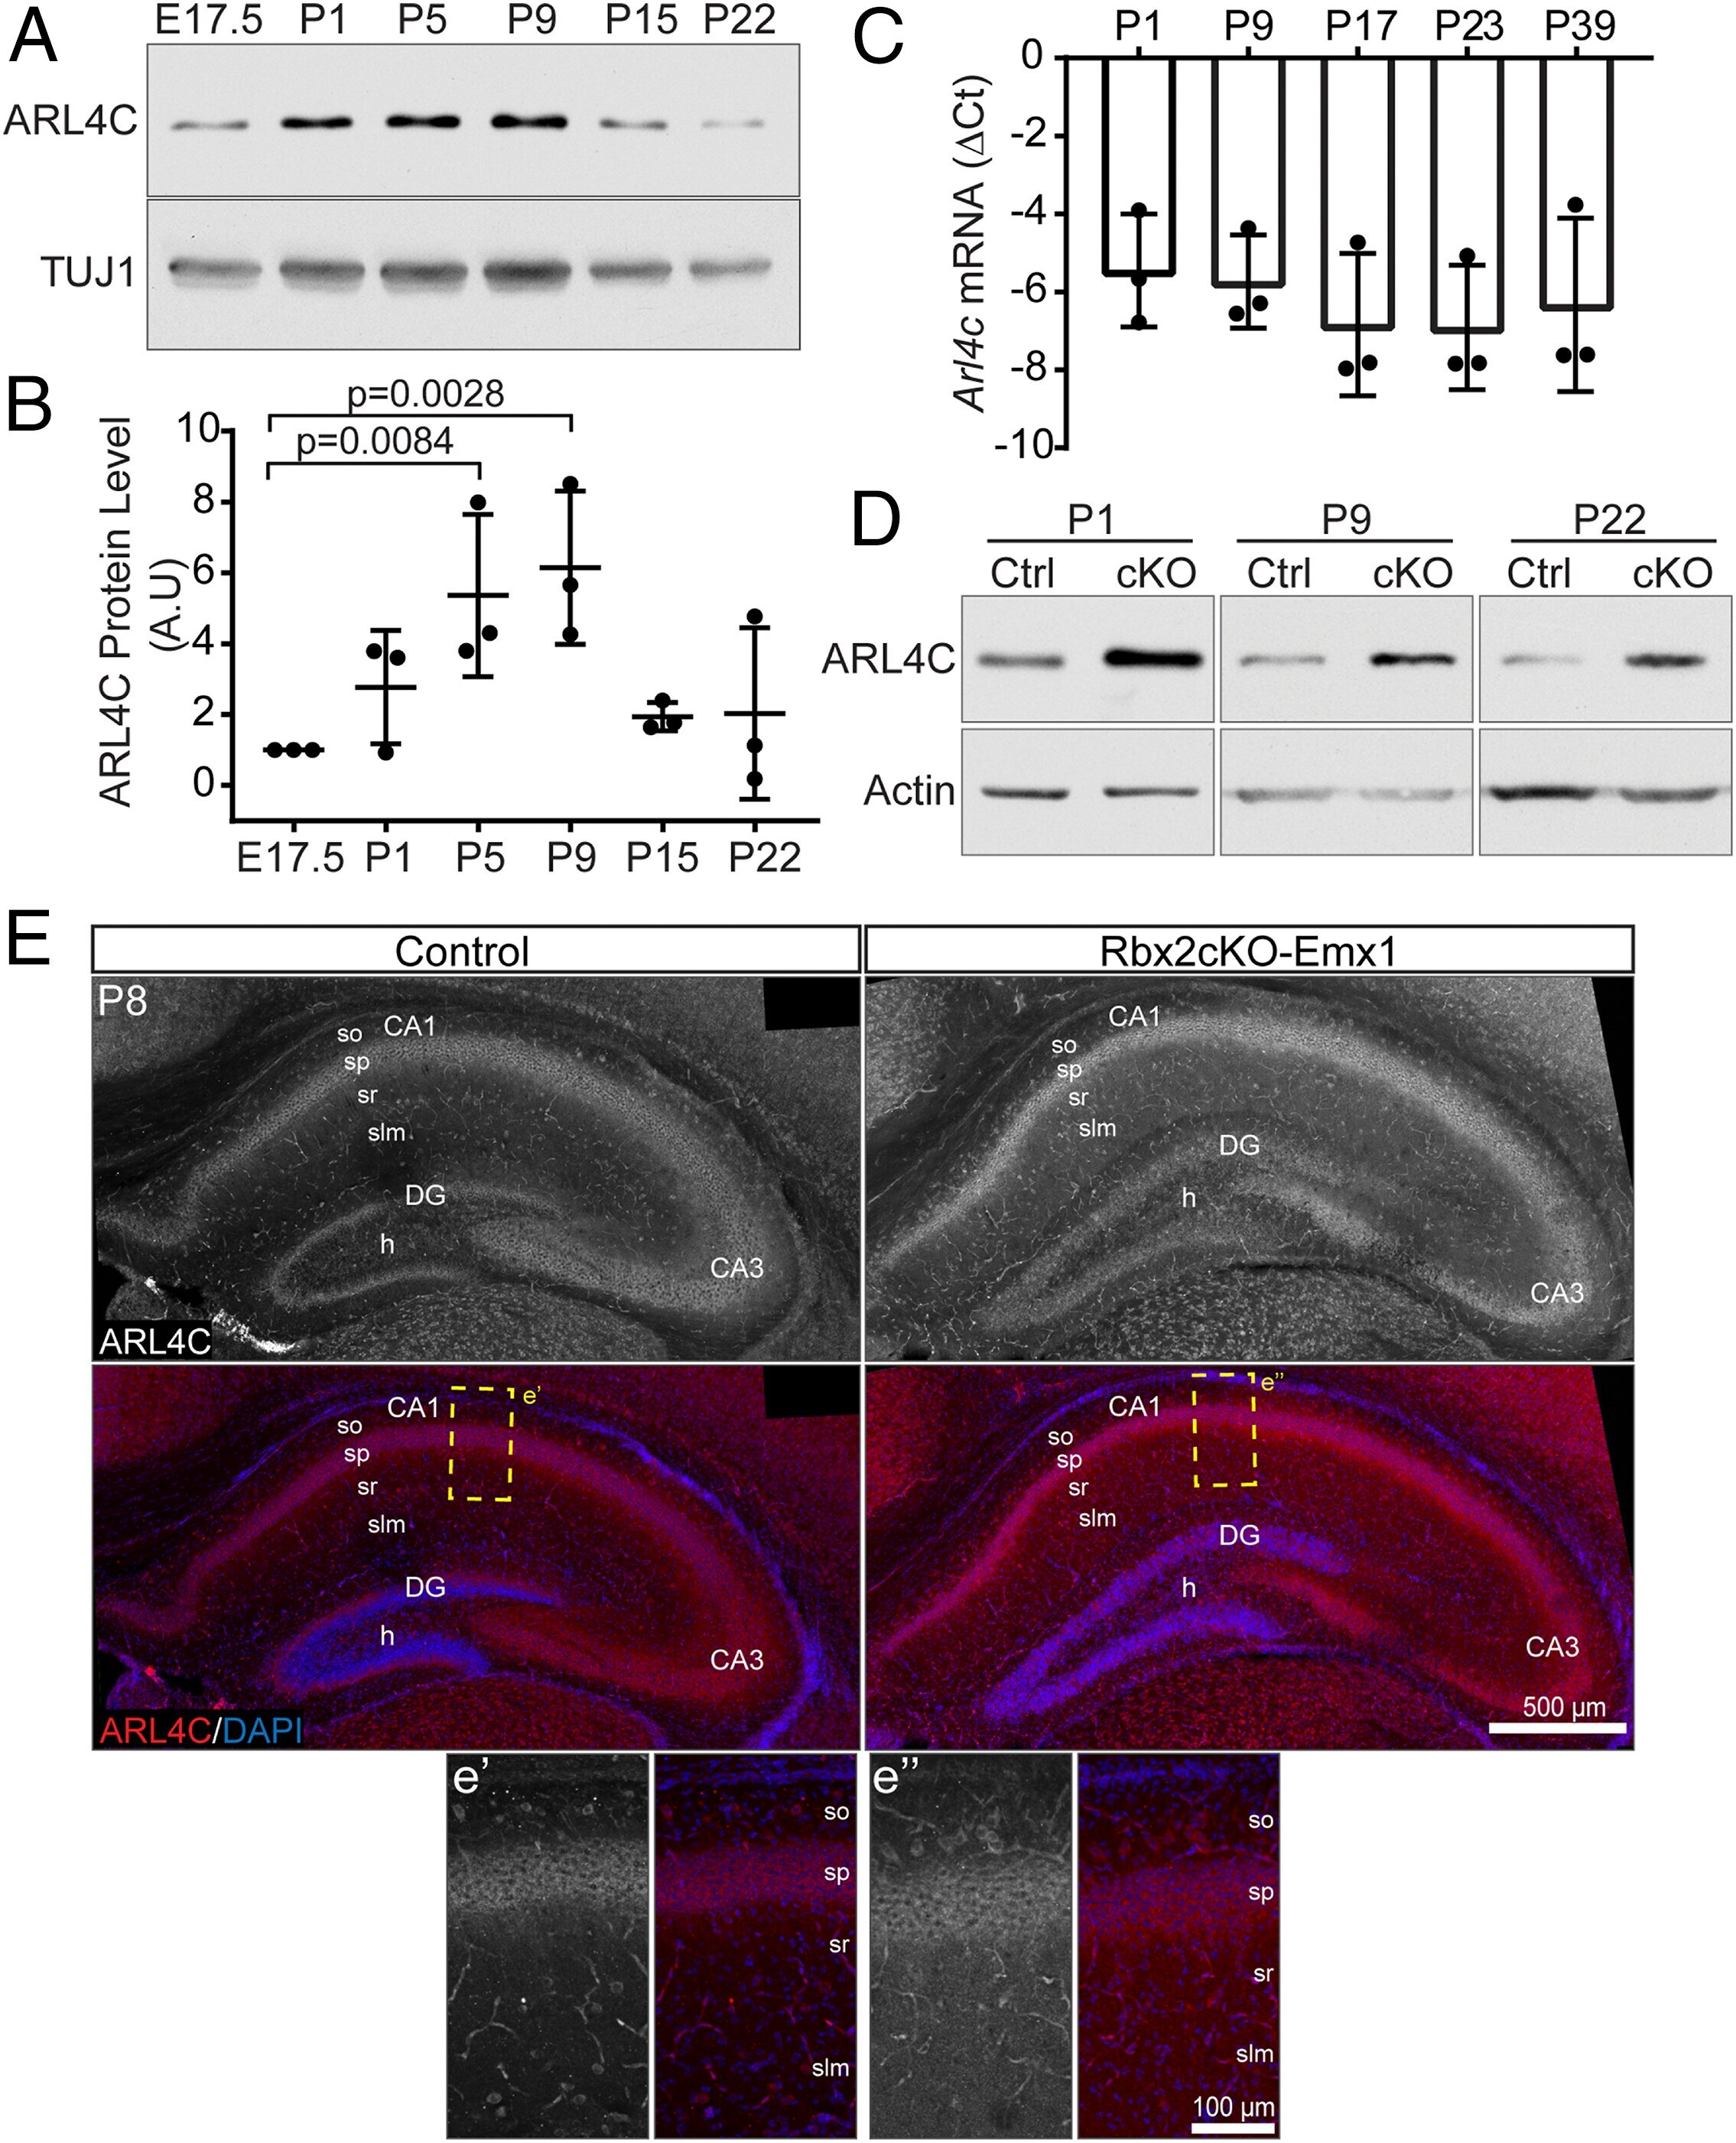
- Fig. 4. ARL4C, Cytohesin-1, and ARF6 accumulate in the RBX2 mutant, but not in SOCS7 -/- hippocampi. ( A ) TMT-MS of Rbx2cKO-Nes ( n = 3) and Rbx2 fl/fl ( n = 4) telencephalons (P0) plotted as a ratio of Rbx2cKO-Nes/control. The x axis represents the logarithmic fold ration of Rbx2cKO-Nes/control per protein identified. The y axis represents the logarithmic P value of the t test per protein identified. Proteins whose differentially expression in comparison to control ( Rbx2 fl/fl) have a P < 0.01 and accumulated above 1.5 folds (red dots) or reduced lower than 0.666 folds (blue dots) in comparison to control were initially considered for further studies. As expected, RBX2 mutant samples showed lower levels of RBX2 and CUL5 and higher levels of DAB1 in comparison to control. ( B ) RNA-seq analysis comparing Rbx2cKO-Nes (Mutant; n = 3) and Rbx2 fl/fl (Control; n = 3) telencephalon at P1 was performed to determine transcriptionally differences between genotypes. Ratio of counts per million between Rbx2cKO-Nes and control per gene is plotted. The x axis represents the logarithmic fold ration of Rbx2cKO-Nes/control per gene identified. The y axis represents the logarithmic false discovery rate value (FDR; or q value) calculated by using the Benjamini, Krieger, and Yekutieli method. Only genes with an average count per million (cpm) in control samples of >1 were used for statistical purposes and plotted. No significant transcriptomic differences were observed between genotypes. ( C
- Submitted by
- Invitrogen Antibodies (provider)
- Main image
- Experimental details
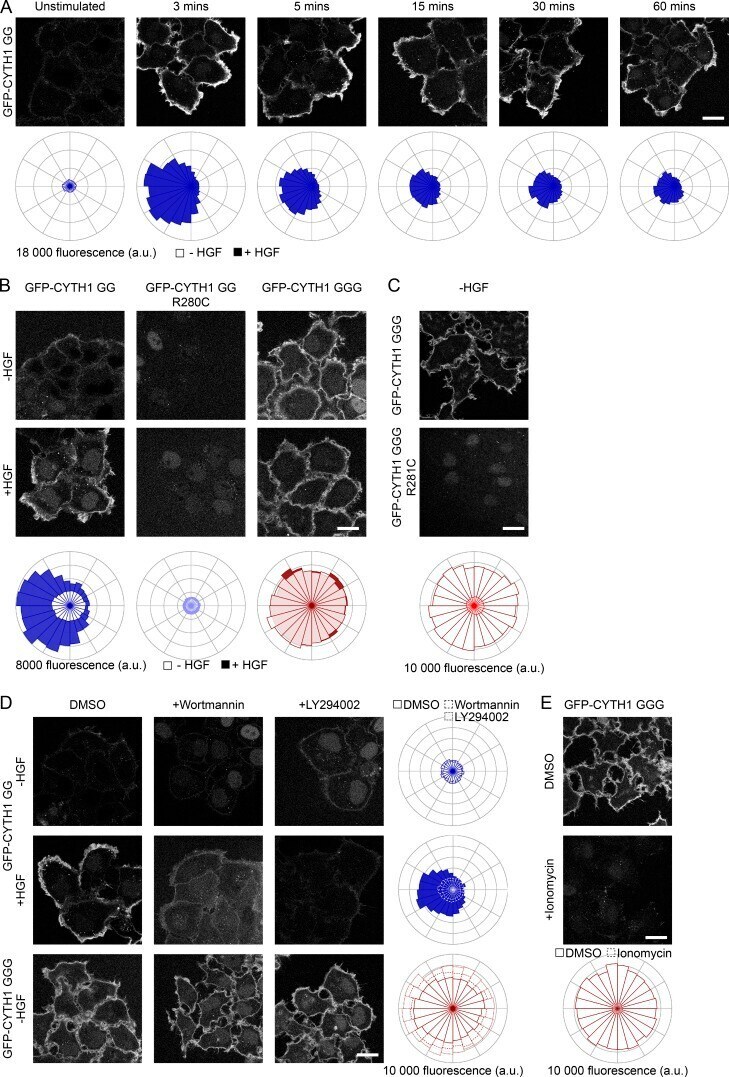
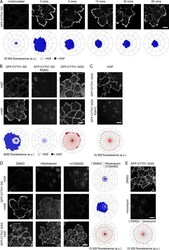
- Figure 6. Cytohesin-1 localization is defined by G272. (A) HeLa cells stably expressing EGFP-tagged diglycine CYTH1 were either not treated (-, unfilled) or treated (+, filled) with HGF for the indicated time points, permeabilized with ice-cold 0.05% saponin in Pipes buffer, and imaged by confocal microscopy. (B) HeLa cells stably expressing EGFP-tagged variants of CYTH1 were either not treated (-, unfilled) or treated (+, filled) with HGF for 15 min, permeabilized with ice-cold 0.05% saponin in Pipes buffer, and imaged by confocal microscopy. (C and D) Cells were prepared as in A, except they were pretreated with DMSO, 0.2 uM Wortmannin, or 20 uM LY294002 for 30 min before HGF stimulation. (E) HeLa cells stably expressing triglcyine EGFP-CYTH1 were pretreated with 10 uM DMSO or ionomycin for 10 min, permeabilized with ice-cold 0.05% saponin in Pipes buffer, and imaged by confocal microscopy. Scale bars, 20 um.