Explore
 Validate
 Learn
LearnPA5-21858
antibody from Invitrogen Antibodies
Targeting: TRAK2
ALS2CR3, CALS-C, GRIF-1, KIAA0549, MILT2, OIP98
 Western blot
 Other assay
Antibody data
- Antibody Data
- Antigen structure
- References [1]
- Comments [0]
- Validations
- Other assay [3]
Submit
Validation data
Reference
Comment
Report error
- Product number
- PA5-21858 - Provider product page

- Provider
- Invitrogen Antibodies
- Product name
- TRAK2 Polyclonal Antibody
- Antibody type
- Polyclonal
- Antigen
- Synthetic peptide
- Description
- Recommended positive controls: 293T, A431, H1299, HeLaS3, HepG2, Molt-4, Raji. Predicted reactivity: Rhesus Monkey (100%). Store product as a concentrated solution. Centrifuge briefly prior to opening the vial.
- Reactivity
- Human
- Host
- Rabbit
- Isotype
- IgG
- Vial size
- 100 µL
- Concentration
- 1 mg/mL
- Storage
- Store at 4°C short term. For long term storage, store at -20°C, avoiding freeze/thaw cycles.
Submitted references Truncated Tau Induces Mitochondrial Transport Failure Through the Impairment of TRAK2 Protein and Bioenergetics Decline in Neuronal Cells.
Quintanilla RA, Tapia-Monsalves C, Vergara EH, Pérez MJ, Aranguiz A
Frontiers in cellular neuroscience 2020;14:175
Frontiers in cellular neuroscience 2020;14:175
No comments: Submit comment
Supportive validation
- Submitted by
- Invitrogen Antibodies (provider)
- Main image
- Experimental details
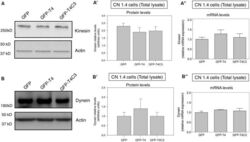
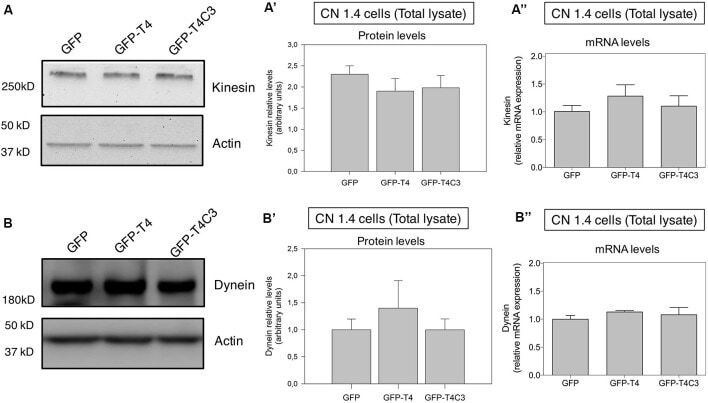
- Figure 3 Effects of caspase-cleaved tau on kinesin 1 and dynein expression in immortalized cortical neurons. Panels (A,B) show representative western blot images of CN 1.4 cells transfected with GFP, GFP-T4 (normal tau), and GFP-T4C3 (truncated tau) showing the relative kinesin 1 (KIF5) or dynein expression levels. Also, Panels (A',B') show a quantitative analysis of the relative expression levels of kinesin 1 (A') and dynein (B') in immortalized cells transfected with GFP and GFP-tau (s) forms. Data are mean +- SE, n = 3. Total RNA was extracted from immortalized cortical neurons transfected with GFP, GFP-T4 (full-length tau), and GFP-T4C3 (truncated tau), and mRNA expression levels of kinesin (A'') and dynein (B'') were measured by RT-PCR (Jara et al., ). Data represent mean +- SE, n = 4.
- Submitted by
- Invitrogen Antibodies (provider)
- Main image

- Experimental details
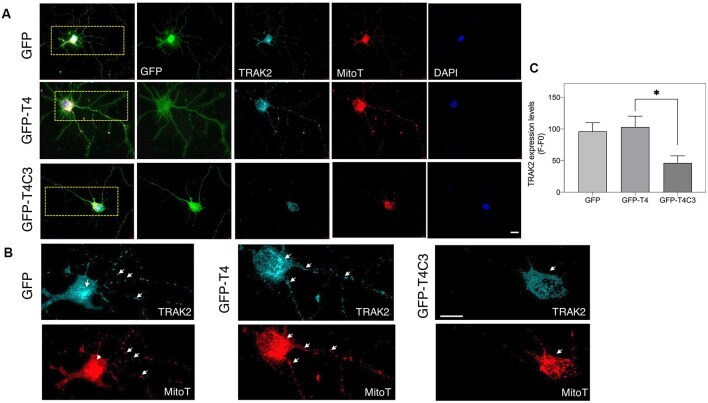
- Figure 5 Truncated tau reduces TRAK2 expression and increases its localization in the neuronal soma of hippocampal neurons. (A) Representative immunofluorescence images of rat hippocampal neurons transfected with GFP, GFP-T4 (normal tau), and GFP-T4C3 (truncated tau) showing TRAK2 expression and mitochondrial staining (MitoTracker Red CMXRos, a fixable mitochondrial dye). Expression of GFP-T4C3 reduces TRAK2 levels compared with neurons expressing GFP-T4 (normal tau). (B) Higher magnification images from (A) showing a detail of the TRAK2 localization and expression pattern in hippocampal neurons transfected with the indicated conditions. Cells transfected with caspase-cleaved tau show an apparent reduction in TRAK2 expression and an apparent increase in the localization of TRAK2 with MitoTracker Red CMXRos, suggesting an increase in the association of TRAK2 with mitochondria. White arrows indicate presence of mitochondria in neuronal processes, which is reduced in neurons that expressed caspase-cleaved tau. (C) Quantitative analysis of TRAK2 fluorescence levels obtained from hippocampal neurons transfected with GFP, GFP-T4, and GFP-T4C3. Truncated tau reduced TRAK2 expression compared to neurons that expressed full-length tau (GFP-T4). Data are mean +- SE, n = 4. * p < 0.05 indicates differences between groups calculated by ANOVA test. Immunofluorescence studies are representative of four independent experiments. Bar = 20 mum.
- Submitted by
- Invitrogen Antibodies (provider)
- Main image
- Experimental details
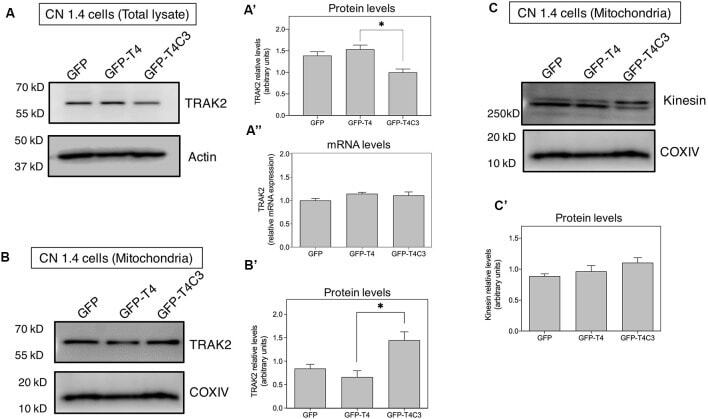
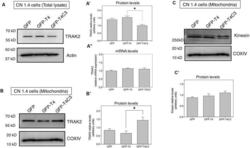
- Figure 6 Truncated tau reduces TRAK2 expression and increases its association with mitochondrial fraction in immortalized cortical neurons. (A) Representative western blot images of CN 1.4 cells transfected with GFP, GFP-T4 (normal tau), and GFP-T4C3 (truncated tau) indicating the relative TRAK2 expression levels. Caspase-cleaved tau decreases TRAK2 expression compared with cells that were expressing GFP or GFP-T4 (normal tau). (A') Quantitative analysis of the relative expression levels of TRAK2 in immortalized neurons transfected with indicated conditions. Data are mean +- SE, n = 5. * p < 0.05 indicates differences between groups calculated by ANOVA test. (A'') Total RNA was extracted from immortalized cortical neurons transfected with GFP, GFP-T4 (full-length tau), and GFP-T4C3 (truncated tau) and mRNA expression levels of TRAK2 were measured by RT-PCR. Data represent mean +- SE, n = 3. (B) Representative western blot images of CN 1.4 cells for mitochondrial extracts transfected with the conditions indicated. (B') Quantitative graph showing that caspase-cleaved tau expression increases TRAK2 presence in mitochondrial extracts compared with cells transfected with the full-length tau form (GFP-T4). Data are mean +- SE, n = 4. * p < 0.05 indicates differences between groups calculated by ANOVA test. (C) Representative western blot images and quantitative analysis (C') of kinesin 1 protein levels in mitochondrial extracts of CN 1.4 cells transfected with the conditions indica