Explore
 Validate
 Learn
Learn Western blot
 Immunocytochemistry
Antibody data
- Antibody Data
- Antigen structure
- References [7]
- Comments [0]
- Validations
- Immunocytochemistry [2]
- Immunohistochemistry [1]
- Flow cytometry [3]
- Other assay [8]
Submit
Validation data
Reference
Comment
Report error
- Product number
- MA5-15827 - Provider product page

- Provider
- Invitrogen Antibodies
- Product name
- BMPR2 Monoclonal Antibody (3F6F8)
- Antibody type
- Monoclonal
- Antigen
- Purifed from natural sources
- Description
- MA5-15827 targets BMPR2 in FACS, ICC/IF, IHC (P), and WB applications and shows reactivity with Human, mouse, Non-human primate, and rat samples.
- Reactivity
- Human, Mouse, Rat
- Host
- Mouse
- Isotype
- IgG
- Antibody clone number
- 3F6F8
- Vial size
- 100 μg
- Concentration
- 1 mg/mL
- Storage
- Store at 4°C short term. For long term storage, store at -20°C, avoiding freeze/thaw cycles.
Submitted references Exacerbated inflammatory signaling underlies aberrant response to BMP9 in pulmonary arterial hypertension lung endothelial cells.
The BMP Receptor 2 in Pulmonary Arterial Hypertension: When and Where the Animal Model Matches the Patient.
BMPR2 promotes fatty acid oxidation and protects white adipocytes from cell death in mice.
Identification of a bone morphogenetic protein type 2 receptor neutralizing antibody.
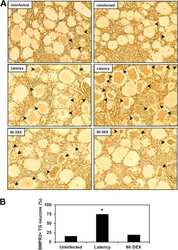
The Wnt Signaling Pathway Is Differentially Expressed during the Bovine Herpesvirus 1 Latency-Reactivation Cycle: Evidence That Two Protein Kinases Associated with Neuronal Survival, Akt3 and BMPR2, Are Expressed at Higher Levels during Latency.
Mitomycin-Induced Pulmonary Veno-Occlusive Disease: Evidence From Human Disease and Animal Models.
Endothelial-to-mesenchymal transition in pulmonary hypertension.
Szulcek R, Sanchez-Duffhues G, Rol N, Pan X, Tsonaka R, Dickhoff C, Yung LM, Manz XD, Kurakula K, Kiełbasa SM, Mei H, Timens W, Yu PB, Bogaard HJ, Goumans MJ
Angiogenesis 2020 Nov;23(4):699-714
Angiogenesis 2020 Nov;23(4):699-714
The BMP Receptor 2 in Pulmonary Arterial Hypertension: When and Where the Animal Model Matches the Patient.
Happé C, Kurakula K, Sun XQ, da Silva Goncalves Bos D, Rol N, Guignabert C, Tu L, Schalij I, Wiesmeijer KC, Tura-Ceide O, Vonk Noordegraaf A, de Man FS, Bogaard HJ, Goumans MJ
Cells 2020 Jun 8;9(6)
Cells 2020 Jun 8;9(6)
BMPR2 promotes fatty acid oxidation and protects white adipocytes from cell death in mice.
Qian S, Pan J, Su Y, Tang Y, Wang Y, Zou Y, Zhao Y, Ma H, Zhang Y, Liu Y, Guo L, Tang QQ
Communications biology 2020 Apr 29;3(1):200
Communications biology 2020 Apr 29;3(1):200
Identification of a bone morphogenetic protein type 2 receptor neutralizing antibody.
Gorrell RE, Totten MH, Schoerning LJ, Newby JB, Geyman LJ, Lawless WG, Hum JM, Lowery JW
BMC research notes 2019 Jun 11;12(1):331
BMC research notes 2019 Jun 11;12(1):331
The Wnt Signaling Pathway Is Differentially Expressed during the Bovine Herpesvirus 1 Latency-Reactivation Cycle: Evidence That Two Protein Kinases Associated with Neuronal Survival, Akt3 and BMPR2, Are Expressed at Higher Levels during Latency.
Workman A, Zhu L, Keel BN, Smith TPL, Jones C
Journal of virology 2018 Apr 1;92(7)
Journal of virology 2018 Apr 1;92(7)
Mitomycin-Induced Pulmonary Veno-Occlusive Disease: Evidence From Human Disease and Animal Models.
Perros F, Günther S, Ranchoux B, Godinas L, Antigny F, Chaumais MC, Dorfmüller P, Hautefort A, Raymond N, Savale L, Jaïs X, Girerd B, Cottin V, Sitbon O, Simonneau G, Humbert M, Montani D
Circulation 2015 Sep 1;132(9):834-47
Circulation 2015 Sep 1;132(9):834-47
Endothelial-to-mesenchymal transition in pulmonary hypertension.
Ranchoux B, Antigny F, Rucker-Martin C, Hautefort A, Péchoux C, Bogaard HJ, Dorfmüller P, Remy S, Lecerf F, Planté S, Chat S, Fadel E, Houssaini A, Anegon I, Adnot S, Simonneau G, Humbert M, Cohen-Kaminsky S, Perros F
Circulation 2015 Mar 17;131(11):1006-18
Circulation 2015 Mar 17;131(11):1006-18
No comments: Submit comment
Supportive validation
- Submitted by
- Invitrogen Antibodies (provider)
- Main image
- Experimental details
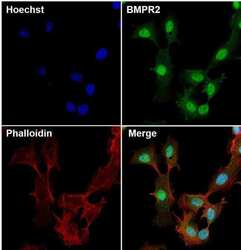
- Immunofluorescent analysis of BMPR2 (green) in HepG2 cells. The cells were fixed with 4% paraformaldehyde for 15 minutes at -20c, permeabilized with 0.1% Triton X-100 for 15 minutes, and blocked with 3% BSA for 30 minutes at room temperature. Cells were stained with a BMPR2 mouse monoclonal antibody (Product # MA5-15827) at a concentration of 10 µg/mL in blocking buffer for 1 hour at room temperature, and then incubated with a Goat anti-Mouse IgG (H+L) Secondary Antibody, Alexa Fluor Plus 488 conjugate (Product # A32723) at a dilution of 1:500 for at least 30 minutes at a room temperature in the dark (green). F-actin (red) was stained with Dylight 554 Phalloidin. Nuclei (blue) were stained with Hoechst 33342 (Product # 62249). Images were taken on a Thermo Scientific ToxInsight Instrument at 20X magnification.

- Submitted by
- Invitrogen Antibodies (provider)
- Main image

- Experimental details
- Immunofluorescent analysis of BMPR2 (green) in HepG2 cells. The cells were fixed with 4% paraformaldehyde for 15 minutes at -20c, permeabilized with 0.1% Triton X-100 for 15 minutes, and blocked with 3% BSA for 30 minutes at room temperature. Cells were stained with a BMPR2 mouse monoclonal antibody (Product # MA5-15827) at a concentration of 10 µg/mL in blocking buffer for 1 hour at room temperature, and then incubated with a Goat anti-Mouse IgG (H+L) Secondary Antibody, Alexa Fluor Plus 488 conjugate (Product # A32723) at a dilution of 1:500 for at least 30 minutes at a room temperature in the dark (green). F-actin (red) was stained with Dylight 554 Phalloidin. Nuclei (blue) were stained with Hoechst 33342 (Product # 62249). Images were taken on a Thermo Scientific ToxInsight Instrument at 20X magnification.

Supportive validation
- Submitted by
- Invitrogen Antibodies (provider)
- Main image
- Experimental details
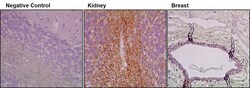
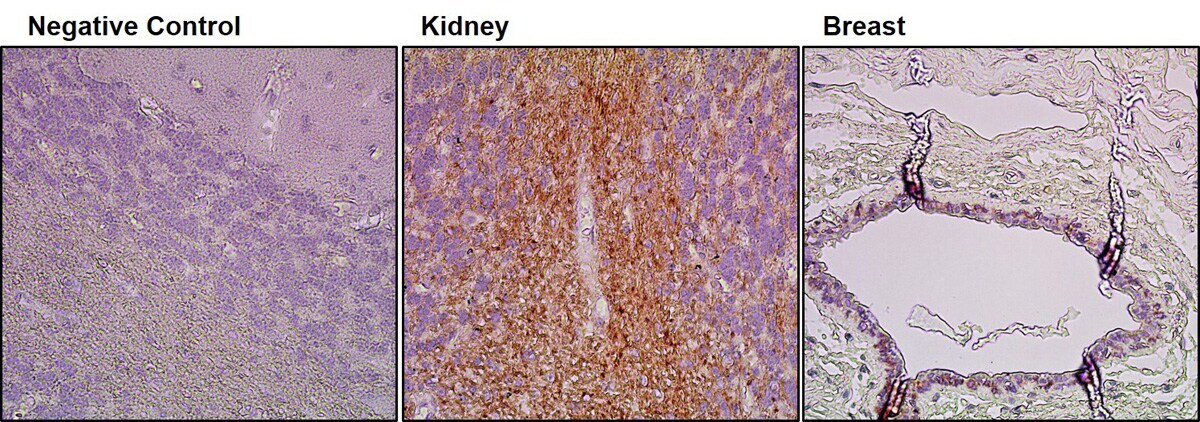
- Immunohistochemistry was performed on human kidney and human breast tissue. Tissue was deparaffinized with xylene, followed by rehydration in sequential washes of 100% ethanol, 95% ethanol, 80% ethanol, and water. To expose target proteins, antigen retrieval was performed using 10mM sodium citrate (pH 6.0) and heated for 20 min. Following antigen retrieval, tissues were blocked in a 10% goat serum (Product # 31872) in wash buffer solution for 30 minutes at room temperature and endogenous peroxidase activity quenched with Peroxidase Suppressor (Product # 35000). Tissue was then probed with a BMPR2 mouse monoclonal antibody (Product # MA5-15827) at a concentration of 2.5 µg/mL in 10% goat serum in wash buffer for 1 hour at room temperature in a humidified chamber. Negative control tissue received no primary antibody. Tissues were washed extensively with PBST, and detection was performed using a SuperBoost™ goat anti-mouse Poly HRP secondary antibody reagent (Product # B40961) followed by colorimetric detection using DAB Quanto (Product # TA-125-QHDX). Tissues were then counterstained with hematoxylin and prepped for mounting and imaging.
Supportive validation
- Submitted by
- Invitrogen Antibodies (provider)
- Main image
- Experimental details
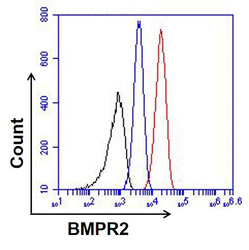
- Flow cytometry analysis of BMPR2 was done on HeLa cells. The cells were fixed, permeabilized and stained with a BMPR2 mouse monoclonal antibody (Product # MA5-15827, red histogram) or Mouse IgG isotype control (Product # 31903, blue histogram) at a concentration of 4ug/mL. Black histogram represents negative control unstained cell population. After incubation of the primary antibody on ice for an hour, the cells were stained with a Goat anti-Mouse IgG (H+L) Secondary Antibody, Dylight 680 conjugate (Product # 35519) at a dilution of 1:50 for at least 30 minutes on ice. A representative 10,000 cells were acquired for each sample.

- Submitted by
- Invitrogen Antibodies (provider)
- Main image
- Experimental details
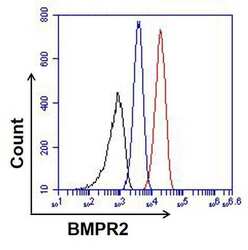
- Flow cytometry analysis of BMPR2 was done on HeLa cells. The cells were fixed, permeabilized and stained with a BMPR2 mouse monoclonal antibody (Product # MA5-15827, red histogram) or Mouse IgG isotype control (Product # 31903, blue histogram) at a concentration of 4 µg/mL. Black histogram represents negative control unstained cell population. After incubation of the primary antibody on ice for an hour, the cells were stained with a Goat anti-Mouse IgG (H+L) Secondary Antibody, Dylight 680 conjugate (Product # 35519) at a dilution of 1:50 for at least 30 minutes on ice. A representative 10,000 cells were acquired for each sample.
- Submitted by
- Invitrogen Antibodies (provider)
- Main image

- Experimental details
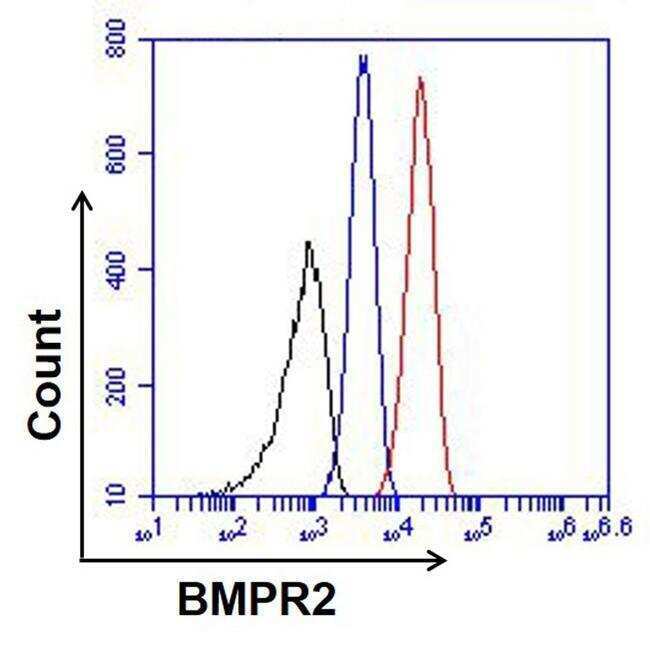
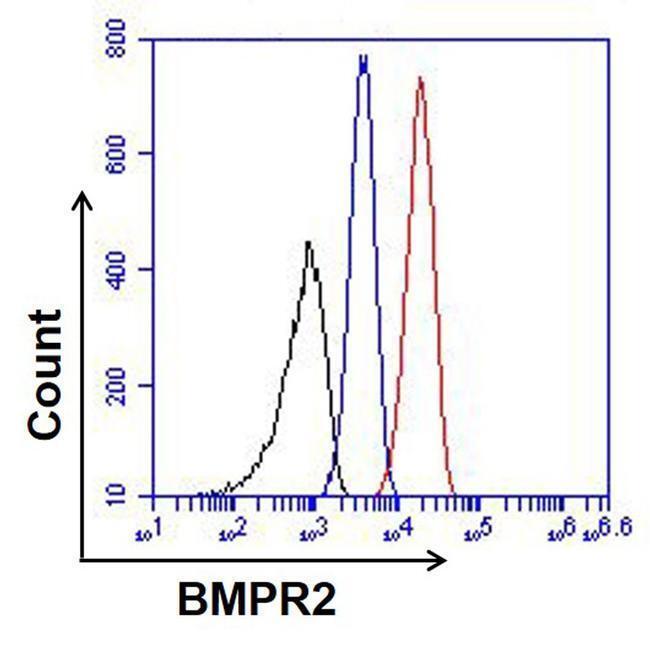
- Flow cytometry analysis of BMPR2 was done on HeLa cells. The cells were fixed, permeabilized and stained with a BMPR2 mouse monoclonal antibody (Product # MA5-15827, red histogram) or Mouse IgG isotype control (Product # 31903, blue histogram) at a concentration of 4 µg/mL. Black histogram represents negative control unstained cell population. After incubation of the primary antibody on ice for an hour, the cells were stained with a Goat anti-Mouse IgG (H+L) Secondary Antibody, Dylight 680 conjugate (Product # 35519) at a dilution of 1:50 for at least 30 minutes on ice. A representative 10,000 cells were acquired for each sample.
Supportive validation
- Submitted by
- Invitrogen Antibodies (provider)
- Main image
- Experimental details
- NULL
- Submitted by
- Invitrogen Antibodies (provider)
- Main image
- Experimental details
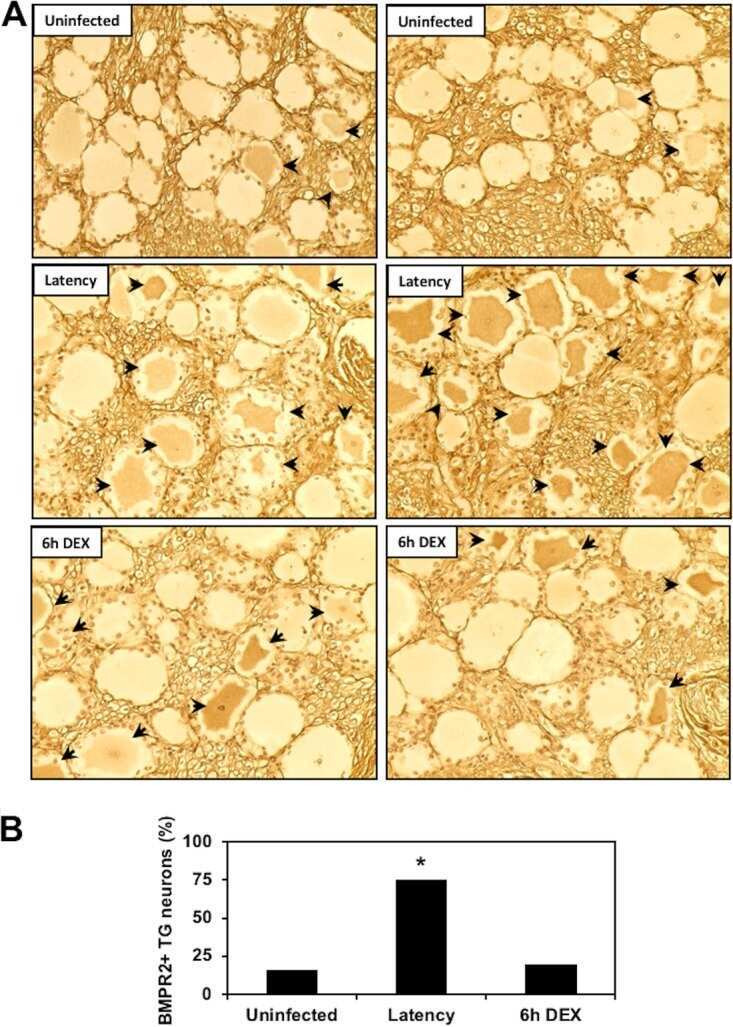
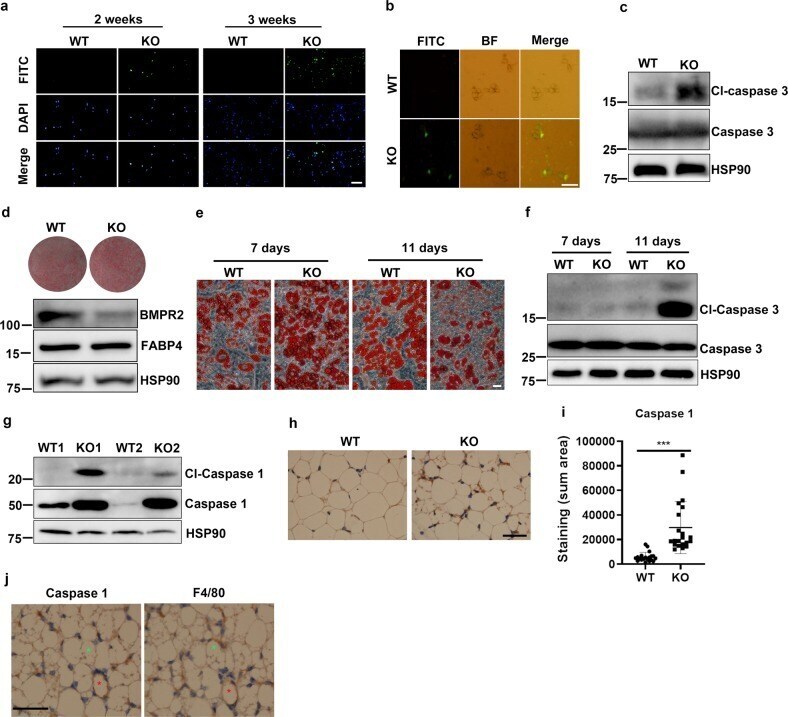
- Fig. 2 BMPR2 deficiency increases adipocyte death in white adipose tissue. a TUNEL (FITC) assay shows apoptosis in WT and BMPR2 knockout iWAT performed on tissue slides. Scale bar: 20 mum. b TUNEL (FITC) assay shows apoptosis in smeared mature adipocytes isolated from iWAT of 16-day-old mice. Scale bar: 20 mum. c Western blot analysis of caspase 3 in pooled mature adipocytes isolated from iWAT of four individuals in each group. d Precursor cells were isolated from iWAT of WT and KO mice and induced to differentiation. Oil red O staining for mature adipocytes showed the differentiation rate, and Western blots showed levels of BMPR2, FABP4, and HSP90 (loading control) in the two groups of cells. e Representative images showed the appearance of adipocytes of WT BMPR2 KO and cells at days 7 and 11 after induced to differentiation. Scale bar: 25 mum. f Western blot for cleaved caspase 3 showed the level of apoptosis of adipocytes in e . g Western blot analysis of caspase 1 in pooled mature adipocytes isolated from iWAT of four individuals in each group. h Immunochemistry showed positive staining for caspase 1 in iWAT of 19-day-old mice. Scale bar: 20 mum. i Quantitation of caspase 1-positive area on slides with ImageJ software (lower panel). Data were collected from sections of three individual mice, 6-8 fields per mouse. Data are expressed as means +- SD. *** p < 0.001. j Staining for caspase 1 and F4/80 by immunochemistry on sequential sections. Stars with the same color indicat
- Submitted by
- Invitrogen Antibodies (provider)
- Main image
- Experimental details
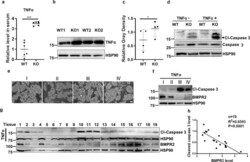
- Fig. 3 BMPR2-deficient adipocytes are sensitive to TNFalpha-induced apoptosis. a Levels of TNFalpha in serum of 14-day-old mice were determined using ELISA. n = 6. Data are expressed as means +- SD. ***p < 0.001. b Representative image of Western blot for TNFalpha in iWAT of two pairs of littermates at 14 days old. c Statistical analysis for the gray density of TNFalpha bands after normalized with HSP90 in Western blot assay described in c ( n = 4). Data are expressed as means +- SD. * p < 0.05. d Western blot showed levels of cleaved caspase 3 and total caspase 3 in differentiated adipocytes from precursor cell in culture. e Image of mature adipocytes differentiated from isolated precursor cells in subcutaneous WAT at hip region of four human individuals. Scale bar: 25 mum. f Western blot showed levels of BMPR2 and cleaved caspase 3 (Cl-Caspase 3) in cells of d . g Western blot showing the levels of BMPR2 and cleaved caspase 3 in human subcutaneous adipose tissues from hip region (left panel). h Levels of BMPR2 and cleaved caspase 3 in g were normalized by HSP90 and analysis for linear regression to show their correlation (right panel).

- Submitted by
- Invitrogen Antibodies (provider)
- Main image

- Experimental details
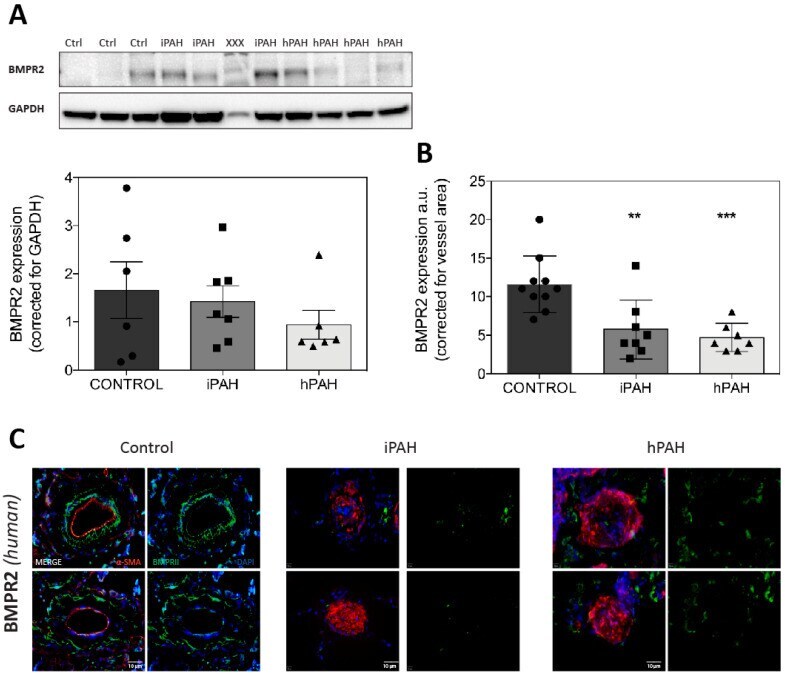
- Figure 1 Western blot analysis of BMPR2 protein expression in the whole lung homogenates of idiopathic PAH (iPAH) and hereditary PAH (hPAH). ( A ): BMPR2 expression in the whole lung homogenates. xxx = non-relevant sample. ( B ): BMPR2 expression corrected for the vessel area. ( C ): Typical examples of vessels are shown. Green = BMPR2; red = smooth-muscle-actin (alpha-SMA); blue = nuclei. ** = p < 0.01 / *** = p < 0.001.
- Submitted by
- Invitrogen Antibodies (provider)
- Main image
- Experimental details
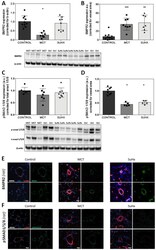
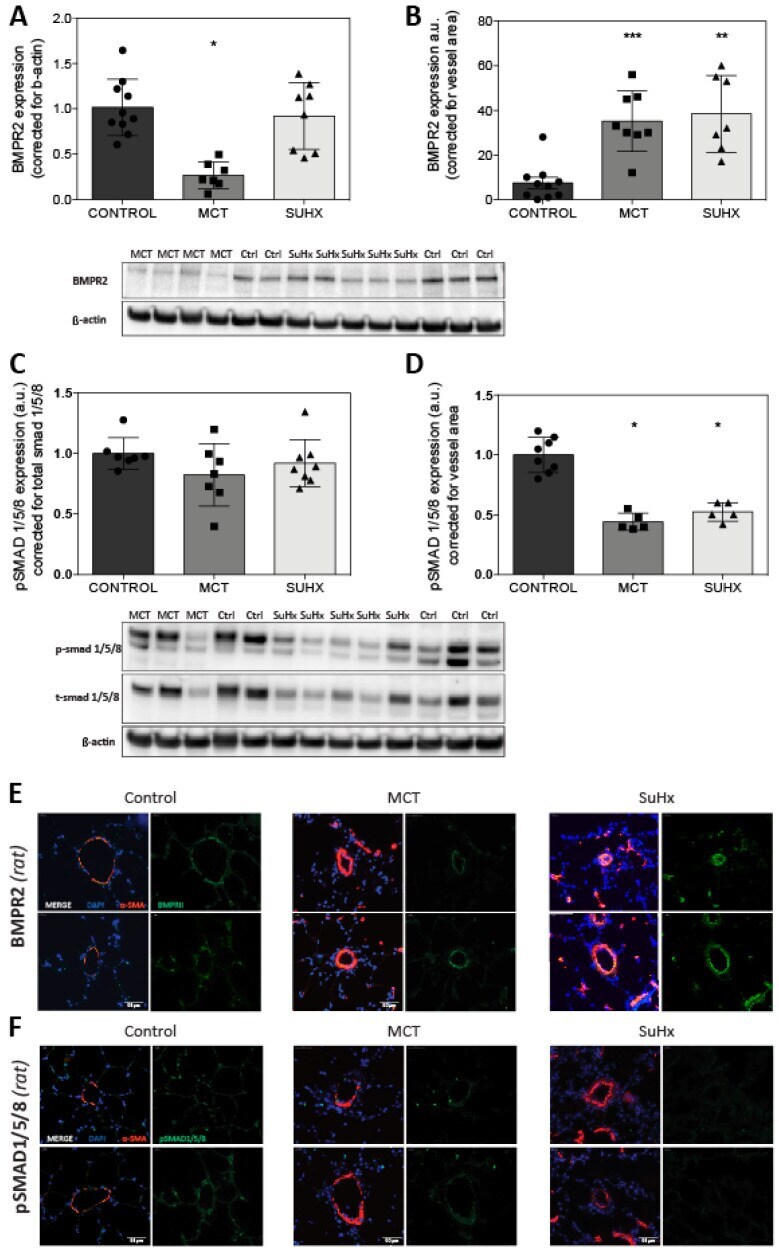
- Figure 4 BMPR2 and pSmad 1/5/8 protein expression in the whole lung homogenates vs. immunofluorescence. ( A - B ): Analysis of the protein expression by Western blot; and ( C - D ): immunofluorescence. ( E ): Typical examples are shown. Green = pSmad 1/5/8 or BMPR2; red = smooth-muscle-actin (alpha-SMA); blue = nuclei. Scale bar = 50 mum. * = p < 0.05/** = p < 0.01/*** = p < 0.001.
- Submitted by
- Invitrogen Antibodies (provider)
- Main image

- Experimental details
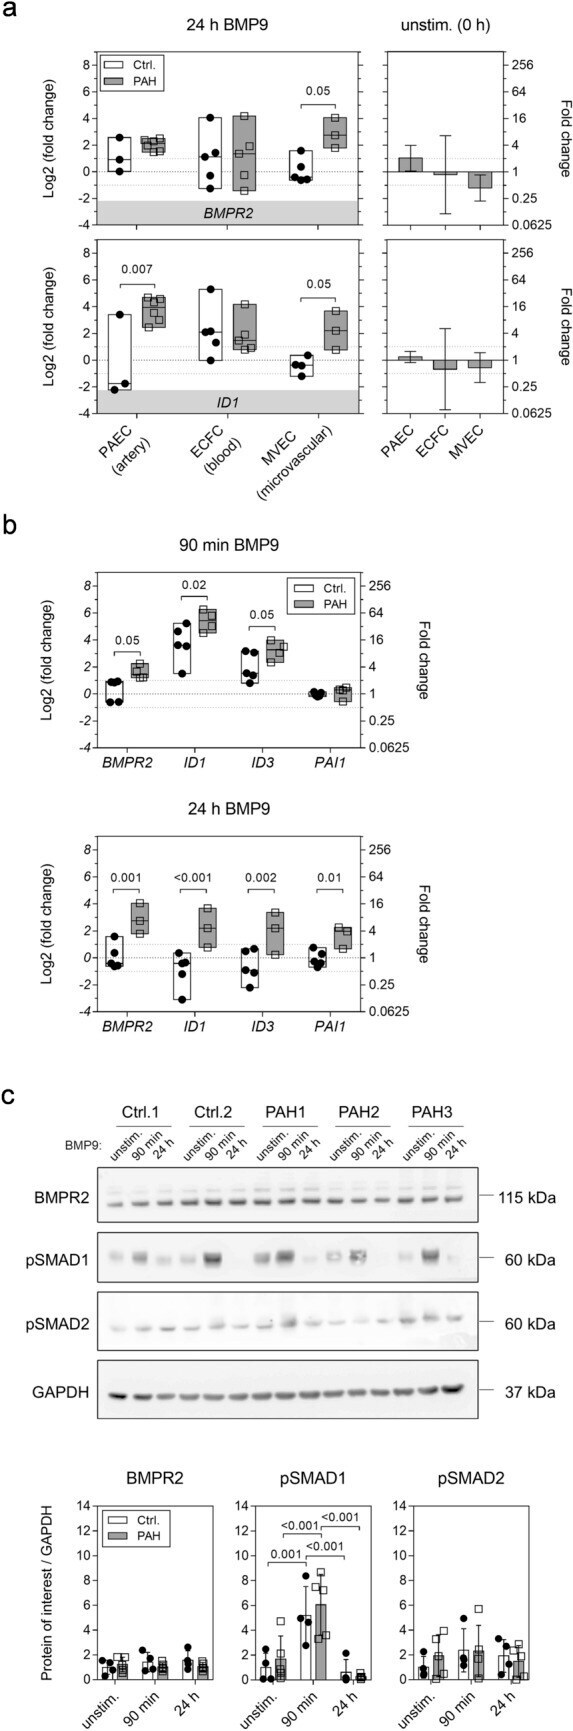
- Fig. 1 The human microvascular lung endothelium of PAH patients shows a distinct transcriptional response to long-term BMP9 stimulation. a Box plots show RT-PCR analysis of gene expression in lung microvascular (MVECs), pulmonary arterial (PAECs), and peripheral blood-derived circulating (ECFCs) endothelial cells in response to 24-h activation with BMP9. Data are presented as min, max, and median log2-fold changes compared to unstimulated conditions. Bar graphs represent mean basal gene expression with appropriate confidence intervals before BMP9 addition in PAH samples compared to controls. b RT-PCR quantification of gene regulation in MVECs after 90-min or 24-h BMP9 compared to unstimulated levels. c Representative Western blot from whole MVEC lysates. Bar graphs contain protein quantifications of all tested donors normalized to GAPDH. Two-way ANOVAs with Tukey multiple comparison correction were applied to calculate p values in between donor groups (ctrl. vs. PAH, a and b ) or all individual conditions and donors ( c )
- Submitted by
- Invitrogen Antibodies (provider)
- Main image
- Experimental details
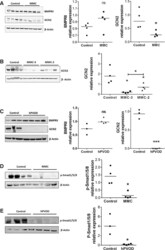
- Figure 7. Pulmonary levels of BMPRII GCN2 and p-smad1&sol5&sol8 in human PVOD and MMC-induced PVOD-like PH in rats as measured by Western blot analysis (WB). &bgr-Actin was used as loading control. Right panels: quantification of the WBs. A , BMPRII and GCN2 protein expression in lungs from controls or rats exposed to a single dose of MMC (4 mg&solkg). B , GCN2 protein expression in lungs from controls or rats exposed to 2 low (2 mg&solkg) or high (3 mg&solkg) doses of MMC. C , BMPRII and GCN2 protein expression in lungs from controls or human heritable PVOD (hPVOD) explanted lungs. D , p-smad1&sol5&sol8 phosphoprotein expression in lungs from controls or rats exposed to a single dose of MMC (4 mg&solkg). E , p-smad1&sol5&sol8 phosphoprotein expression in lungs from controls or hPVOD explanted lungs. Box Plot (Min to Max); &ast P

- Submitted by
- Invitrogen Antibodies (provider)
- Main image

- Experimental details
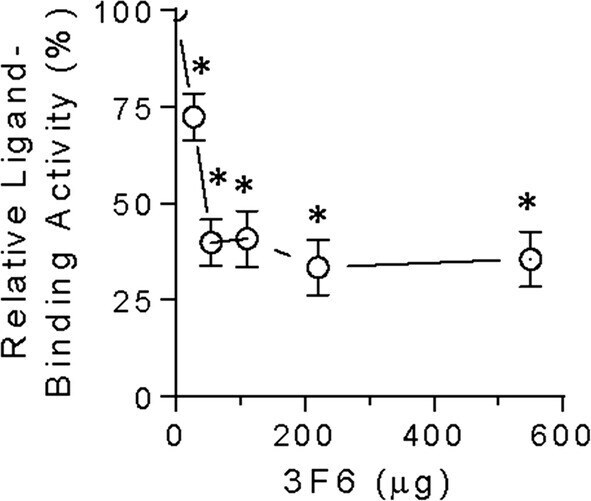
- Fig. 1 Antibody 3F6 reduces BMPR2-ECD ligand-binding activity in a modified immunoprecipitation assay. Neutralizing the ligand-binding activity of BMPR2-ECD using various amounts of 3F6. Results are quantified by ELISA and expressed as mean +- SEM relative to the ligand-binding activity of BMPR2-ECD in the absence of 3F6. n >= 3 per condition. Asterisk indicates p < 0.05 by paired t test