 Explore
 Validate
 Learn
Learn Flow cytometry
Antibody data
- Antibody Data
- Antigen structure
- References [27]
- Comments [0]
- Validations
- Flow cytometry [1]
- Other assay [27]
Submit
Validation data
Reference
Comment
Report error
- Product number
- 13-0289-82 - Provider product page

- Provider
- Invitrogen Antibodies
- Product name
- CD28 Monoclonal Antibody (CD28.2), Biotin, eBioscience™
- Antibody type
- Monoclonal
- Antigen
- Other
- Description
- Description: The CD28.2 monoclonal antibody reacts with the human CD28 molecule, a 44 kDa homodimer expressed by thymocytes, mature T cells and plasma cells. CD28 is a ligand for CD80 (B7-1) and CD86 (B7-2) and is a potent co-stimulator of T cells. Signaling through CD28 augments IL-2 and IL-2 receptor expression as well as cytotoxicity of CD3-activated T cells.
- Conjugate
- Biotin
- Antibody clone number
- CD28.2
- Concentration
- 0.5 mg/mL
Submitted references Atypical sideways recognition of CD1a by autoreactive γδ T cell receptors.
CD19 Chimeric Antigen Receptor-Exosome Targets CD19 Positive B-lineage Acute Lymphocytic Leukemia and Induces Cytotoxicity.
Effects of the Antidiabetic Drugs Evogliptin and Sitagliptin on the Immune Function of CD26/DPP4 in Th1 Cells.
JNK1 and ERK1/2 modulate lymphocyte homeostasis via BIM and DRP1 upon AICD induction.
SIRT1 is downregulated by autophagy in senescence and ageing.
Cytotoxic T cells swarm by homotypic chemokine signalling.
RAB11FIP5-Deficient Mice Exhibit Cytokine-Related Transcriptomic Signatures.
PD-1 and BTLA regulate T cell signaling differentially and only partially through SHP1 and SHP2.
Metformin Enhances Autophagy and Normalizes Mitochondrial Function to Alleviate Aging-Associated Inflammation.
Human Liver Memory CD8(+) T Cells Use Autophagy for Tissue Residence.
Selective Killing of Activated T Cells by 5-Aminolevulinic Acid Mediated Photodynamic Effect: Potential Improvement of Extracorporeal Photopheresis.
Expression of CD27 and CD28 on γδ T cells from the peripheral blood of patients with allergic rhinitis.
Flotillins promote T cell receptor sorting through a fast Rab5-Rab11 endocytic recycling axis.
Metabolic reprogramming of human CD8(+) memory T cells through loss of SIRT1.
Functional characterization of T-cells from palatine tonsils in patients with chronic tonsillitis.
The Distribution of Human Stem Cell-like Memory T Cell in Lung Cancer.
CD28 family of receptors on T cells in chronic HBV infection: Expression characteristics, clinical significance and correlations with PD-1 blockade.
Detailed characterization of tumor infiltrating lymphocytes in two distinct human solid malignancies show phenotypic similarities.
Aging and cytomegalovirus infection differentially and jointly affect distinct circulating T cell subsets in humans.
N-glycosylation of asparagine 8 regulates surface expression of major histocompatibility complex class I chain-related protein A (MICA) alleles dependent on threonine 24.
The autoimmune-predisposing variant of lymphoid tyrosine phosphatase favors T helper 1 responses.
TCR activation kinetics and feedback regulation in primary human T cells.
A novel method for autophagy detection in primary cells: impaired levels of macroautophagy in immunosenescent T cells.
T cell-signaling network analysis reveals distinct differences between CD28 and CD2 costimulation responses in various subsets and in the MAPK pathway between resting and activated regulatory T cells.
Cytokine requirements for the differentiation and expansion of IL-17A- and IL-22-producing human Vgamma2Vdelta2 T cells.
Phosphorylation of Bcl10 negatively regulates T-cell receptor-mediated NF-kappaB activation.
Dramatic increase in naive T cell turnover is linked to loss of naive T cells from old primates.
Wegrecki M, Ocampo TA, Gunasinghe SD, von Borstel A, Tin SY, Reijneveld JF, Cao TP, Gully BS, Le Nours J, Moody DB, Van Rhijn I, Rossjohn J
Nature communications 2022 Jul 5;13(1):3872
Nature communications 2022 Jul 5;13(1):3872
CD19 Chimeric Antigen Receptor-Exosome Targets CD19 Positive B-lineage Acute Lymphocytic Leukemia and Induces Cytotoxicity.
Haque S, Vaiselbuh SR
Cancers 2021 Mar 19;13(6)
Cancers 2021 Mar 19;13(6)
Effects of the Antidiabetic Drugs Evogliptin and Sitagliptin on the Immune Function of CD26/DPP4 in Th1 Cells.
Yoon H, Sung JH, Song MJ
Biomolecules & therapeutics 2021 Mar 1;29(2):154-165
Biomolecules & therapeutics 2021 Mar 1;29(2):154-165
JNK1 and ERK1/2 modulate lymphocyte homeostasis via BIM and DRP1 upon AICD induction.
Simula L, Corrado M, Accordi B, Di Rita A, Nazio F, Antonucci Y, Di Daniele A, Caicci F, Caruana I, Soriano ME, Pigazzi M, Locatelli F, Cecconi F, Campello S
Cell death and differentiation 2020 Oct;27(10):2749-2767
Cell death and differentiation 2020 Oct;27(10):2749-2767
SIRT1 is downregulated by autophagy in senescence and ageing.
Xu C, Wang L, Fozouni P, Evjen G, Chandra V, Jiang J, Lu C, Nicastri M, Bretz C, Winkler JD, Amaravadi R, Garcia BA, Adams PD, Ott M, Tong W, Johansen T, Dou Z, Berger SL
Nature cell biology 2020 Oct;22(10):1170-1179
Nature cell biology 2020 Oct;22(10):1170-1179
Cytotoxic T cells swarm by homotypic chemokine signalling.
Galeano Niño JL, Pageon SV, Tay SS, Colakoglu F, Kempe D, Hywood J, Mazalo JK, Cremasco J, Govendir MA, Dagley LF, Hsu K, Rizzetto S, Zieba J, Rice G, Prior V, O'Neill GM, Williams RJ, Nisbet DR, Kramer B, Webb AI, Luciani F, Read MN, Biro M
eLife 2020 Oct 13;9
eLife 2020 Oct 13;9
RAB11FIP5-Deficient Mice Exhibit Cytokine-Related Transcriptomic Signatures.
Li D, Bradley T, Cain DW, Pedroza-Pacheco I, Aggelakopoulou M, Parks R, Barr M, Xia SM, Scearce R, Bowman C, Stevens G, Newman A, Hora B, Chen Y, Riebe K, Wang Y, Sempowski G, Saunders KO, Borrow P, Haynes BF
ImmunoHorizons 2020 Nov 10;4(11):713-728
ImmunoHorizons 2020 Nov 10;4(11):713-728
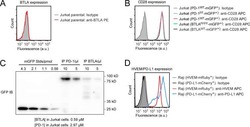
PD-1 and BTLA regulate T cell signaling differentially and only partially through SHP1 and SHP2.
Xu X, Hou B, Fulzele A, Masubuchi T, Zhao Y, Wu Z, Hu Y, Jiang Y, Ma Y, Wang H, Bennett EJ, Fu G, Hui E
The Journal of cell biology 2020 Jun 1;219(6)
The Journal of cell biology 2020 Jun 1;219(6)
Metformin Enhances Autophagy and Normalizes Mitochondrial Function to Alleviate Aging-Associated Inflammation.
Bharath LP, Agrawal M, McCambridge G, Nicholas DA, Hasturk H, Liu J, Jiang K, Liu R, Guo Z, Deeney J, Apovian CM, Snyder-Cappione J, Hawk GS, Fleeman RM, Pihl RMF, Thompson K, Belkina AC, Cui L, Proctor EA, Kern PA, Nikolajczyk BS
Cell metabolism 2020 Jul 7;32(1):44-55.e6
Cell metabolism 2020 Jul 7;32(1):44-55.e6
Human Liver Memory CD8(+) T Cells Use Autophagy for Tissue Residence.
Swadling L, Pallett LJ, Diniz MO, Baker JM, Amin OE, Stegmann KA, Burton AR, Schmidt NM, Jeffery-Smith A, Zakeri N, Suveizdyte K, Froghi F, Fusai G, Rosenberg WM, Davidson BR, Schurich A, Simon AK, Maini MK
Cell reports 2020 Jan 21;30(3):687-698.e6
Cell reports 2020 Jan 21;30(3):687-698.e6
Selective Killing of Activated T Cells by 5-Aminolevulinic Acid Mediated Photodynamic Effect: Potential Improvement of Extracorporeal Photopheresis.
Darvekar S, Juzenas P, Oksvold M, Kleinauskas A, Holien T, Christensen E, Stokke T, Sioud M, Peng Q
Cancers 2020 Feb 6;12(2)
Cancers 2020 Feb 6;12(2)
Expression of CD27 and CD28 on γδ T cells from the peripheral blood of patients with allergic rhinitis.
Wang Q, Sun Q, Chen Q, Li H, Liu D
Experimental and therapeutic medicine 2020 Dec;20(6):224
Experimental and therapeutic medicine 2020 Dec;20(6):224
Flotillins promote T cell receptor sorting through a fast Rab5-Rab11 endocytic recycling axis.
Redpath GMI, Ecker M, Kapoor-Kaushik N, Vartoukian H, Carnell M, Kempe D, Biro M, Ariotti N, Rossy J
Nature communications 2019 Sep 26;10(1):4392
Nature communications 2019 Sep 26;10(1):4392
Metabolic reprogramming of human CD8(+) memory T cells through loss of SIRT1.
Jeng MY, Hull PA, Fei M, Kwon HS, Tsou CL, Kasler H, Ng CP, Gordon DE, Johnson J, Krogan N, Verdin E, Ott M
The Journal of experimental medicine 2018 Jan 2;215(1):51-62
The Journal of experimental medicine 2018 Jan 2;215(1):51-62
Functional characterization of T-cells from palatine tonsils in patients with chronic tonsillitis.
Geißler K, Markwart R, Requardt RP, Weigel C, Schubert K, Scherag A, Rubio I, Guntinas-Lichius O
PloS one 2017;12(9):e0183214
PloS one 2017;12(9):e0183214
The Distribution of Human Stem Cell-like Memory T Cell in Lung Cancer.
Hong H, Gu Y, Sheng SY, Lu CG, Zou JY, Wu CY
Journal of immunotherapy (Hagerstown, Md. : 1997) 2016 Jul-Aug;39(6):233-40
Journal of immunotherapy (Hagerstown, Md. : 1997) 2016 Jul-Aug;39(6):233-40
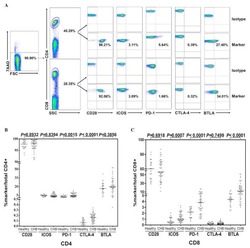
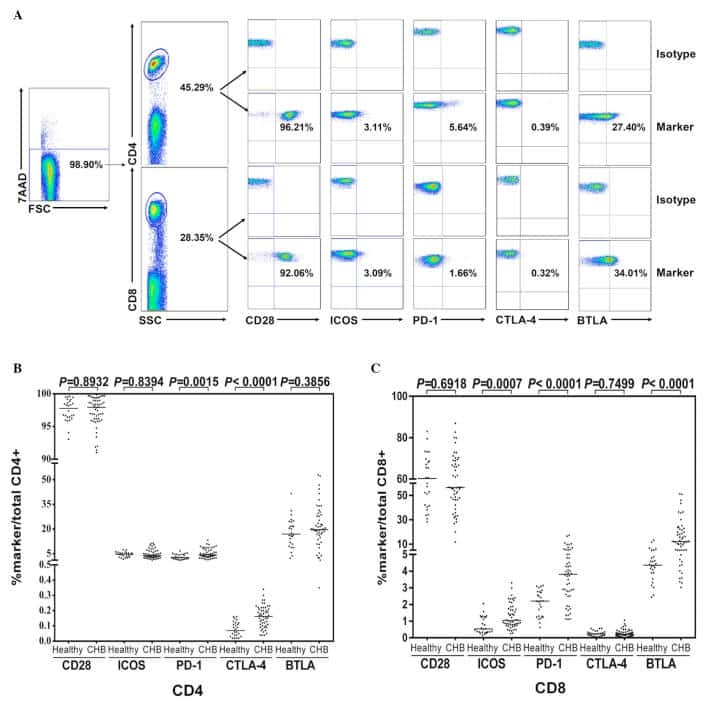
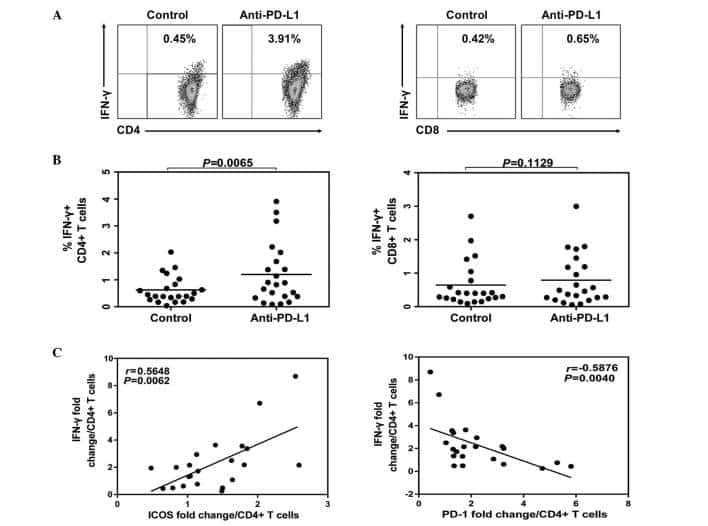
CD28 family of receptors on T cells in chronic HBV infection: Expression characteristics, clinical significance and correlations with PD-1 blockade.
Tang ZS, Hao YH, Zhang EJ, Xu CL, Zhou Y, Zheng X, Yang DL
Molecular medicine reports 2016 Aug;14(2):1107-16
Molecular medicine reports 2016 Aug;14(2):1107-16
Detailed characterization of tumor infiltrating lymphocytes in two distinct human solid malignancies show phenotypic similarities.
Kovacsovics-Bankowski M, Chisholm L, Vercellini J, Tucker CG, Montler R, Haley D, Newell P, Ma J, Tseng P, Wolf R, Vetto JT, Hammill C, Hansen P, Weinberg AD
Journal for immunotherapy of cancer 2014;2(1):38
Journal for immunotherapy of cancer 2014;2(1):38
Aging and cytomegalovirus infection differentially and jointly affect distinct circulating T cell subsets in humans.
Wertheimer AM, Bennett MS, Park B, Uhrlaub JL, Martinez C, Pulko V, Currier NL, Nikolich-Žugich D, Kaye J, Nikolich-Žugich J
Journal of immunology (Baltimore, Md. : 1950) 2014 Mar 1;192(5):2143-55
Journal of immunology (Baltimore, Md. : 1950) 2014 Mar 1;192(5):2143-55
N-glycosylation of asparagine 8 regulates surface expression of major histocompatibility complex class I chain-related protein A (MICA) alleles dependent on threonine 24.
Mellergaard M, Skovbakke SL, Schneider CL, Lauridsen F, Andresen L, Jensen H, Skov S
The Journal of biological chemistry 2014 Jul 18;289(29):20078-91
The Journal of biological chemistry 2014 Jul 18;289(29):20078-91
The autoimmune-predisposing variant of lymphoid tyrosine phosphatase favors T helper 1 responses.
Vang T, Landskron J, Viken MK, Oberprieler N, Torgersen KM, Mustelin T, Tasken K, Tautz L, Rickert RC, Lie BA
Human immunology 2013 May;74(5):574-85
Human immunology 2013 May;74(5):574-85
TCR activation kinetics and feedback regulation in primary human T cells.
Poltorak M, Arndt B, Kowtharapu BS, Reddycherla AV, Witte V, Lindquist JA, Schraven B, Simeoni L
Cell communication and signaling : CCS 2013 Jan 14;11:4
Cell communication and signaling : CCS 2013 Jan 14;11:4
A novel method for autophagy detection in primary cells: impaired levels of macroautophagy in immunosenescent T cells.
Phadwal K, Alegre-Abarrategui J, Watson AS, Pike L, Anbalagan S, Hammond EM, Wade-Martins R, McMichael A, Klenerman P, Simon AK
Autophagy 2012 Apr;8(4):677-89
Autophagy 2012 Apr;8(4):677-89
T cell-signaling network analysis reveals distinct differences between CD28 and CD2 costimulation responses in various subsets and in the MAPK pathway between resting and activated regulatory T cells.
Kalland ME, Oberprieler NG, Vang T, Taskén K, Torgersen KM
Journal of immunology (Baltimore, Md. : 1950) 2011 Nov 15;187(10):5233-45
Journal of immunology (Baltimore, Md. : 1950) 2011 Nov 15;187(10):5233-45
Cytokine requirements for the differentiation and expansion of IL-17A- and IL-22-producing human Vgamma2Vdelta2 T cells.
Ness-Schwickerath KJ, Jin C, Morita CT
Journal of immunology (Baltimore, Md. : 1950) 2010 Jun 15;184(12):7268-80
Journal of immunology (Baltimore, Md. : 1950) 2010 Jun 15;184(12):7268-80
Phosphorylation of Bcl10 negatively regulates T-cell receptor-mediated NF-kappaB activation.
Zeng H, Di L, Fu G, Chen Y, Gao X, Xu L, Lin X, Wen R
Molecular and cellular biology 2007 Jul;27(14):5235-45
Molecular and cellular biology 2007 Jul;27(14):5235-45
Dramatic increase in naive T cell turnover is linked to loss of naive T cells from old primates.
Cicin-Sain L, Messaoudi I, Park B, Currier N, Planer S, Fischer M, Tackitt S, Nikolich-Zugich D, Legasse A, Axthelm MK, Picker LJ, Mori M, Nikolich-Zugich J
Proceedings of the National Academy of Sciences of the United States of America 2007 Dec 11;104(50):19960-5
Proceedings of the National Academy of Sciences of the United States of America 2007 Dec 11;104(50):19960-5
No comments: Submit comment
Supportive validation
- Submitted by
- Invitrogen Antibodies (provider)
- Main image

- Experimental details
- Staining of normal human peripheral blood cells with Anti-Human CD28 Biotin followed by detection with Streptavidin PE (Product # 12-4317-87). Cells in the lymphocyte gate were used for analysis.
- Conjugate
- Biotin

Supportive validation
- Submitted by
- Invitrogen Antibodies (provider)
- Main image
- Experimental details
- NULL
- Conjugate
- Biotin
- Submitted by
- Invitrogen Antibodies (provider)
- Main image
- Experimental details
- NULL
- Conjugate
- Biotin

- Submitted by
- Invitrogen Antibodies (provider)
- Main image
- Experimental details
- NULL
- Conjugate
- Biotin

- Submitted by
- Invitrogen Antibodies (provider)
- Main image
- Experimental details
- NULL
- Conjugate
- Biotin

- Submitted by
- Invitrogen Antibodies (provider)
- Main image
- Experimental details
- NULL
- Conjugate
- Biotin
- Submitted by
- Invitrogen Antibodies (provider)
- Main image

- Experimental details
- NULL
- Conjugate
- Biotin
- Submitted by
- Invitrogen Antibodies (provider)
- Main image
- Experimental details
- NULL
- Conjugate
- Biotin
- Submitted by
- Invitrogen Antibodies (provider)
- Main image

- Experimental details
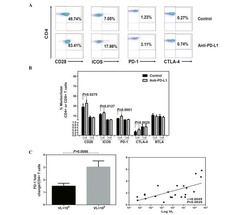
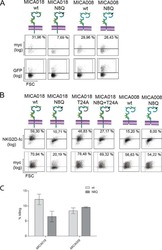
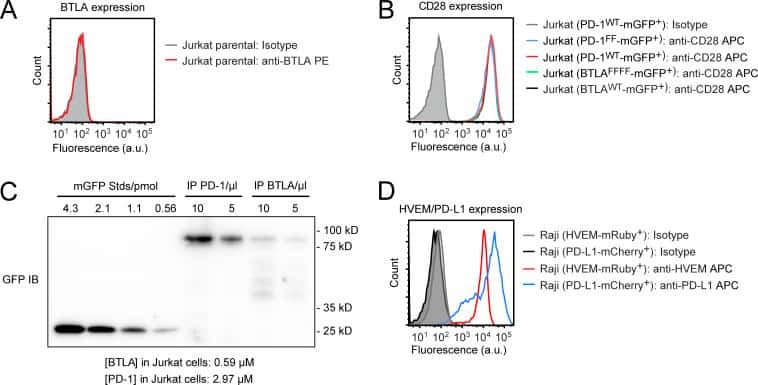
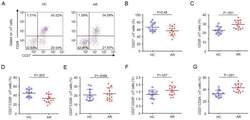
- Figure 5 CD8 + T cells phenotype in CRC and OVC patients. A . An example of flow cytometric analysis of CD3 + CD8 + T cells analyzed for CD28 and Ki-67, upper panels, and HLA-DR and CD38, lower panels. Percentage of Ki-67 + CD8 T cells in CRC samples (n = 16) B . and OVC samples (n = 22) C . Co-expression of CD38 and HLA-DR on CD8 + T cells in CRC samples (D) and OVC samples (E) .
- Conjugate
- Biotin
- Submitted by
- Invitrogen Antibodies (provider)
- Main image
- Experimental details
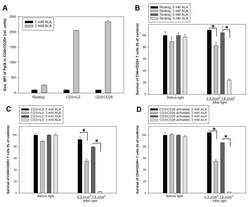
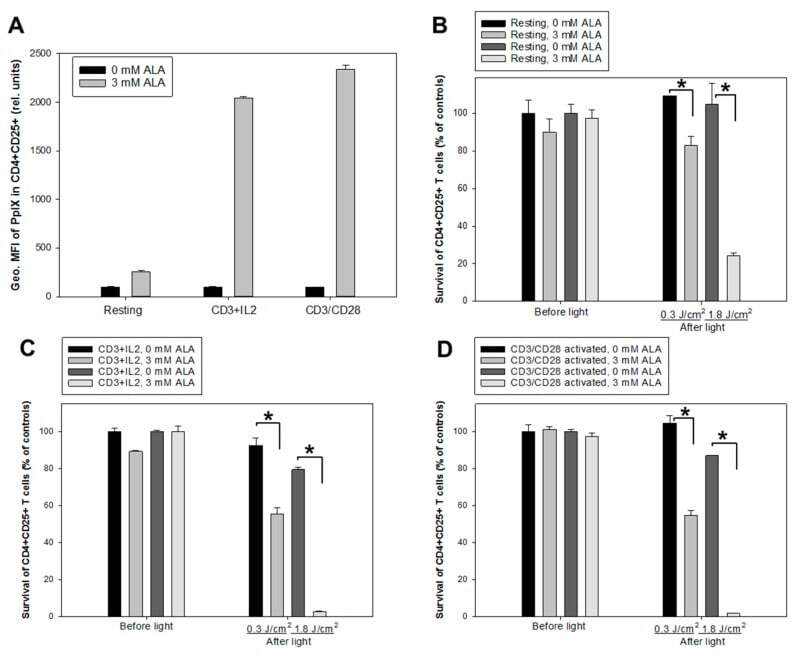
- Figure 5 ALA-induced PpIX production and PDT of CD4 + CD25 + T cells. Healthy donor PBMCs were either activated in vitro with anti-CD3/IL-2 or anti-CD3/CD28 or kept non-activated (resting) for three days. ( A ) geometric mean fluorescence intensity (Geo. MFI) of PpIX in CD4 + CD25 + cells incubated with 3 mM ALA for 1 h at 37 degC after anti-CD3/IL-2 or anti-CD3/CD28 activation; ( B , C and D ) resting and activated cells were incubated with 3 mM ALA for 1 h and then exposed to the in-house built LED blue light as indicated. The survivals of CD4 + CD25 + T cells were measured before light or 20 h after light exposure with flow cytometry as described in Figure 3 ; ( B ) for resting cells; while ( C and D ) for activated cells with anti-CD3/IL-2 and anti-CD3/CD28, respectively. * p < 0.05.
- Conjugate
- Biotin
- Submitted by
- Invitrogen Antibodies (provider)
- Main image
- Experimental details
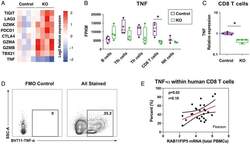
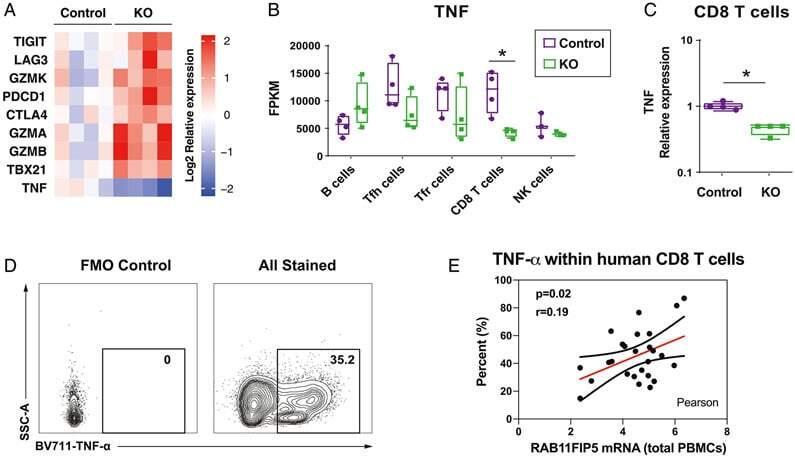
- FIGURE 4. Rab11Fip5 expression is associated with TNF-alpha production in CD8 + T cells. ( A ) Comparison of expression of genes encoding key immune checkpoints, cytokines, and cytotoxic proteases in CD8 + T cells from immunized RAB11FIP5 -/- mice and immunized control mice, shown as a heat map. TIGIT, LAG3, CTLA4 , and PDCD1 are the genes encoding immune checkpoint markers TIGIT, LAG-3, CTLA-4, and PD-1, respectively. TBX21 is the gene encoding T-Box Transcription Factor 21 (TBX21), also known as T-bet. GZMA, GZMB , and GZMK represent genes encoding granzyme A, B, and K. TNF is the gene encoding the cytokine TNF-alpha. ( B and C ) TNF expression in different cell types from immunized RAB11FIP5 -/- mice or control RAB11FIP5 fl/fl mice shown as fragments per kb of transcript per million mapped reads (FPKM) (B) and relative expression as determined by qPCR in CD8 + T cells (C). ( D and E ) TNF-alpha production by CD8 + T cells correlates with RAB11FIP5 mRNA expression in human PBMC. PBMC from 26 subjects were activated with anti-CD3/CD28 Abs for 3 d and then stimulated with PMA + ionomycin for 5 h before intracellular staining for TNF-alpha. (D) Representative example of intracellular staining for TNF-alpha (gated on CD3 + CD4 - T cells); the TNF-alpha + subset was defined based on a fluorescence minus one control. (E) Pearson analysis of the correlation between the percentage of TNF-alpha + cells within CD8 T cells and RAB11FIP5 mRNA expression in PBMC ( n = 26). Each dot repr
- Conjugate
- Biotin
- Submitted by
- Invitrogen Antibodies (provider)
- Main image
- Experimental details
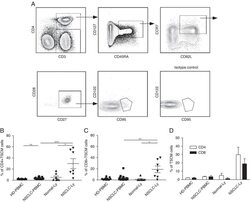
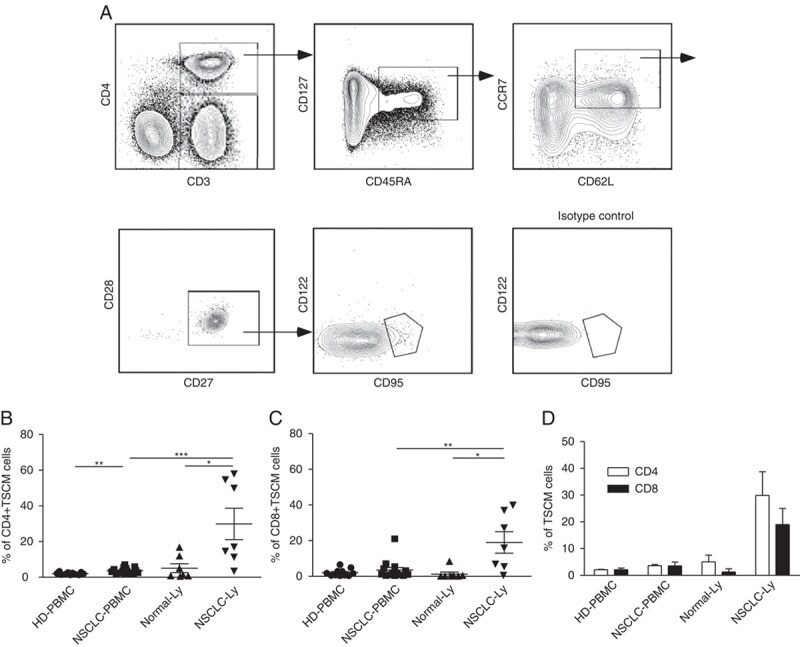
- FIGURE 1 Identification of Tscm CD4 + CD45RA + CD45RO - CD62L + CCR7 + CD127 + CD27 + CD28 + CD95 + CD122 + T (Tscm) cell in human blood and lymph nodes. PBMCs were isolated from the blood of non-small cell lung cancer (NSCLC) patients (n=15) (NSCLC-PBMC) and healthy donors (n=11) (HD-PBMC); lymphocytes were isolated from the tumor-infiltrated lymph node of NSCLC patients who were collected blood at same time (n=7) (NSCLC-Ly); lymphocytes were isolated from the healthy lymph node of non lung cancer patients (n=7) (Normal-Ly), analyzed by flow cytometry. A, Representative flow cytometric analyses of CD4 + CD45RA + CD45RO - CD62L + CCR7 + CD127 + CD27 + CD28 + CD95 + CD122 + T cells, indicating Tscm cells. B, The frequency of the CD4 + Tscm cells in the HD-PBMC, NSCLC-PBMC, Normal-Ly, NSCLC-Ly. The events of CD4 + Tscm cells in the blood and lymph node from NSCLC patients and healthy donors, expressed as the mean+-SEM. C, The frequency of the CD8 + Tscm cells in the HD-PBMC, NSCLC-PBMC, Normal-Ly, NSCLC-Ly, expressed as the mean+-SEM. D, The events of Tscm of CD4 + and CD8 + cells in the blood and the lymph node from NSCLC patients and healthy donors. HD indicates healthy donors; IFN, interferon; PBMC, peripheral blood mononuclear cells; Tscm cell, stem cell-like memory T cell. * P
- Conjugate
- Biotin
- Submitted by
- Invitrogen Antibodies (provider)
- Main image
- Experimental details
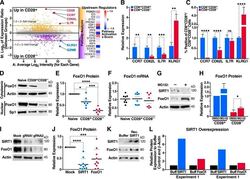
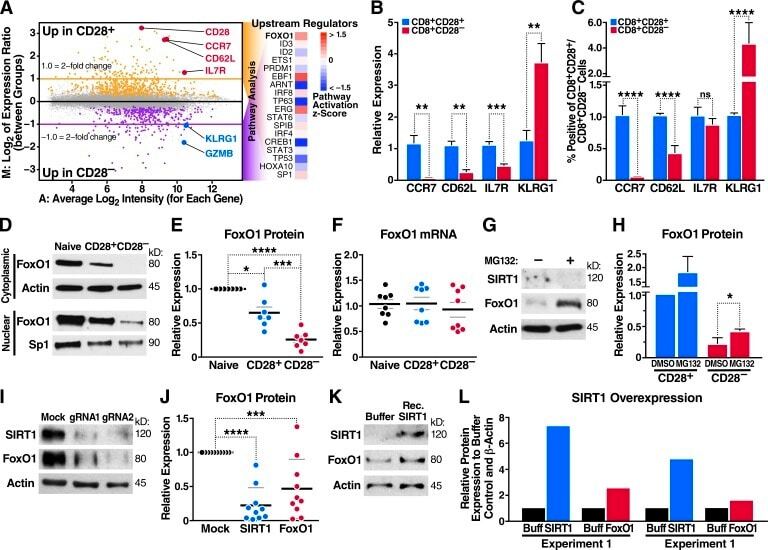
- Figure 3. Altered FoxO1 gene expression in CD8 + CD28 - T cells. (A) Microarray analysis in CD8 + CD28 + and CD28 - T cells, predicting FoxO1 as an altered transcriptional regulator in CD8 + CD28 - T cells. (B) CCR7 , CD62L , IL7R , and KLRG1 mRNA were assessed by qRT-PCR and normalized to RPL13A mRNA from sorted human T cell populations ( n = 5, paired one-way ANOVA). (C) Peripheral blood mononuclear cells were stained for CD3, CD8, CD28, and indicated markers as in B and analyzed by flow cytometry ( n = 5, paired one-way ANOVA). (D and E) FoxO1 expression in sorted human T cells was measured by Western blot (representative, n = 7, paired two-tailed Student's t test). (F) FoxO1 mRNA was analyzed by qRT-PCR and normalized to RPL13A ( n = 8). (G and H) CD28 + and CD28 - T cells were treated with 20 uM MG132 for 6 h, and FoxO1 expression was measured by Western blot ( n = 3, unpaired two-tailed Student's t test, G shows CD28 - T cells). (I and J) SIRT1 knockdown by Cas9-RNP nucleofection and Western blot for SIRT1 and FoxO1 expression ( n = 9, two-way ANOVA). (K) Nucleofection of recombinant SIRT1 protein into CD8 + T cells and Western blot for SIRT1 and FoxO1 protein 18 h after nucleofection (representative, n = 2). (L) Densitometry of two independent experiments ( n = 2). Data are mean +- SEM of individual donors. *, P < 0.05; **, P < 0.01; ***, P < 0.001; ****, P < 0.000. ns, not significant.
- Conjugate
- Biotin
- Submitted by
- Invitrogen Antibodies (provider)
- Main image
- Experimental details
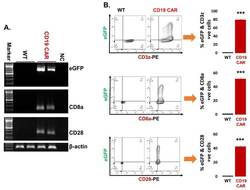
- Figure 2 Confirmation of CD19 CAR plasmid into the transfected producer cell line. ( A ) Agarose gel demonstrating cellular mRNA expression (eGFP, CD8a, and CD28) in CD19 CAR plasmid transfected HEK293T cells and control non-transfected cells (WT-control). The beta-actin band is same for each gene of interest because same sample/cDNA was used for PCR amplification of eGFP, CD8a, and CD28. ( B ) Protein expression by flow cytometry (contour plot) demonstrating surface protein expression of CD3z, CD8a, and CD28 co-localized with eGFP expression in CD19 CAR plasmid transfected HEK293T cells (CD19 CAR) and non-transfected cells (WT-control). Bar graph is representation of the three replicates. p -value (*** p < 0.001). This is a representation of cellular CD3z, CD8a, and CD28 expression.
- Conjugate
- Biotin

- Submitted by
- Invitrogen Antibodies (provider)
- Main image
- Experimental details
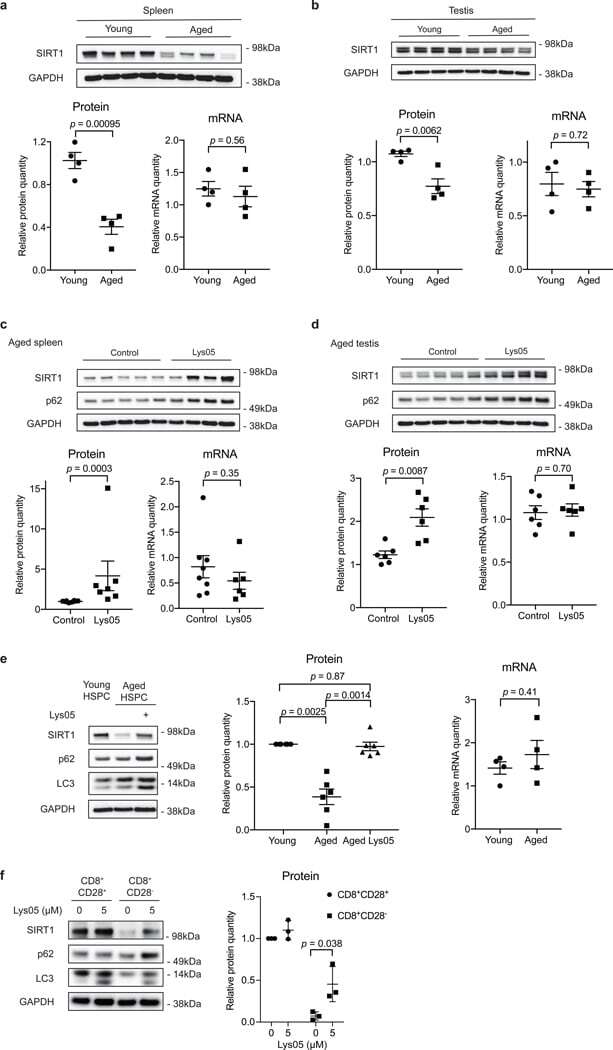
- Figure 5. SIRT1 undergoes lysosomal degradation during aging in mouse and human. a,b, Spleens ( a ) and testes ( b ) from young (2-4 months) and aged (19-26 months) C57BL/6 mice were analyzed by western blotting and RT-qPCR. Data are mean +- s.e.m. ; unpaired two-tailed Students' t-test; n = 4 animals. c,d, Spleens ( c ) and testes ( d ) were analyzed by western blotting and RT-qPCR for SIRT1 expression, from aged (19-24 months) mice subjected to daily i.p. injection of 10 mg/kg Lys05 in PBS or PBS control in 100 muL volume for two weeks. Data are mean +- s.e.m. ; two-tailed Mann-Whitney test. For spleen protein, control group n = 8 animals, Lys05 group n = 7 animals; RNA, control group n = 8 animals, Lys05 group n = 6 animals. For testis protein and RNA, control group n=6 animals, Lys05 group n=6 animals. e. HSPC populations were isolated from young (2-4 months) and aged (20-26 months) C57BL/6 mice, cultured with or without 2 muM Lys05 for 24 hours and analyzed by western blotting and RT-qPCR. For protein, data are mean +- s.e.m. ; one-way ANOVA coupled with Tukey's test; n=6 independent experiments. For RNA, data are mean +- s.e.m. ; unpaired two-tailed Students' t-test; n=4 independent experiments. f. Freshly sorted CD8 + CD28 + (control) and CD8 + CD28 - T cells were treated with Lys05 at doses of 0 and 5 muM for 14 hours, and then were harvested and analyzed by western blotting. Donor age: 53, 54 and 66. Data are mean +- s.d. ; unpaired two-tailed Students' t-test; n = 3
- Conjugate
- Biotin
- Submitted by
- Invitrogen Antibodies (provider)
- Main image
- Experimental details
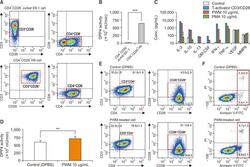
- Fig. 1 Characterization of CD26 expression, mDPP4 enzymatic activity, and cytokine expression in T helper cell lines. (A, B) Jurkat E6 and H9 Th1 cells were harvested and analyzed for the expression of T cell-specific surface markers, including CD3, CD4, and CD26 (A), and for their mDPP4 enzymatic activity (B). (C) H9 Th1 cells were treated with various T cell activators, including T-Activator CD3/CD28, PWM (10 ug/mL), and PMA (10 ug/mL) for 3 h. The expressions of 18 cytokines and 6 MMPs were measured in the culture supernatants of treated cells using two different panels of fluorescent multiplex bead assays. Activated T helper cell-specific cytokines, including IL-2, IL-10, IL-13, GM-CSF, IFN-gamma, and TNF-alpha, are shown. VEGF and MMP 9 are also included as detected high in all the samples. (D-F) H9 Th1 cells were treated with 10 ug/mL PWM for 12 h and subjected to mDPP4 enzymatic assays (D), FACS analysis for T helper cell-specific surface markers such as CD3, CD4, CD26, and CD28 (E), and analysis for apoptosis using an annexin V kit and flow cytometry (F). All analyses were repeated in three independent batches, and the data are shown as the means and standard deviation. ** p
- Conjugate
- Biotin

- Submitted by
- Invitrogen Antibodies (provider)
- Main image
- Experimental details
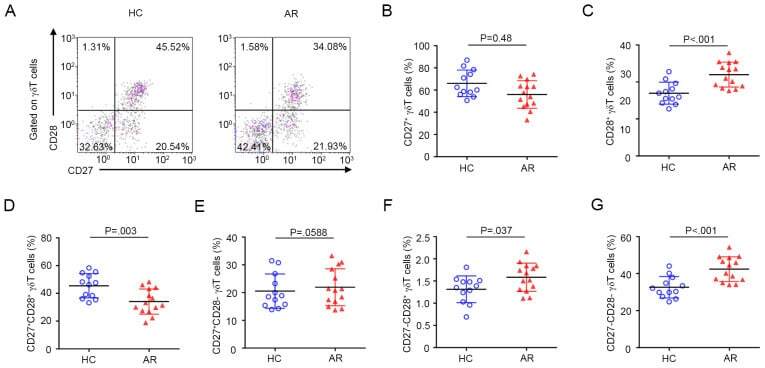
- Figure 3 Expression pattern of CD27 and CD28 on gammadelta T cells in AR. (A) Representative flow cytometry plots of the expression of CD27 and CD28 on gammadelta T cells among PBMCs from HC (n=12) and AR (n=14) subjects. (B-G) Quantification of the percentage of (B) CD27+, (C) CD28+, (D) CD27 + CD28 + , (E) CD27 + CD28 - , (F) CD27 - CD28 + and (G) CD27 - CD28 - gammadelta + T cells in PBMCs. Values are expressed as the mean +- standard deviation. AR, allergic rhinitis; HC, healthy controls; PBMCs, peripheral blood mononuclear cells.
- Conjugate
- Biotin
- Submitted by
- Invitrogen Antibodies (provider)
- Main image
- Experimental details
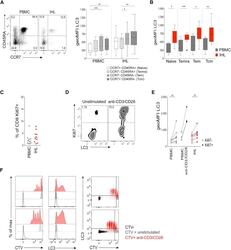
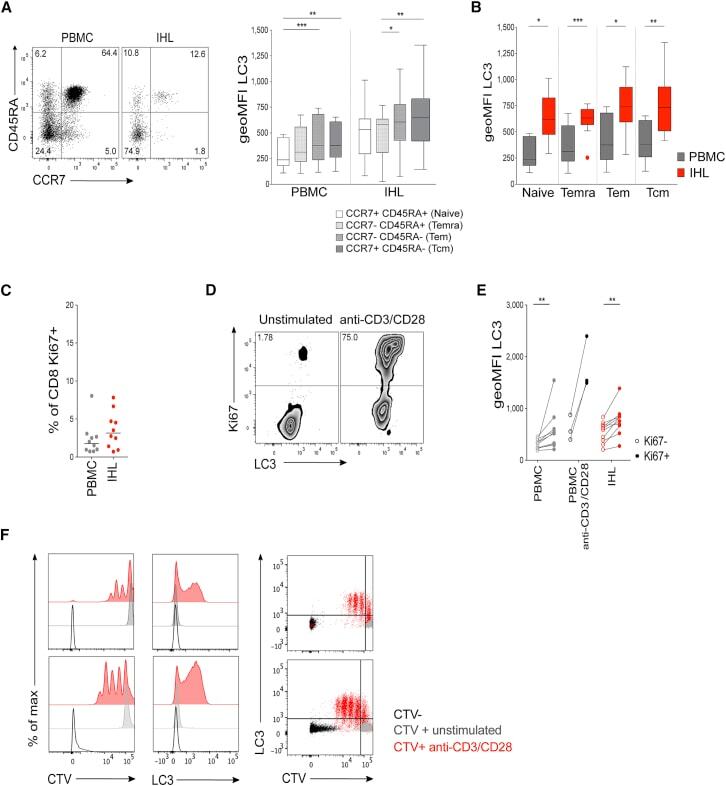
- Figure 2 High Autophagy Level of Intrahepatic T Cells Is Not a Result of a Difference in Differentiation Status or Recent Proliferation (A) Example plot of CD45RA versus CCR7 staining (CD8 + T cells) from a PBMC or IHL sample and summary data for LC3 staining of CD8 + T cell memory subsets (PBMC, 9; and IHL, 15, biological replicates; box whisker, Tukey). (B) Comparison of LC3 staining of CD8 + T cell memory subsets between paired PBMC and IHL samples (9 biological replicates; box whisker, Tukey; outliers shown as dots). (C) Ex vivo CD8 + T cell Ki67 expression. (D and E) Example plots (CD8 + T cells, PBMC) (D) and summary data for LC3 staining on Ki67 - and Ki67 + CD8 + T cells (E) in PBMCs and IHLs ex vivo (10 biological replicates) or after anti-CD3/CD28 stimulation (overnight, 0.5 mug/mL each; three biological replicates) in PBMCs. (F) Histograms showing the dilution of CellTrace Violet (CTV), LC3 staining, and co-staining of LC3 and CTV on CD8 + T cells after 5 days of stimulation with anti-CD3/CD28 (red), compared with that without stimulation (gray) or without CTV staining (black; two representative biological replicates of five, PBMCs). Cells were treated with bafA1 (A-F). Friedman test (ANOVA) with Dunn's post hoc test for pairwise multiple comparisons (A and B). Mann-Whitney t test (C and E). * p < 0.05, ** p < 0.005, *** p < 0.001.
- Conjugate
- Biotin
- Submitted by
- Invitrogen Antibodies (provider)
- Main image

- Experimental details
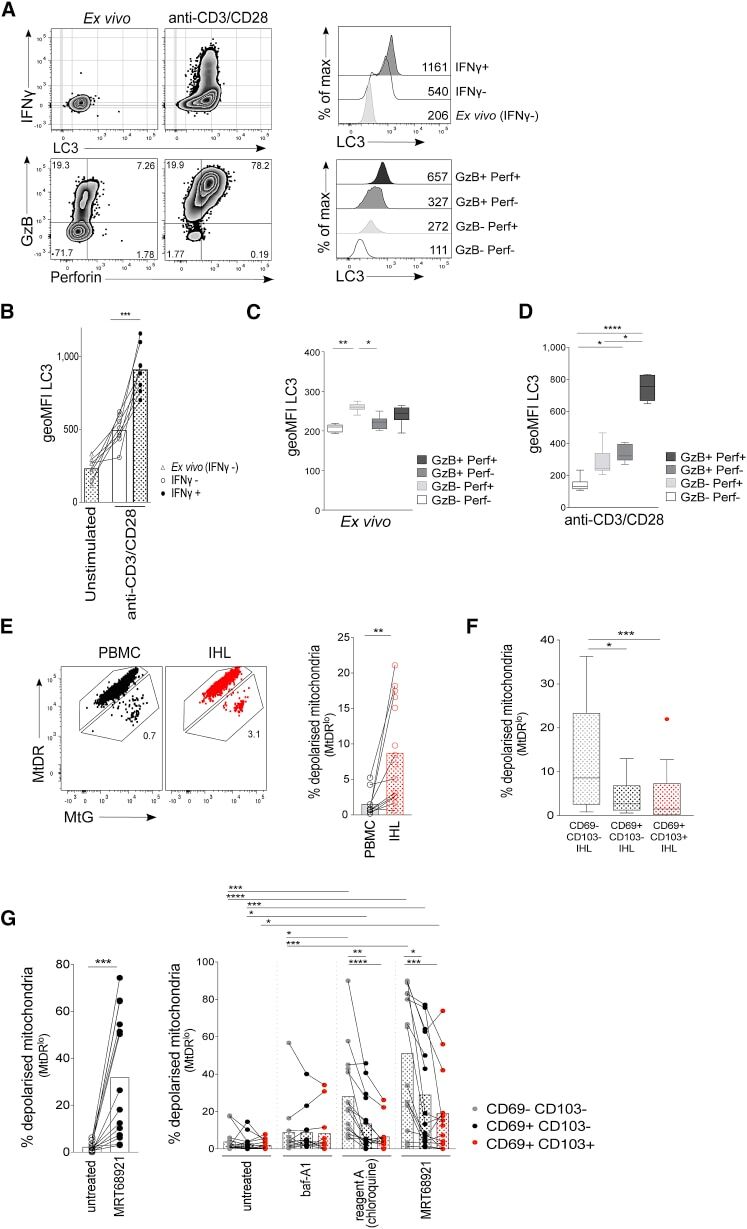
- Figure 4 Enhanced Autophagy Levels Are Linked to Effector Function and Mitochondrial Fitness in Human T Cells (A) Example plots of IFN-gamma, LC3, granzyme B (GzB), and perforin (perf; gated on CD8 + T cells) and histograms of LC3 staining for PBMC ex vivo or after anti-CD3/CD28 stimulation (3 days; see also Figure S3 ). (B) LC3 staining of CD8 + T cells from unstimulated PBMCs (IFN-gamma - ), IFN-gamma - and IFN-gamma + CD8 + T cells after anti-CD3/CD28 stimulation (3 days; eight biological replicates). (C and D) LC3 staining on GzB and perf-expressing CD8 + T cells ex vivo (C) and after anti-CD3/CD28 stimulation (D) (3 days; eight biological replicates; box whisker, Tukey). (E) Example mitochondrial staining of CD8 + T cells in blood (PBMCs; black) and liver (IHLs; red) and summary data for the ex vivo percentage of total CD8 + T cells with depolarized mitochondria (mitoTracker deep red [MtDR] lo ; see also Figure S4 ; PBMCs, 10; and IHLs, 15 biological replicates). (F) Ex vivo percentage of CD8 + T RM cell subsets in the liver with depolarized mitochondria (14 biological replicates; box whisker, Tukey; outliers shown as dots). (G) The percentage of total CD8 + T cells or CD8 + T RM cell subsets with depolarized mitochondria after overnight culture of IHLs with DMSO (untreated), MRT68921 dihydrochloride (10 muM), bafA1 (0.1 muM), or reagent A (chloroquine diphosphate, 1:1000, FlowCellect LC3 kit; 13-15 biological replicates). Cells were treated with bafA1 (A-D). Bars at mea
- Conjugate
- Biotin
- Submitted by
- Invitrogen Antibodies (provider)
- Main image
- Experimental details
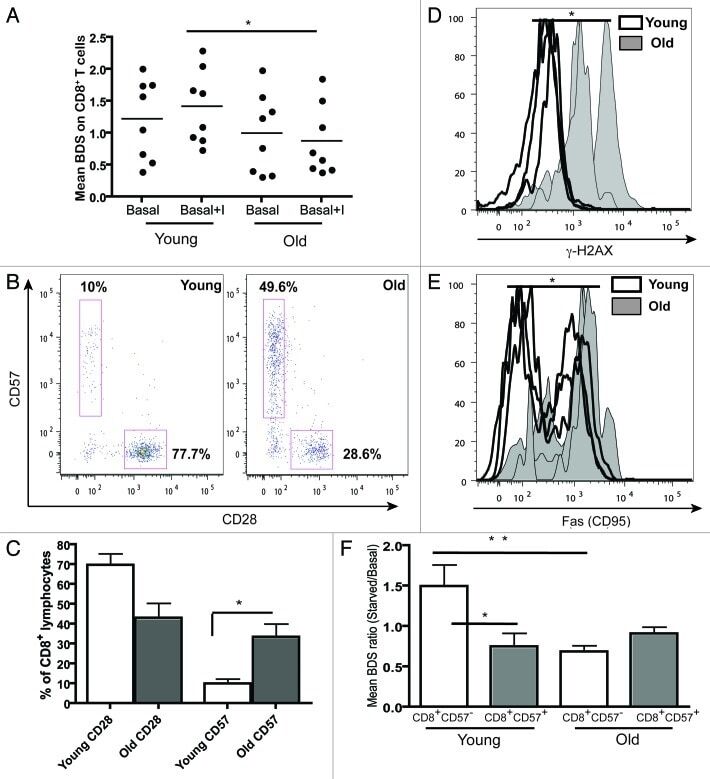
- Figure 5. Aging and replicative senescence markers in human T lymphocytes. PBMCs from healthy young (< 28 y) and old (> 56 y) donors were stained for CD28 and CD57 and run on LSR II flow cytometer. (A) Autophagy levels (Mean BDS) in CD8 + T cells from young (< 28 y, n = 8) and old (> 56 y, n = 8) donors under basal and basal+I (for 2 h) conditions (mean +- SEM, *p < 0.0499 between young and old basal+I). (B) Representative dot plots from a young and an old donor showing percentages of CD28 and CD57 cells gated on CD8 + T cells. (C) Bar graph showing % of CD8 + lymphocytes with CD28 and CD57 markers in four young and old donors (mean +- SEM, p = 0.0571 for CD8 CD28 population and *p = 0.0286 for CD8 CD57 population). (D) Overlaid histogram of gammaH2AX (DNA double-strand break) levels of CD8 + lymphocytes from three young and old donors gated on CD28 + CD57 - population (geometric mean +- SEM, *p = 0.0286). (E) Overlaid histogram of FAS (CD95) levels of CD8 + lymphocytes from four young and old donors gated on CD28 + CD57 - population (geometric mean +- SEM, *p = 0.0286). PBMCs from four healthy young and old donors were cultured under control and starved conditions for 2 h and stained for CD8, CD57, LC3 and Lyso-ID. (F) Colocalization of LC3 and lysosomal marker in CD8 + CD57 +/- cells, expressed as mean BDS ratio between starved and basal treatments (mean +- SEM, n = 5 (young donors), n = 8 (old donors), **p = 0.0049, *p = 0.035).
- Conjugate
- Biotin
- Submitted by
- Invitrogen Antibodies (provider)
- Main image

- Experimental details
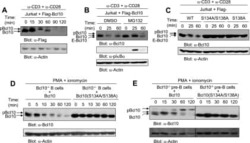
- Fig. 5 Bim is required for AICD progression in normal and T-ALL cells. a Expression levels of the indicated proteins in naive hPBT stimulated once, for 3 h (I stim), or twice (II stim) with anti-CD3 (plate-coated) and anti-CD28 antibodies. For the second stimulation, cells have been pre-activated with anti-CD3 (plate-coated) and anti-CD28 antibodies for 48 h and expanded for 6 days in IL2-containing medium. The quantification of the ratio between Bim-L/S protein isoforms and Bcl2 protein is reported for each condition in the graph on the right ( n = 3). b-f AICD has been induced in Jurkat cells silenced for Bim (checked by western blot in B, n = 3). Relative viability (AICD:unstimulated ratio) at 30 h upon AICD induction is indicated in C ( n = 6), western blot analysis of the Opa1 oligomers at 30 h in d ( n = 6; relative quantification on the right), TMRE staining at 26 h by flow cytometry in e ( n = 3; relative quantification on the right), and immunofluorescence analysis of mitochondria morphology (TOM20) and cyt-C localization at 30 h, in single confocal plane, in f ( n = 3; relative quantifications of percentage of cells with fragmented mitochondria, or released cyt-C, on the right). g Expression levels of the indicated genes from T-ALL and healthy bone marrows (HBM) obtained from Leukemia MILE Dataset and analyzed through BloodSpot (HBM: n = 73; T-ALL: n = 174). h Western blot analysis of Bim levels in healthy human Teff cells (stimulated once, and expanded 6 days with
- Conjugate
- Biotin

- Submitted by
- Invitrogen Antibodies (provider)
- Main image

- Experimental details
- Fig. 1 Flotillins mediate sorting of internalised TCRzeta into Rab5 and Rab11a endosomes. a Schematic depicting photoactivation to investigate sorting. Top: sorting of photoactivated endosomes (red) into the Rab compartment (green, yellow = merged), bottom: photoactivated endosomes not sorting into the Rab compartment. Dashed lines: quantified compartment mask. b Representative images of photoactivated (dashed region) TCRzeta-PAmCherry sorting into EGFP-Rab4 in WT (left) and FlotKO (right) Jurkat T cells. Cells photoactivated for five frames with 2.5 s intervals, then imaged every 2.5 s for 150 frames. c % endosomal TCRzeta-PAmCherry intensity in Rab4 in WT or FlotKO cells. Dashed line represents timepoint where TCRzeta-PAmCherry intensity significantly diverges between WT and FlotKO. d Percentage reduction in endosomal TCRzeta-PAmCherry intensity in Rab4 from the 50 to 55 s timepoint. Fitted linear regression line is bolded. n.s. indicates slopes are not significantly different. e Representative images of photoactivated (dashed regions) TCRzeta-PAmCherry sorting into EGFP-Rab5 in WT (left) and FlotKO (right) cells. Cells imaged as in b . f Percentage endosomal TCRzeta-PAmCherry in Rab5 in WT or FlotKO cells over time. g Percentage reduction in endosomal TCRzeta-PAmCherry intensity in Rab5 from 50 to 55 s. Fitted linear regression line is bolded. ***Indicates slopes are highly significantly different. h Representative images of photoactivated (dashed region) TCRzeta-PAmCherry
- Conjugate
- Biotin

- Submitted by
- Invitrogen Antibodies (provider)
- Main image

- Experimental details
- Fig. 2 TCRzeta recycles from an intracellular compartment labelled by flotillins and Rab11a. a Schematic depicting two-photon photoactivation to measure recycling from intracellular compartments. b Representative confocal images of TCRzeta-PSCFP2 photoactivated with 800 nm light from a two-photon laser, 2.5 um within the cell at the cell centre-localised TCRzeta-mCherry compartment displaying recycling to the plasma membrane over time. Dashed circle = photoactivation region. c % increase in photoactivated TCRzeta-PSCFP2 signal over time at the plasma membrane when activated from cell centre compartments labelled by TCRzeta-mCherry in WT or FlotKO Jurkat T cells or cytoplasmic photoactivation. Greyed region = time of photoactivation. d Mean TCRzeta-PSCFP2 signal from 900 to 1200 s timepoints when photoactivated from the indicated compartments. e Mean intenisty of photoactivated TCRzeta-PSCFP2 2 um within the cell from TCRzeta-mCherry in WT or FlotKO cells. Greyed region = time of photoactivation. f % increase in photoactivated TCRzeta-PSCFP2 signal over time at the plasma membrane when activated from cell centre compartments labelled by mCherry-Rab11a, flotillin1/2-mCherry or TCRzeta-mCherry in WT Jurkat T cells. Grey box = time of photoactivation. Greyed region = time of photoactivation. g Mean TCRzeta-PSCFP2 signal from 900 to 1200 s timepoints when photoactivated from the indicated intracellular compartments. h Percentage of photoactivated TCRzeta-PSCFP2 vesicles within 320
- Conjugate
- Biotin

- Submitted by
- Invitrogen Antibodies (provider)
- Main image

- Experimental details
- Fig. 3 Flotillins regulate TCRzeta sorting into Rab11a vesicles for fusion with the plasma membrane. a Representative images of a TCRzeta-GFP vesicle fusion event. Zoomed images below represent the indicated fusion event (white box) at 200 ms intervals. Main image scale bar = 5 um, inset scale bar = 1 um. b TCRzeta-GFP vesicle fusion events per minute in WT and two FlotKO Jurkat T cell lines. c Representative images of TCRzeta-GFP (cyan) vesicle fusion events with either flotillin-1 and flotillin-2 mCherry (magenta, top two panels) or mCherry-Rab11a (magenta, bottom panel). Scale bar = 0.5 um. d Percentage of TCRzeta-GFP fusion events containing either flotillin1/2-mCherry or mCherry-Rab11a. e Representative images displaying a GFP-Rab11a vesicle fusion event. Zoomed images below represent the indicated fusion event (white box) at 200 ms intervals. Main image scale bar = 5 um, inset scale bar = 1 um. f GFP-Rab11a vesicle fusion events per minute in WT and two FlotKO Jurkat T cell lines. g Representative images of TCRzeta-GFP (cyan) vesicle fusion events with mCherry-Rab11a (magenta) in WT Jurkat T cells (top) or fusion with (middle) or without (bottom) mCherry-Rab11a in FlotKO Jurkat T cells. Scale bar = 0.5 um. h Percentage of TCRzeta-GFP fusion events containing mCherry-Rab11a in WT and two FlotKO Jurkat T cell lines. All images captured on a Zeiss ELYRA TIRF microscope. Data points indicate means of independent experiments, error bars indicate mean +- SEM. n.s. = not signi
- Conjugate
- Biotin

- Submitted by
- Invitrogen Antibodies (provider)
- Main image

- Experimental details
- Fig. 4 Flotillins rapidly interact with and maintain the organisation of Rab5 and Rab11a-positive endosomes. a Representative images of flotillin-2-PAmCherry photoactivated at the dashed region failing to interact with EGFP-Rab4 endosomes in WT Jurkat T cells. Cells were photoactivated for five frames with 2.5 s intervals, then imaged every 2.5 s for 60 frames. b Representative images of flotillin-2-PAmCherry photoactivated at the dashed region rapidly interacting with EGFP-Rab5 endosomes in WT Jurkat T cells. Cells were photoactivated and imaged as in a . c Representative images of flotillin-2-PAmCherry photoactivated at the dashed region rapidly interacting with EGFP-Rab11 endosomes in WT Jurkat T cells. Cells were photoactivated and imaged as in a . For a - c zoomed images below are indicated by a white box, main image scale bar = 5 um, inset scale bar = 1 um, and flotillin-2-PAmCherry was co-expressed with untagged flotillin-1. All cells imaged on a Zeiss 880 confocal, photoactivation performed at 405 nm. d Quantification of the percentage of photoactivated flotillin-2-PAmCherry present in Rab4, 5 or 11a. e Representative confocal images of endogenous Rab4, Rab5 and Rab11a detected with corresponding antibodies in WT (top) or FlotKO (bottom) Jurkat T cells. Scale bar = 5 um. f Mean fluorescence dispersion of the indicated markers. Data points indicate mean dispersion from n = 3 biologically independent experiments (Fig. 4a-d, Rab4: 10; 8; 5 cells, Rab5: 10; 12; 10 cells,
- Conjugate
- Biotin

- Submitted by
- Invitrogen Antibodies (provider)
- Main image

- Experimental details
- Figure 2 Metformin Ameliorates OXPHOS and Promotes Non-mitochondrial Glycolysis in CD4 + T Cells from O Subjects (A) OCR in a mito stress test assayed by XF of CD4 + T cells following 40 h alphaCD3/alphaCD28 stimulation +- 100 mum MET as indicated. (B) OCR:ECAR ratio calculated by profiles in (A) and Figure S2 C. (C) Relative lactate production after 40-h stimulation per (A). (D) Proton leak calculated from (A) data. (E) MMP measured with TMRE after stimulation per (A). #p = 0.055 versus O. (F) MMP measured following addition of the mitochondrial uncoupler fluoro-carbonyl cyanide phenylhydrazone (FCCP) to unstimulated CD4 + T cells from Y or O subjects. n = 8-10 (A-E) and 12-13 (F). (G) LDH quantification on western blots. Top: representative blot and bottom averages n = 4-6 of group indicated beneath. * p < 0.05 versus Y, #p < 0.05 versus O. Data shown are mean +- SEM. (H) VIP scores, which rank cytokines as most (leftmost) or least (rightmost) important for differentiating overall cytokine profiles between CD4 + T cells from young subjects stimulated +- the LDH inhibitor OA in an orthagonalized model. A VIP score >1 (bracket) is considered important for differentiating inflammatory profiles between groups. All VIP cytokines indicated also differed in post hoc analyses (p < 0.05). Fold change is compared to Y or Y + FCCP. See also Figure S2 .
- Conjugate
- Biotin

- Submitted by
- Invitrogen Antibodies (provider)
- Main image

- Experimental details
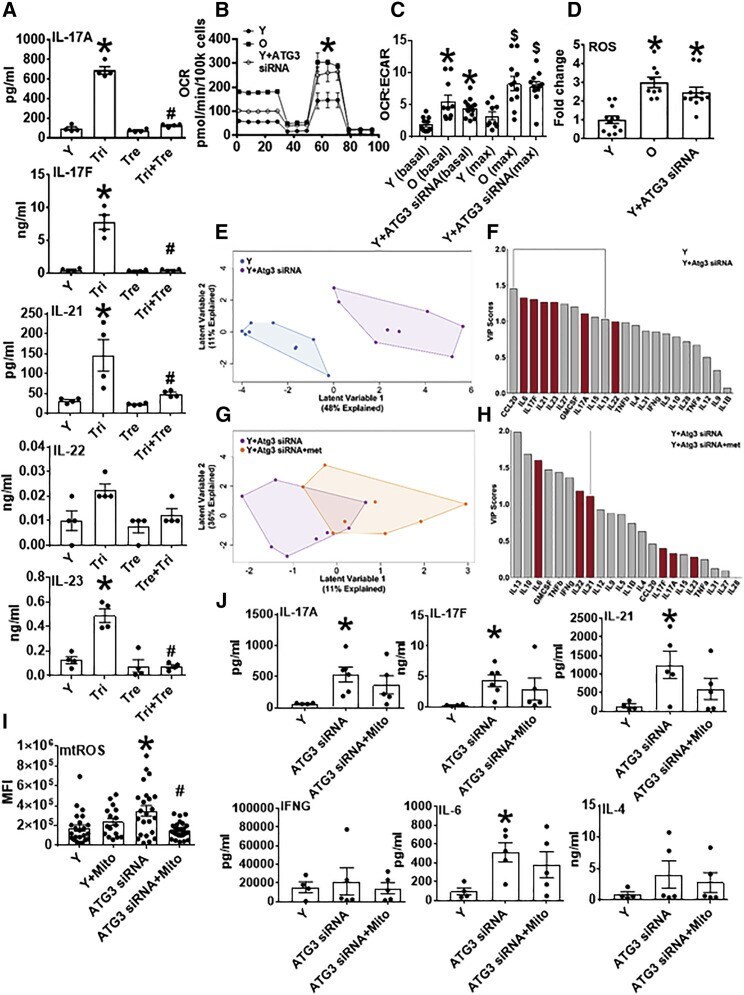
- Figure 5 Genetic Inhibition of Autophagy Recapitulates Respiratory Profiles of Cells from O Subjects (A) Th17-associated cytokine production by CD4 + T cells from Y subjects, with cells stimulated 40 h alphaCD3/alphaCD28 in the presence of trimetazidine, a fatty acid oxidation inhibitor; alone; or in combination with trehalose, an autophagy activator. n = 4. * p < 0.05 versus Y by one-way ANOVA. (B) Mito stress test XF profiles from 40 h alphaCD3/alphaCD28-stimulated CD4 + T cells from Y or O subjects as indicated. Autophagy dysfunction was induced in cells from Y subjects using siRNA-mediated ATG3 knockdown. n = 8-12. (C and D) OCR:ECAR ratio (C) and ROS generation (D) measured by DCFDA in CD4 + T cells manipulated as indicated. n = 8-12. * p < 0.05 versus Y by SHORE ( Nicholas et al., 2017 ) (B) or one-way ANOVA (C and D). * p < 0.05 versus Y (basal), $p < 0.05 versus Y (max) (C). (E and G) PLSDA analysis differentiated combinatorial ""inflammation"" of CD4 + cells from Y subjects (blue), Y with siRNA-induced autophagy dysfunction (purple), or autophagy dysfunction and metformin (met; orange). n = 8-9. (F and H) VIP scores rank cytokines important for differentiating data clouds in (E) and (G). Comparison of Figure 5 F with 1D highlights profiles that differentiate Y from either O or Y + ATG3 siRNA conditions. n = 8-9. (I) Mitochondrial ROS generation measured by MitoSOX in CD4 + T cells manipulated as indicated; 3 cells/field and 4 fields/slide were imaged using 40x in Zei
- Conjugate
- Biotin
- Submitted by
- Invitrogen Antibodies (provider)
- Main image

- Experimental details
- Figure 6 Aging Promotes STAT3 Activation, Mitochondrial Localization, and IL17A/F Promoter Binding (A and B) Quantification of STAT3 ser727 and the mitochondrial complex 1 subunit NDUFA13 localization in CD4 + T cells stimulated for 40 h with alphaCD3/alphaCD28 +- metformin as indicated. n = 4 with multiple field readings shown per N. (C) Phospho (p)-STAT3 T705 expression assayed on western blots as indicated on x axis. n = 6-8. (D) p-STAT3 T705 expression relative to total STAT3 in O cells in the presence of TEMP or MET. n = 4-5. * p < 0.05 versus Y or control siRNA or #p < 0.05 versus O. Fold change is compared with Y or O. (A and D) 3 cells/field and 3-5 fields/slide were imaged using 63x oil immersion in Zeiss microscope. Average fluorescence/field is reported. (E) Chromatin immunoprecipitation assay showing fold-enrichment of p-STAT3 705 on (left) IL-17A or (right) IL-17F promoters. n = 4. All bar graphs show mean +- SEM. (F) Model for parallel metformin-sensitive pathways that drive T cell inflammaging. Activated T cells from O subjects displayed blunted autophagy, which was largely independent of changes in mitochondrial bioenergetics/excess ROS that promote STAT3-mediated activation of a CD4 + T cell inflammaging profile.
- Conjugate
- Biotin
