Explore
 Validate
 Learn
LearnMA3-026
antibody from Invitrogen Antibodies
Targeting: TCP1
CCT1, Ccta, D6S230E
 Western blot
 Immunocytochemistry Immunoprecipitation Immunohistochemistry Flow cytometry Other assay
Antibody data
- Antibody Data
- Antigen structure
- References [6]
- Comments [0]
- Validations
- Immunocytochemistry [5]
- Immunohistochemistry [2]
- Other assay [1]
Submit
Validation data
Reference
Comment
Report error
- Product number
- MA3-026 - Provider product page

- Provider
- Invitrogen Antibodies
- Product name
- TCP1 Monoclonal Antibody (91A)
- Antibody type
- Monoclonal
- Antigen
- Other
- Description
- MA3-026 detects T Complex Polypeptide 1 (TCP-1) from human, canine, chicken, hamster, mouse, primate, rat and yeast samples. MA3-026 has been successfully used in Western blot, immunofluorescence and immunoprecipitation procedures. By Western blot, this clone detects a ~57 kDa band representing TCP-1 in mouse 3T3 cells. Immunofluorescence staining of TCP-1 in mouse germ line cells with MA3-026 results in diffuse cytoplasmic staining. The MA3-026 immunizing peptide corresponds to amino acid residues 306-556 from mouse TCP-1. The epitope for this antibody has been mapped to amino acids 465-469 representing the pentamer peptide AKLRA.
- Reactivity
- Human, Mouse, Rat, Canine, Chicken/Avian, Hamster, Yeast
- Host
- Rat
- Isotype
- IgG
- Antibody clone number
- 91A
- Vial size
- 100 μL
- Concentration
- Conc. Not Determined
- Storage
- -20°C, Avoid Freeze/Thaw Cycles
Submitted references β-catenin links cell seeding density to global gene expression during mouse embryonic stem cell differentiation.
Direct control of lysosomal catabolic activity by mTORC1 through regulation of V-ATPase assembly.
Differential HDAC1/2 network analysis reveals a role for prefoldin/CCT in HDAC1/2 complex assembly.
Identification of six Tcp-1-related genes encoding divergent subunits of the TCP-1-containing chaperonin.
Identification of six Tcp-1-related genes encoding divergent subunits of the TCP-1-containing chaperonin.
The t complex polypeptide 1 (TCP-1) is associated with the cytoplasmic aspect of Golgi membranes.
LeBlanc L, Kim M, Kambhampati A, Son AJ, Ramirez N, Kim J
iScience 2022 Jan 21;25(1):103541
iScience 2022 Jan 21;25(1):103541
Direct control of lysosomal catabolic activity by mTORC1 through regulation of V-ATPase assembly.
Ratto E, Chowdhury SR, Siefert NS, Schneider M, Wittmann M, Helm D, Palm W
Nature communications 2022 Aug 17;13(1):4848
Nature communications 2022 Aug 17;13(1):4848
Differential HDAC1/2 network analysis reveals a role for prefoldin/CCT in HDAC1/2 complex assembly.
Banks CAS, Miah S, Adams MK, Eubanks CG, Thornton JL, Florens L, Washburn MP
Scientific reports 2018 Sep 12;8(1):13712
Scientific reports 2018 Sep 12;8(1):13712
Identification of six Tcp-1-related genes encoding divergent subunits of the TCP-1-containing chaperonin.
Kubota H, Hynes G, Carne A, Ashworth A, Willison K
Current biology : CB 1994 Feb 1;4(2):89-99
Current biology : CB 1994 Feb 1;4(2):89-99
Identification of six Tcp-1-related genes encoding divergent subunits of the TCP-1-containing chaperonin.
Kubota H, Hynes G, Carne A, Ashworth A, Willison K
Current biology : CB 1994 Feb 1;4(2):89-99
Current biology : CB 1994 Feb 1;4(2):89-99
The t complex polypeptide 1 (TCP-1) is associated with the cytoplasmic aspect of Golgi membranes.
Willison K, Lewis V, Zuckerman KS, Cordell J, Dean C, Miller K, Lyon MF, Marsh M
Cell 1989 May 19;57(4):621-32
Cell 1989 May 19;57(4):621-32
No comments: Submit comment
Supportive validation
- Submitted by
- Invitrogen Antibodies (provider)
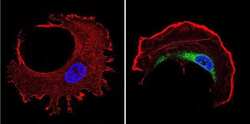
- Main image
- Experimental details
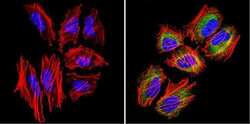
- Immunofluorescent analysis of TCP1 (green) in Hela cells. Formalin-fixed cells were permeabilized with 0.1% Triton X-100 in TBS for 5-10 minutes at room temperature and blocked with 3% BSA-PBS for 30 minutes at room temperature. Cells were probed with a TCP1 Monclonal Antibody (91A) (Product # MA3-026) at a dilution of 1:100 and incubated overnight in a humidified chamber. Cells were washed with PBST and incubated with a DyLight-conjugated secondary antibody for 45 minutes at room temperature in the dark. F-actin (red) was stained with a fluorescent phalloidin and nuclei (blue) were stained with DAPI. Images were taken at a 60X magnification.
- Submitted by
- Invitrogen Antibodies (provider)
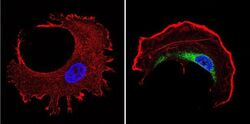
- Main image
- Experimental details
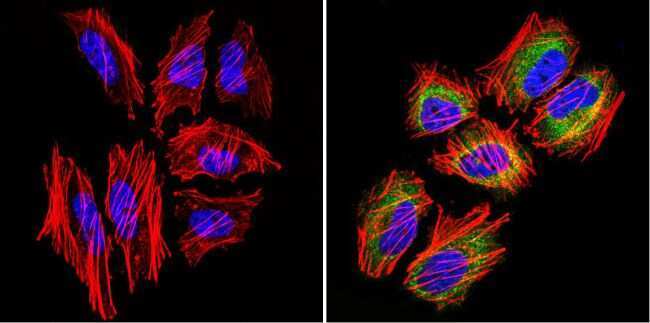
- Immunofluorescent analysis of TCP1 (green) in murine cells. Formalin-fixed cells were permeabilized with 0.1% Triton X-100 in TBS for 5-10 minutes at room temperature and blocked with 3% BSA-PBS for 30 minutes at room temperature. Cells were probed with a TCP1 Monclonal Antibody (91A) (Product # MA3-026) at a dilution of 1:100 and incubated overnight in a humidified chamber. Cells were washed with PBST and incubated with a DyLight-conjugated secondary antibody for 45 minutes at room temperature in the dark. F-actin (red) was stained with a fluorescent phalloidin and nuclei (blue) were stained with DAPI. Images were taken at a 60X magnification.

- Submitted by
- Invitrogen Antibodies (provider)
- Main image
- Experimental details
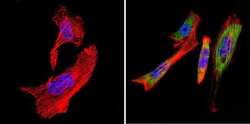
- Immunofluorescent analysis of TCP1 (green) in human cells. Formalin-fixed cells were permeabilized with 0.1% Triton X-100 in TBS for 5-10 minutes at room temperature and blocked with 3% BSA-PBS for 30 minutes at room temperature. Cells were probed with a TCP1 Monclonal Antibody (91A) (Product # MA3-026) at a dilution of 1:100 and incubated overnight in a humidified chamber. Cells were washed with PBST and incubated with a DyLight-conjugated secondary antibody for 45 minutes at room temperature in the dark. F-actin (red) was stained with a fluorescent phalloidin and nuclei (blue) were stained with DAPI. Images were taken at a 60X magnification.

- Submitted by
- Invitrogen Antibodies (provider)
- Main image

- Experimental details
- Immunofluorescent analysis of TCP1 (green) in murine cells. Formalin-fixed cells were permeabilized with 0.1% Triton X-100 in TBS for 5-10 minutes at room temperature and blocked with 3% BSA-PBS for 30 minutes at room temperature. Cells were probed with a TCP1 Monclonal Antibody (91A) (Product # MA3-026) at a dilution of 1:100 and incubated overnight in a humidified chamber. Cells were washed with PBST and incubated with a DyLight-conjugated secondary antibody for 45 minutes at room temperature in the dark. F-actin (red) was stained with a fluorescent phalloidin and nuclei (blue) were stained with DAPI. Images were taken at a 60X magnification.

- Submitted by
- Invitrogen Antibodies (provider)
- Main image
- Experimental details
- Immunofluorescent analysis of TCP1 (green) in human cells. Formalin-fixed cells were permeabilized with 0.1% Triton X-100 in TBS for 5-10 minutes at room temperature and blocked with 3% BSA-PBS for 30 minutes at room temperature. Cells were probed with a TCP1 Monclonal Antibody (91A) (Product # MA3-026) at a dilution of 1:100 and incubated overnight in a humidified chamber. Cells were washed with PBST and incubated with a DyLight-conjugated secondary antibody for 45 minutes at room temperature in the dark. F-actin (red) was stained with a fluorescent phalloidin and nuclei (blue) were stained with DAPI. Images were taken at a 60X magnification.

Supportive validation
- Submitted by
- Invitrogen Antibodies (provider)
- Main image
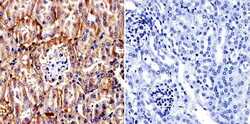
- Experimental details
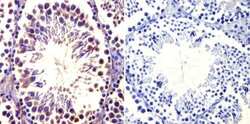
- Immunohistochemistry was performed on normal biopsies of deparaffinized mouse kidney tissue. To expose target proteins, heat induced antigen retrieval was performed using 10mM sodium citrate (pH6.0) buffer, microwaved for 8-15 minutes. Following antigen retrieval tissues were blocked in 3% BSA-PBS for 30 minutes at room temperature. Tissues were then probed at a dilution of 1:20 with a Rat Monoclonal Antibody recognizing TCP1 (Product # MA3-026) or without primary antibody (negative control) overnight at 4°C in a humidified chamber. Tissues were washed extensively with PBST and endogenous peroxidase activity was quenched with a peroxidase suppressor. Detection was performed using a biotin-conjugated secondary antibody and SA-HRP, followed by colorimetric detection using DAB. Tissues were counterstained with hematoxylin and prepped for mounting.
- Submitted by
- Invitrogen Antibodies (provider)
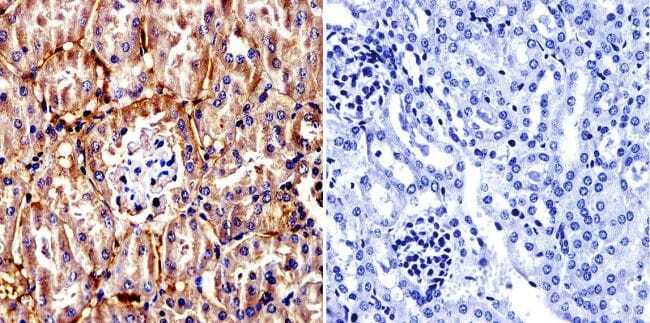
- Main image
- Experimental details
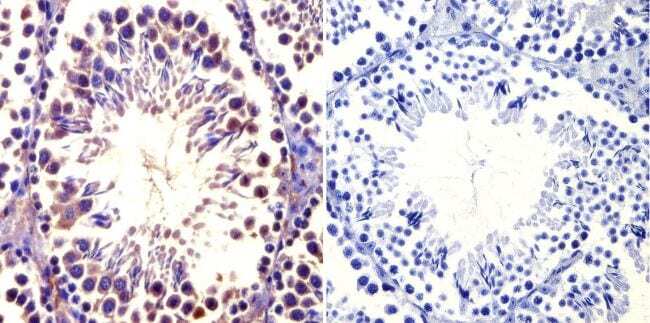
- Immunohistochemistry was performed on normal biopsies of deparaffinized mouse testis tissue. To expose target proteins, heat induced antigen retrieval was performed using 10mM sodium citrate (pH6.0) buffer, microwaved for 8-15 minutes. Following antigen retrieval tissues were blocked in 3% BSA-PBS for 30 minutes at room temperature. Tissues were then probed at a dilution of 1:20 with a Rat Monoclonal Antibody recognizing TCP1 (Product # MA3-026) or without primary antibody (negative control) overnight at 4°C in a humidified chamber. Tissues were washed extensively with PBST and endogenous peroxidase activity was quenched with a peroxidase suppressor. Detection was performed using a biotin-conjugated secondary antibody and SA-HRP, followed by colorimetric detection using DAB. Tissues were counterstained with hematoxylin and prepped for mounting.
Supportive validation
- Submitted by
- Invitrogen Antibodies (provider)
- Main image

- Experimental details
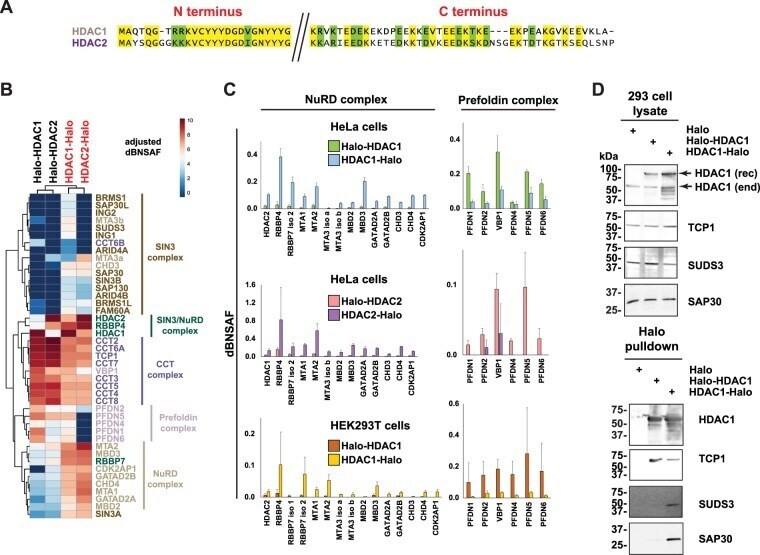
- Figure 3 HDAC2 (HeLa) or HDAC1 (HEK293T) associations with Sin3, NuRD, CCT and prefoldin complexes depends on affinity tag location. ( A ) Sequence alignment of the N and C termini of human HDAC1 (NP_004955) and human HDAC2 (NP_001518), using the AlignX tool in Vector NTI 64 . Identical residues are highlighted in yellow and similar residues in green. ( B ) Hierarchical clustering of Halo-tagged HDAC1 and HDAC2 associated complexes. Bait normalized dNSAF values (Supplementary Tables S3 and S4 ) were scaled 1000x prior to clustering using R. Values were further adjusted using a log 2 transformation for representation using the indicated colour scale. Dissimilarity matrix calculations were based on Euclidean distance. ( C ) Components of the NuRD or prefoldin complexes copurifying with tagged versions of either HDAC1 (HeLa cells), HDAC2 (HeLa cells) or with HDAC1 (HEK293T cells). Error bars indicate standard deviation. ( D ) Lysates from HEK293T cells transfected with constructs expressing either Halo tag alone, Halo-HDAC1 or HDAC1-Halo were processed as described in ""Methods"". Halo purified samples were analysed using SDS-PAGE and visualised by Western blotting using antibodies to the proteins indicated. Bands corresponding to recombinant Halo-tagged HDAC1 (HDAC1(rec)) or endogenous HDAC1 (HDAC1(end)) in the lysate samples are marked. Full length images of Western blots are presented in Supplementary Figure 2.