 Explore
 Validate
 Learn
Learn Western blot
 Immunohistochemistry
Antibody data
- Antibody Data
- Antigen structure
- References [3]
- Comments [0]
- Validations
- Immunohistochemistry [1]
- Other assay [4]
Submit
Validation data
Reference
Comment
Report error
- Product number
- PA5-42558 - Provider product page

- Provider
- Invitrogen Antibodies
- Product name
- M-CSF Polyclonal Antibody
- Antibody type
- Polyclonal
- Antigen
- Synthetic peptide
- Description
- Peptide sequence: SGSVLPLGEL EGRRSTRDRR SPAEPEGGPA SEGAARPLPR FNSVPLTDTG Sequence homology: Dog: 85%; Guinea Pig: 79%; Human: 100%; Mouse: 86%; Pig: 85%; Rat: 86%
- Reactivity
- Human
- Host
- Rabbit
- Isotype
- IgG
- Vial size
- 100 μL
- Concentration
- 0.5 mg/mL
- Storage
- -20°C, Avoid Freeze/Thaw Cycles
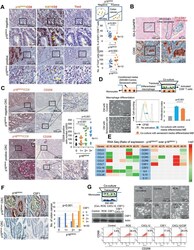
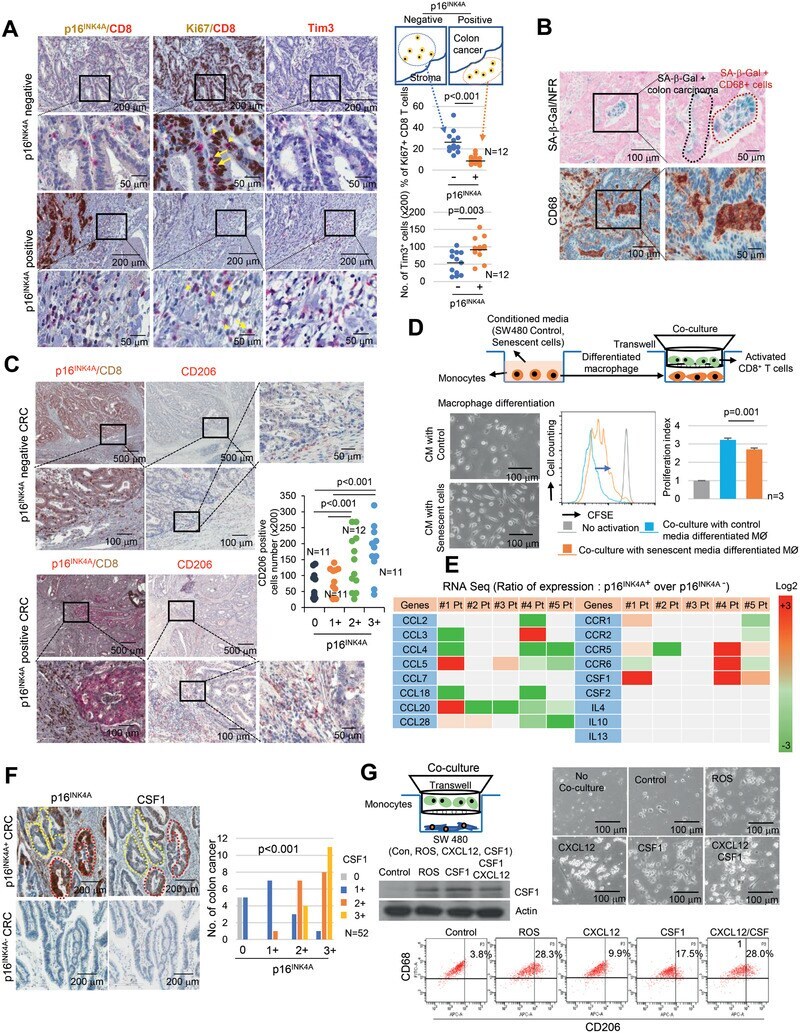
Submitted references Senescent Tumor Cells Build a Cytokine Shield in Colorectal Cancer.
Regulators of TNFα mediated insulin resistance elucidated by quantitative proteomics.
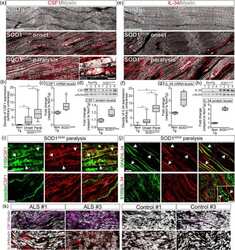
Schwann cells orchestrate peripheral nerve inflammation through the expression of CSF1, IL-34, and SCF in amyotrophic lateral sclerosis.
Choi YW, Kim YH, Oh SY, Suh KW, Kim YS, Lee GY, Yoon JE, Park SS, Lee YK, Park YJ, Kim HS, Park SH, Kim JH, Park TJ
Advanced science (Weinheim, Baden-Wurttemberg, Germany) 2021 Feb;8(4):2002497
Advanced science (Weinheim, Baden-Wurttemberg, Germany) 2021 Feb;8(4):2002497
Regulators of TNFα mediated insulin resistance elucidated by quantitative proteomics.
Mohallem R, Aryal UK
Scientific reports 2020 Nov 30;10(1):20878
Scientific reports 2020 Nov 30;10(1):20878
Schwann cells orchestrate peripheral nerve inflammation through the expression of CSF1, IL-34, and SCF in amyotrophic lateral sclerosis.
Trias E, Kovacs M, King PH, Si Y, Kwon Y, Varela V, Ibarburu S, Moura IC, Hermine O, Beckman JS, Barbeito L
Glia 2020 Jun;68(6):1165-1181
Glia 2020 Jun;68(6):1165-1181
No comments: Submit comment
Supportive validation
- Submitted by
- Invitrogen Antibodies (provider)
- Main image
- Experimental details
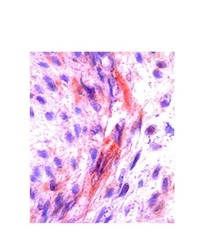
- Immunohistochemistry analysis of human placenta tissue using an anti-CSF1 polyclonal antibody (Product # PA5-42558).

Supportive validation
- Submitted by
- Invitrogen Antibodies (provider)
- Main image
- Experimental details
- NULL

- Submitted by
- Invitrogen Antibodies (provider)
- Main image
- Experimental details
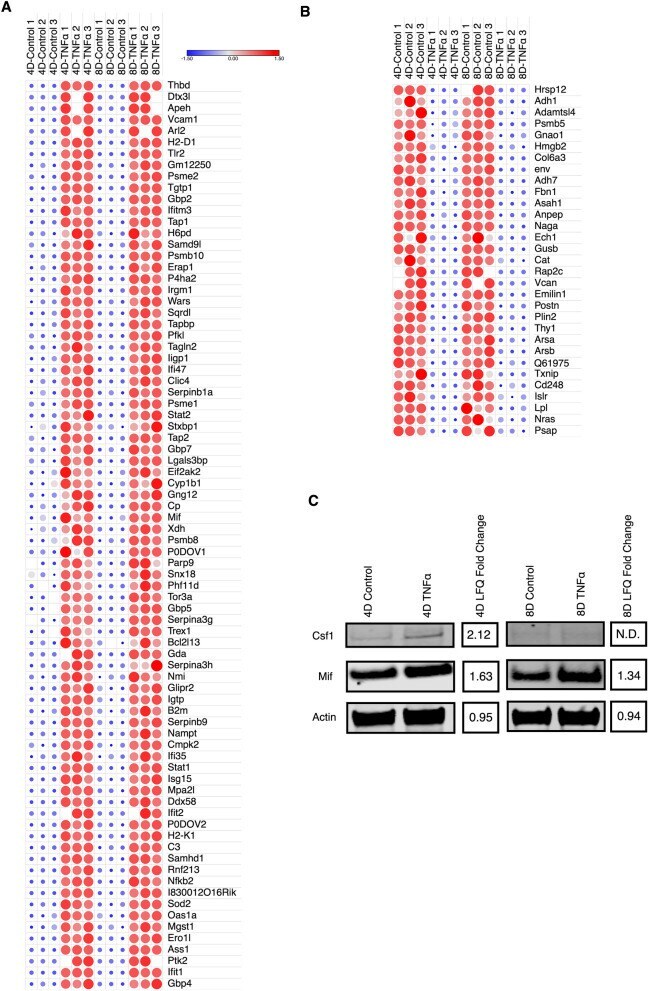
- Figure 4 Differentially expressed proteins are mostly upregulated. ( A ) Heat-map depiction of upregulated continuously expressed proteins between 4D and 8D time points. Color scale and relative dot size represent Z-scored LFQ values. Blank spaces represent missing values. ( B ) Heat-map depiction of downregulated continuously proteins between 4D and 8D time points. Color scale and relative dot size represents Z-scored LFQ values. Blank spaces represent missing values ( C ) Western blot analysis of Csf1 and Mif expression levels in 4D and 8D TNFalpha treated adipocytes and corresponding LFQ fold change. Full-length blots are shown in Supplementary Fig. S4 . N.D. no difference.
- Submitted by
- Invitrogen Antibodies (provider)
- Main image
- Experimental details
- Figure 5 Senescent tumor cells inhibit CD8 + T cell activation via monocytes to M2 type macrophage differentiation. A) CD8 + T cells activation in p16 INK4A positive and negative CRC. p16 INK4A negative and positive CRC were dissected serially and immunostained with p16 INK4A /CD8, Ki67/CD8 and Tim3, and the percentage of Ki67 + /CD8 + cells was analyzed. Three randomly selected areas of the tumor tissue were photographed (200x) and then analyzed for Ki67 + /CD8 + cell infiltration and Tim3 + cell number; the results were averaged and then presented as a dot graph. The p value was calculated by the Mann-Whitney U test. B) CD68 and SA- beta -Gal staining analysis in CRC. C) Macrophage distribution analysis with CD206 in p16 INK4A positive or negative CRC. The number of CD206 positive macrophages in CRC according to the grades of p16 INK4A immunostaining was presented as a dot graph. D) T cell proliferation assay. Isolated primary monocytes were incubated with CM from SW480 or SW480/ROS for 7 days and then monocyte differentiation was analyzed (left lower panel). CFSE labeled CD8 + T activation by anti-CD3/CD28 beads was performed under coculture with differentiated macrophages for 96 h, and suppression of T cell proliferation was measured by flow cytometry. The p value was calculated by one-way ANOVA and post hoc analysis C,D). E) Microdissection analysis. The expression in RNA sequencing indicates the relative values of the p16 INK4A positive region compared with the p16 INK4
- Submitted by
- Invitrogen Antibodies (provider)
- Main image

- Experimental details
- Figure 7 Neutralization of CXCL12 inhibits progression of AOM/DSS-induced CRC. A) SA- beta -Gal staining in normal mouse colon epithelium and AOM/DSS-induced CRC. B) CXCL12 expression in p16 INK4A positive senescent tumor cells. AOM/DSS-induced CRC tissues were serially dissected and stained with p16 INK4 , CXCL12 and CSF1 antibodies. ""1"" and ""2"" indicate the high-magnification views of the original figure. C) Scheme of the AOM/DSS-induced CRC and representative photograph of the colon tissues from each group. White circle indicates tumor nodules. D) Quantification of the number and size of tumors from each group. E) CD8 + T cell infiltration was analyzed in the AOM/DSS-induced CRC tissues from each group (200x). Arrow indicates infiltrated CD8 + T cells. F) GZMB/CD8 double immunostaining was performed and the percentage of double positive cells were counted and presented as dot graph. Data are displayed as mean and the p value were calculated using one-way ANOVA and post hoc analysis D-F).
