Explore
 Validate
 Learn
Learn Western blot
 Immunohistochemistry
 Flow cytometry
Antibody data
- Antibody Data
- Antigen structure
- References [21]
- Comments [0]
- Validations
- Flow cytometry [2]
- Other assay [20]
Submit
Validation data
Reference
Comment
Report error
- Product number
- 14-9969-37 - Provider product page

- Provider
- Invitrogen Antibodies
- Product name
- CD279 (PD-1) Monoclonal Antibody (MIH4), eBioscience™
- Antibody type
- Monoclonal
- Antigen
- Other
- Description
- Description: The MIH4 monoclonal antibody reacts with the human PD-1 (programmed death-1), a 55 kDa member of the immunoglobulin superfamily. PD-1 contains the immunoreceptor tyrosine-based inhibitory motif (ITIM) and plays a key role in peripheral tolerance and autoimmune disease. PD-1 is expressed predominantly on activated T and B lymphocytes. Two novel members of the B7 family have been identified as the PD-1 ligands, PD-L1 (B7-H1) and PD-L2 (B7-DC). Evidence reported to date suggests overlapping functions for these two PD-1 ligands and their constitutive expression on some normal tissues and upregulation on activated antigen-presenting cells. The MIH4 antibody recognizes a different epitope than antibody clones J105. Applications Reported: This MIH4 antibody has been reported for use in flow cytometric analysis, and immunohistology staining of frozen tissue sections. Applications Tested: This MIH4 antibody has been tested by flow cytometric analysis of PHA-stimulated peripheral blood mononuclear cells. This can be used at less than or equal to 1 µg per test. A test is defined as the amount (µg) of antibody that will stain a cell sample in a final volume of 100 µL. Cell number should be determined empirically but can range from 10^5 to 10^8 cells/test. It is recommended that the antibody be carefully titrated for optimal performance in the assay of interest. Purity: Greater than 90%, as determined by SDS-PAGE. Aggregation: Less than 10%, as determined by HPLC. Filtration: 0.2 µm post-manufacturing filtered.
- Reactivity
- Human, Mouse
- Host
- Mouse
- Isotype
- IgG
- Antibody clone number
- MIH4
- Vial size
- 2 mg
- Concentration
- 0.5 mg/mL
- Storage
- 4°C
Submitted references Imaging Changes and Immune-Checkpoint Expression on T Cells in Bronchoalveolar Lavage Fluid from Patients with Pulmonary Sarcoidosis.
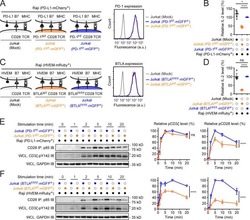
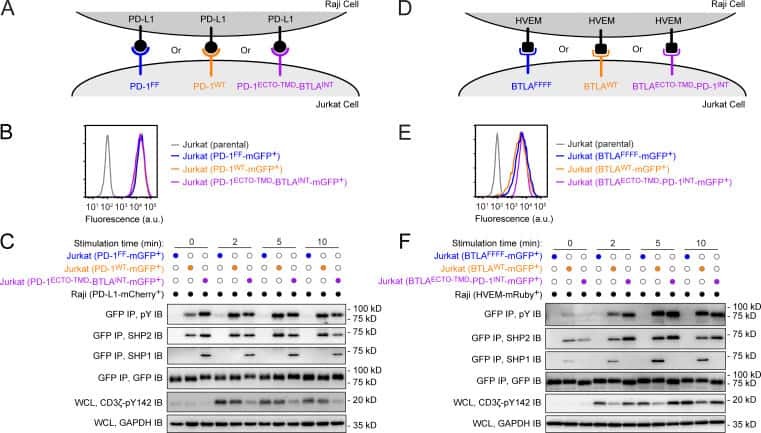
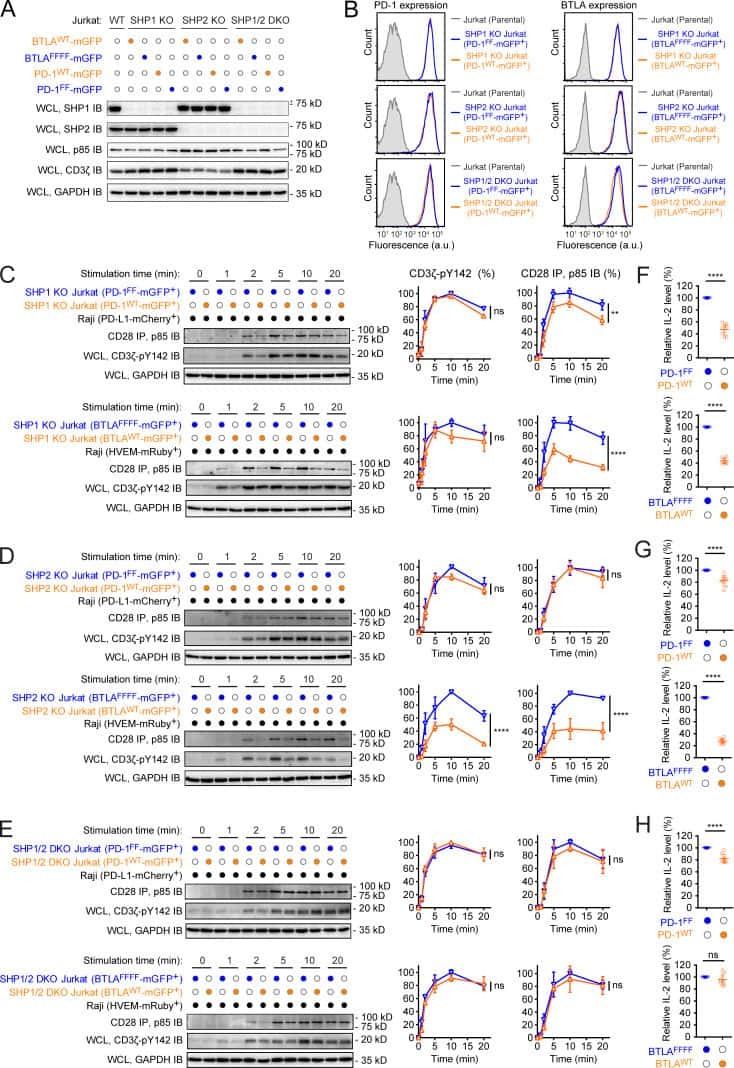
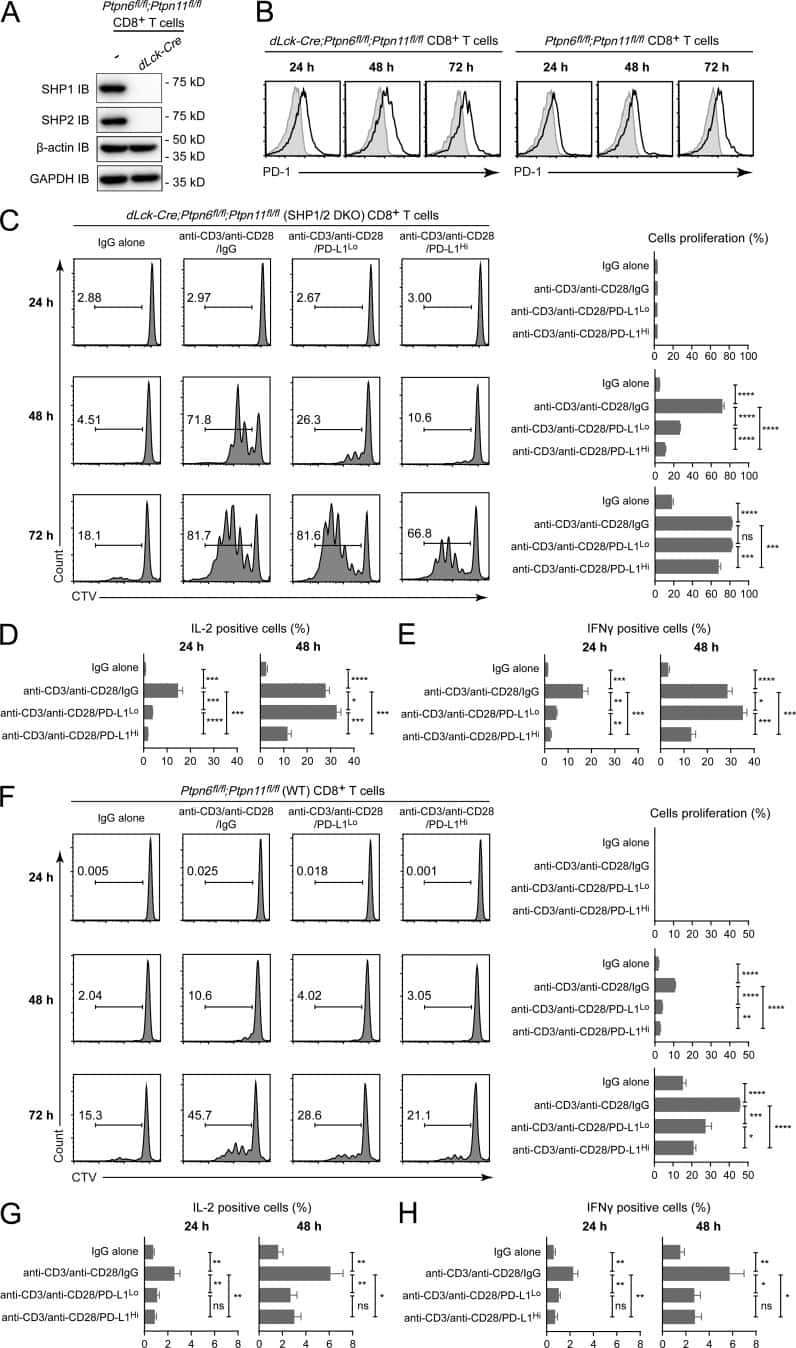
PD-1 and BTLA regulate T cell signaling differentially and only partially through SHP1 and SHP2.
Immunogenic neoantigens derived from gene fusions stimulate T cell responses.
Immune Heterogeneity Between Primary Tumors and Corresponding Metastatic Lesions and Response to Platinum Therapy in Primary Ovarian Cancer.
Optimized RNP transfection for highly efficient CRISPR/Cas9-mediated gene knockout in primary T cells.
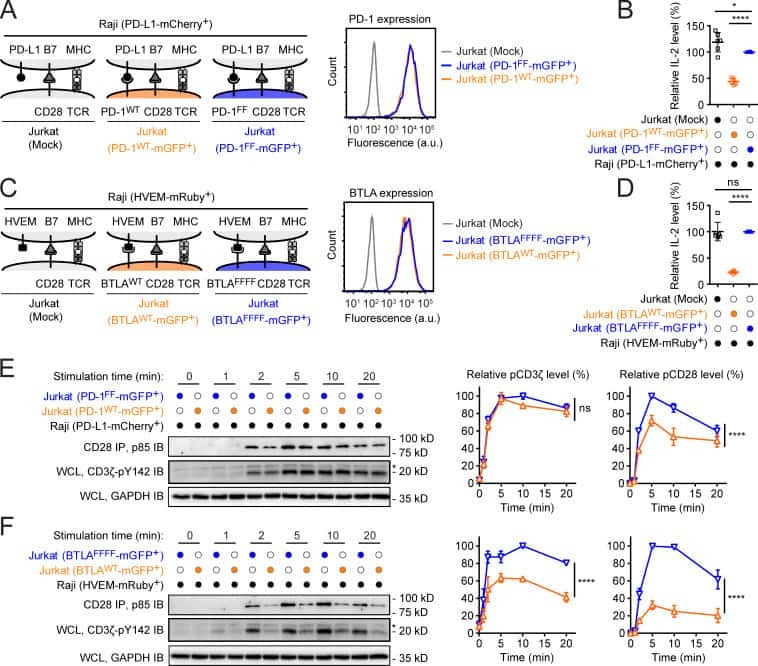
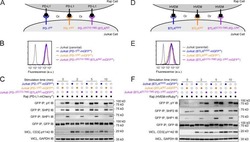
Antigen-Presenting Cell-Intrinsic PD-1 Neutralizes PD-L1 in cis to Attenuate PD-1 Signaling in T Cells.
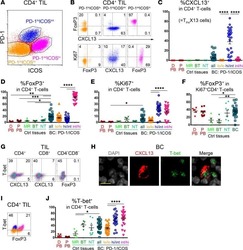
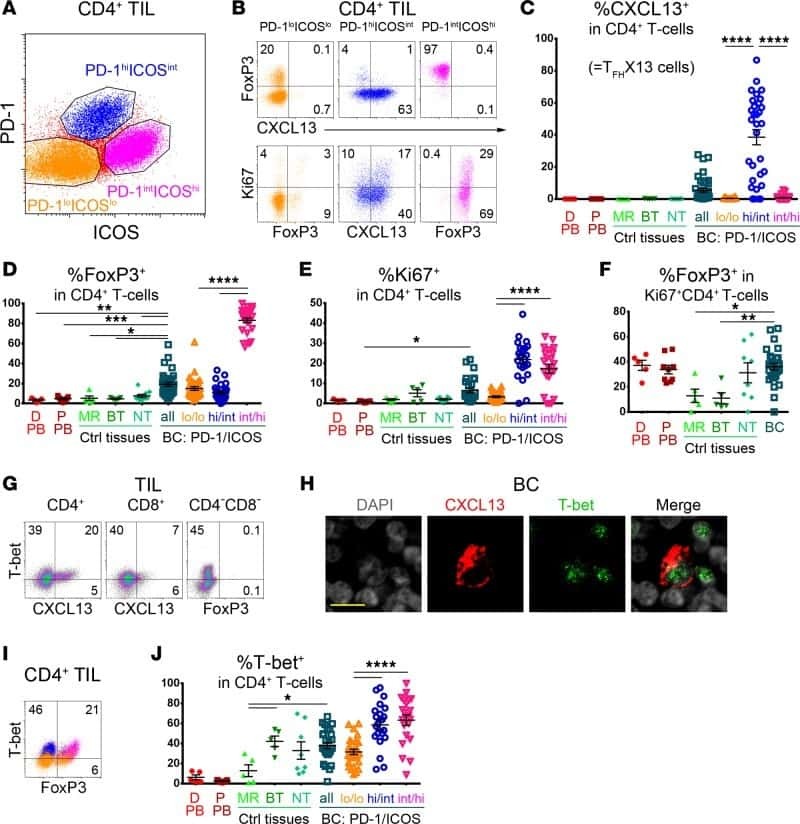
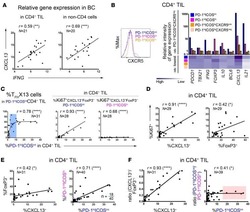
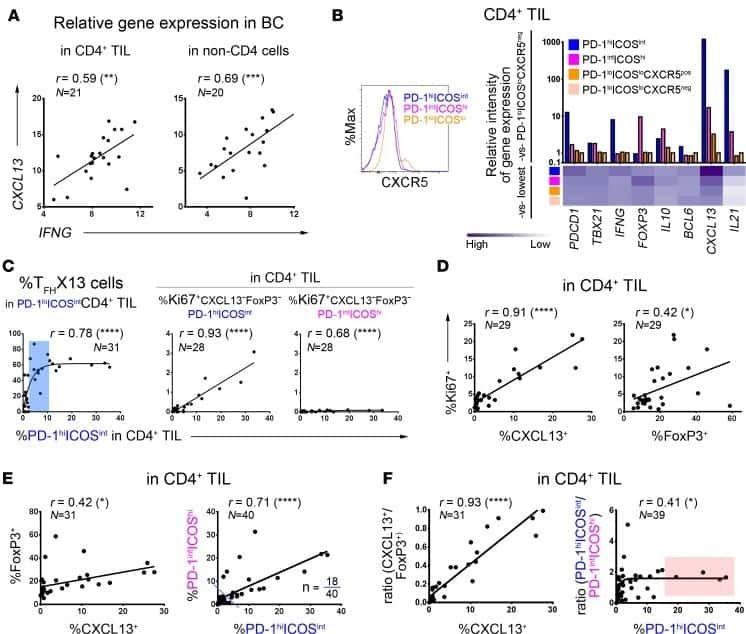
CXCL13-producing TFH cells link immune suppression and adaptive memory in human breast cancer.
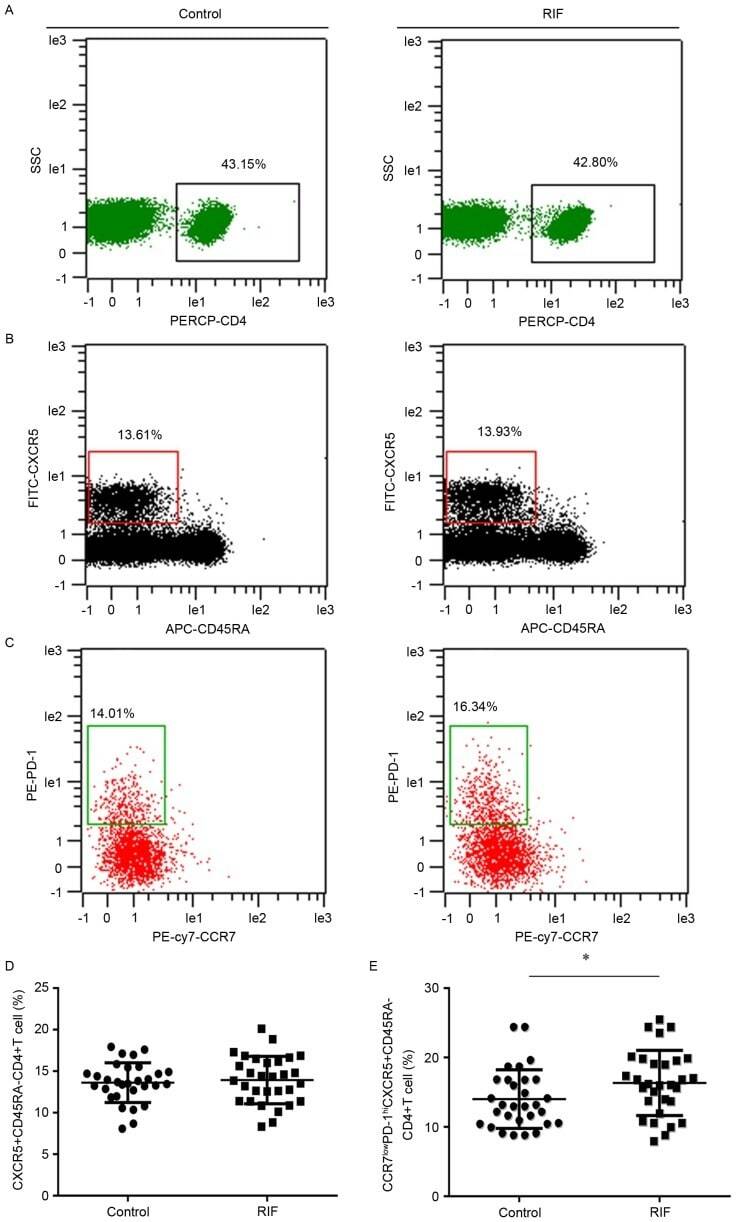
Increased levels of CCR7(lo)PD-1(hi) CXCR5(+) CD4(+) T cells, and associated factors Bcl-6, CXCR5, IL-21 and IL-6 contribute to repeated implantation failure.
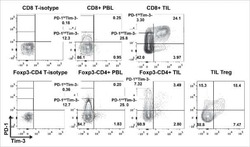
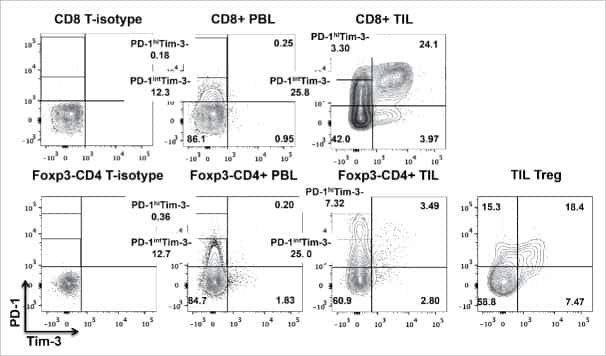
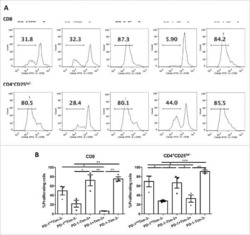
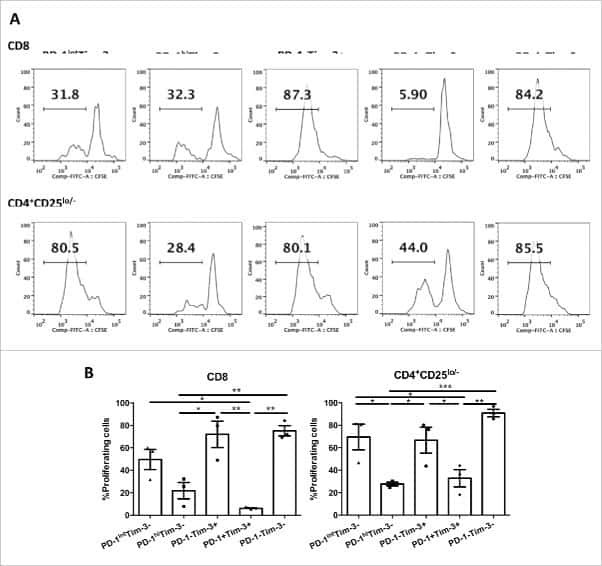
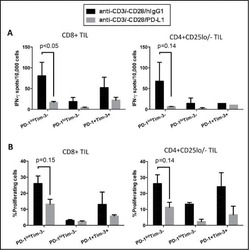
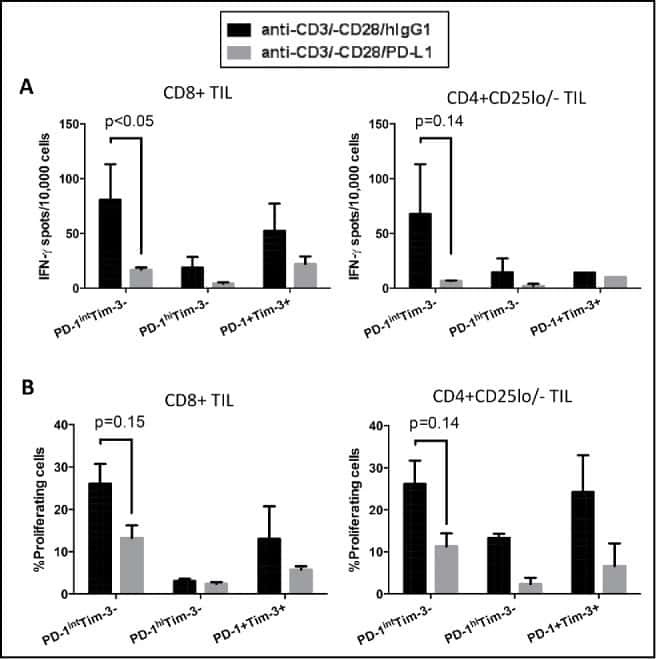
Tumor-infiltrating Tim-3(+) T cells proliferate avidly except when PD-1 is co-expressed: Evidence for intracellular cross talk.
CD103+ intraepithelial T cells in high-grade serous ovarian cancer are phenotypically diverse TCRαβ+ CD8αβ+ T cells that can be targeted for cancer immunotherapy.
Monoclonal antibodies specific to human Δ42PD1: A novel immunoregulator potentially involved in HIV-1 and tumor pathogenesis.
Psoriasis is characterized by deficient negative immune regulation compared to transient delayed-type hypersensitivity reactions.
Antigen-dependent integration of opposing proximal TCR-signaling cascades determines the functional fate of T lymphocytes.
Efficient Nef-mediated downmodulation of TCR-CD3 and CD28 is associated with high CD4+ T cell counts in viremic HIV-2 infection.
Upregulation of programmed death-1 on T cells and programmed death ligand-1 on monocytes in septic shock patients.
The PD-1/PD-L1 axis modulates the natural killer cell versus multiple myeloma effect: a therapeutic target for CT-011, a novel monoclonal anti-PD-1 antibody.
Costimulatory pathways in multiple sclerosis: distinctive expression of PD-1 and PD-L1 in patients with different patterns of disease.
Neuron-interacting satellite glial cells in human trigeminal ganglia have an APC phenotype.
FOXP3+ Tregs and B7-H1+/PD-1+ T lymphocytes co-infiltrate the tumor tissues of high-risk breast cancer patients: Implication for immunotherapy.
PD-1 up-regulation is correlated with HIV-specific memory CD8+ T-cell exhaustion in typical progressors but not in long-term nonprogressors.
Engagement of the PD-1 immunoinhibitory receptor by a novel B7 family member leads to negative regulation of lymphocyte activation.
Kotetsu Y, Yanagihara T, Suzuki K, Ando H, Eto D, Hata K, Arimura-Omori M, Yamamoto Y, Harada E, Hamada N
Biomedicines 2021 Sep 16;9(9)
Biomedicines 2021 Sep 16;9(9)
PD-1 and BTLA regulate T cell signaling differentially and only partially through SHP1 and SHP2.
Xu X, Hou B, Fulzele A, Masubuchi T, Zhao Y, Wu Z, Hu Y, Jiang Y, Ma Y, Wang H, Bennett EJ, Fu G, Hui E
The Journal of cell biology 2020 Jun 1;219(6)
The Journal of cell biology 2020 Jun 1;219(6)
Immunogenic neoantigens derived from gene fusions stimulate T cell responses.
Yang W, Lee KW, Srivastava RM, Kuo F, Krishna C, Chowell D, Makarov V, Hoen D, Dalin MG, Wexler L, Ghossein R, Katabi N, Nadeem Z, Cohen MA, Tian SK, Robine N, Arora K, Geiger H, Agius P, Bouvier N, Huberman K, Vanness K, Havel JJ, Sims JS, Samstein RM, Mandal R, Tepe J, Ganly I, Ho AL, Riaz N, Wong RJ, Shukla N, Chan TA, Morris LGT
Nature medicine 2019 May;25(5):767-775
Nature medicine 2019 May;25(5):767-775
Immune Heterogeneity Between Primary Tumors and Corresponding Metastatic Lesions and Response to Platinum Therapy in Primary Ovarian Cancer.
Dötzer K, Schlüter F, Schoenberg MB, Bazhin AV, von Koch FE, Schnelzer A, Anthuber S, Grab D, Czogalla B, Burges A, Werner J, Mahner S, Mayer B
Cancers 2019 Aug 26;11(9)
Cancers 2019 Aug 26;11(9)
Optimized RNP transfection for highly efficient CRISPR/Cas9-mediated gene knockout in primary T cells.
Seki A, Rutz S
The Journal of experimental medicine 2018 Mar 5;215(3):985-997
The Journal of experimental medicine 2018 Mar 5;215(3):985-997
Antigen-Presenting Cell-Intrinsic PD-1 Neutralizes PD-L1 in cis to Attenuate PD-1 Signaling in T Cells.
Zhao Y, Harrison DL, Song Y, Ji J, Huang J, Hui E
Cell reports 2018 Jul 10;24(2):379-390.e6
Cell reports 2018 Jul 10;24(2):379-390.e6
CXCL13-producing TFH cells link immune suppression and adaptive memory in human breast cancer.
Gu-Trantien C, Migliori E, Buisseret L, de Wind A, Brohée S, Garaud S, Noël G, Dang Chi VL, Lodewyckx JN, Naveaux C, Duvillier H, Goriely S, Larsimont D, Willard-Gallo K
JCI insight 2017 Jun 2;2(11)
JCI insight 2017 Jun 2;2(11)
Increased levels of CCR7(lo)PD-1(hi) CXCR5(+) CD4(+) T cells, and associated factors Bcl-6, CXCR5, IL-21 and IL-6 contribute to repeated implantation failure.
Gong Q, Zhu Y, Pang N, Ai H, Gong X, La X, Ding J
Experimental and therapeutic medicine 2017 Dec;14(6):5931-5941
Experimental and therapeutic medicine 2017 Dec;14(6):5931-5941
Tumor-infiltrating Tim-3(+) T cells proliferate avidly except when PD-1 is co-expressed: Evidence for intracellular cross talk.
Li J, Shayan G, Avery L, Jie HB, Gildener-Leapman N, Schmitt N, Lu BF, Kane LP, Ferris RL
Oncoimmunology 2016;5(10):e1200778
Oncoimmunology 2016;5(10):e1200778
CD103+ intraepithelial T cells in high-grade serous ovarian cancer are phenotypically diverse TCRαβ+ CD8αβ+ T cells that can be targeted for cancer immunotherapy.
Komdeur FL, Wouters MC, Workel HH, Tijans AM, Terwindt AL, Brunekreeft KL, Plat A, Klip HG, Eggink FA, Leffers N, Helfrich W, Samplonius DF, Bremer E, Wisman GB, Daemen T, Duiker EW, Hollema H, Nijman HW, de Bruyn M
Oncotarget 2016 Nov 15;7(46):75130-75144
Oncotarget 2016 Nov 15;7(46):75130-75144
Monoclonal antibodies specific to human Δ42PD1: A novel immunoregulator potentially involved in HIV-1 and tumor pathogenesis.
Cheng L, Tang X, Liu L, Peng J, Nishiura K, Cheung AK, Guo J, Wu X, Tang HY, An M, Zhou J, Cheung KW, Wang H, Guan X, Wu Z, Chen Z
mAbs 2015;7(3):620-9
mAbs 2015;7(3):620-9
Psoriasis is characterized by deficient negative immune regulation compared to transient delayed-type hypersensitivity reactions.
Gulati N, Suárez-Fariñas M, Correa da Rosa J, Krueger JG
F1000Research 2015;4:149
F1000Research 2015;4:149
Antigen-dependent integration of opposing proximal TCR-signaling cascades determines the functional fate of T lymphocytes.
Wolchinsky R, Hod-Marco M, Oved K, Shen-Orr SS, Bendall SC, Nolan GP, Reiter Y
Journal of immunology (Baltimore, Md. : 1950) 2014 Mar 1;192(5):2109-19
Journal of immunology (Baltimore, Md. : 1950) 2014 Mar 1;192(5):2109-19
Efficient Nef-mediated downmodulation of TCR-CD3 and CD28 is associated with high CD4+ T cell counts in viremic HIV-2 infection.
Khalid M, Yu H, Sauter D, Usmani SM, Schmokel J, Feldman J, Gruters RA, van der Ende ME, Geyer M, Rowland-Jones S, Osterhaus AD, Kirchhoff F
Journal of virology 2012 May;86(9):4906-20
Journal of virology 2012 May;86(9):4906-20
Upregulation of programmed death-1 on T cells and programmed death ligand-1 on monocytes in septic shock patients.
Zhang Y, Li J, Lou J, Zhou Y, Bo L, Zhu J, Zhu K, Wan X, Cai Z, Deng X
Critical care (London, England) 2011;15(1):R70
Critical care (London, England) 2011;15(1):R70
The PD-1/PD-L1 axis modulates the natural killer cell versus multiple myeloma effect: a therapeutic target for CT-011, a novel monoclonal anti-PD-1 antibody.
Benson DM Jr, Bakan CE, Mishra A, Hofmeister CC, Efebera Y, Becknell B, Baiocchi RA, Zhang J, Yu J, Smith MK, Greenfield CN, Porcu P, Devine SM, Rotem-Yehudar R, Lozanski G, Byrd JC, Caligiuri MA
Blood 2010 Sep 30;116(13):2286-94
Blood 2010 Sep 30;116(13):2286-94
Costimulatory pathways in multiple sclerosis: distinctive expression of PD-1 and PD-L1 in patients with different patterns of disease.
Trabattoni D, Saresella M, Pacei M, Marventano I, Mendozzi L, Rovaris M, Caputo D, Borelli M, Clerici M
Journal of immunology (Baltimore, Md. : 1950) 2009 Oct 15;183(8):4984-93
Journal of immunology (Baltimore, Md. : 1950) 2009 Oct 15;183(8):4984-93
Neuron-interacting satellite glial cells in human trigeminal ganglia have an APC phenotype.
van Velzen M, Laman JD, Kleinjan A, Poot A, Osterhaus AD, Verjans GM
Journal of immunology (Baltimore, Md. : 1950) 2009 Aug 15;183(4):2456-61
Journal of immunology (Baltimore, Md. : 1950) 2009 Aug 15;183(4):2456-61
FOXP3+ Tregs and B7-H1+/PD-1+ T lymphocytes co-infiltrate the tumor tissues of high-risk breast cancer patients: Implication for immunotherapy.
Ghebeh H, Barhoush E, Tulbah A, Elkum N, Al-Tweigeri T, Dermime S
BMC cancer 2008 Feb 23;8:57
BMC cancer 2008 Feb 23;8:57
PD-1 up-regulation is correlated with HIV-specific memory CD8+ T-cell exhaustion in typical progressors but not in long-term nonprogressors.
Zhang JY, Zhang Z, Wang X, Fu JL, Yao J, Jiao Y, Chen L, Zhang H, Wei J, Jin L, Shi M, Gao GF, Wu H, Wang FS
Blood 2007 Jun 1;109(11):4671-8
Blood 2007 Jun 1;109(11):4671-8
Engagement of the PD-1 immunoinhibitory receptor by a novel B7 family member leads to negative regulation of lymphocyte activation.
Freeman GJ, Long AJ, Iwai Y, Bourque K, Chernova T, Nishimura H, Fitz LJ, Malenkovich N, Okazaki T, Byrne MC, Horton HF, Fouser L, Carter L, Ling V, Bowman MR, Carreno BM, Collins M, Wood CR, Honjo T
The Journal of experimental medicine 2000 Oct 2;192(7):1027-34
The Journal of experimental medicine 2000 Oct 2;192(7):1027-34
No comments: Submit comment
Supportive validation
- Submitted by
- Invitrogen Antibodies (provider)
- Main image

- Experimental details
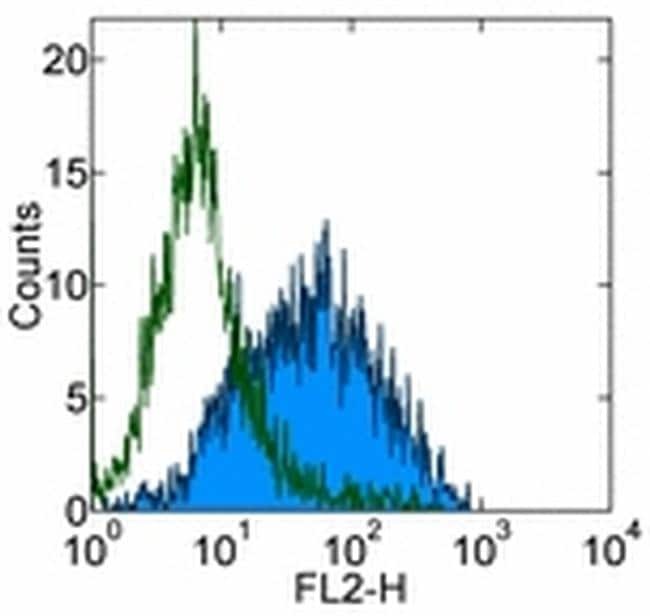
- Staining of 3 day PHA-stimulated normal human peripheral blood cells with 0.5 µg of Mouse IgG1 K Isotype Control Purified (Product # 14-4714-82) (open histogram) or 0.5 µg of Anti-Human CD279 (PD-1) Purified (filled histogram) followed by Anti-Mouse IgG Biotin (Product # 13-4013-85) and Streptavidin PE (Product # 12-4317-87).Total viable cells were used for analysis.

- Submitted by
- Invitrogen Antibodies (provider)
- Main image

- Experimental details
- Staining of 3 day PHA-stimulated normal human peripheral blood cells with 0.5 µg of Mouse IgG1 K Isotype Control Purified (Product # 14-4714-82) (open histogram) or 0.5 µg of Anti-Human CD279 (PD-1) Purified (filled histogram) followed by Anti-Mouse IgG Biotin (Product # 13-4013-85) and Streptavidin PE (Product # 12-4317-87).Total viable cells were used for analysis.
Supportive validation
- Submitted by
- Invitrogen Antibodies (provider)
- Main image
- Experimental details
- NULL

- Submitted by
- Invitrogen Antibodies (provider)
- Main image
- Experimental details
- NULL
- Submitted by
- Invitrogen Antibodies (provider)
- Main image
- Experimental details
- NULL
- Submitted by
- Invitrogen Antibodies (provider)
- Main image
- Experimental details
- NULL
- Submitted by
- Invitrogen Antibodies (provider)
- Main image
- Experimental details
- NULL
- Submitted by
- Invitrogen Antibodies (provider)
- Main image
- Experimental details
- NULL
- Submitted by
- Invitrogen Antibodies (provider)
- Main image
- Experimental details
- NULL
- Submitted by
- Invitrogen Antibodies (provider)
- Main image
- Experimental details
- NULL
- Submitted by
- Invitrogen Antibodies (provider)
- Main image
- Experimental details
- NULL
- Submitted by
- Invitrogen Antibodies (provider)
- Main image
- Experimental details
- NULL
- Submitted by
- Invitrogen Antibodies (provider)
- Main image
- Experimental details
- NULL

- Submitted by
- Invitrogen Antibodies (provider)
- Main image
- Experimental details
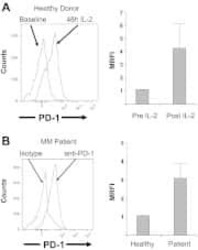
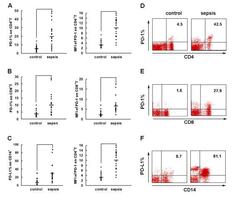
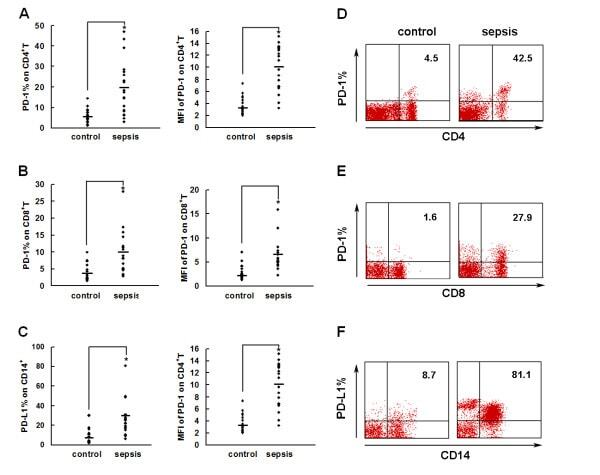
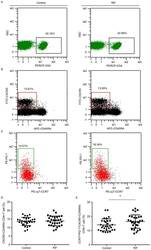
- Figure 2 PD-1 and PD-L1 were upregulated on T cells and monocytes in septic shock patients . Blood samples were obtained from 19 septic shock patients and 22 healthy controls and were stained for programmed death-1 (PD-1) and programmed death ligand-1 (PD-L1) gated on CD4 + T cells, CD8 + T cells, and CD14 + monocytes. (a) to (c) Percentage of PD-1 expression on (a) CD4 + T cells and (b) CD8 + T cells, and (c) percentage of PD-L1 expression on CD14 + monocytes. Each dot represents one individual. Data are mean +- standard error of the mean (SEM) of three independent experiments. ** P < 0.01 compared with healthy controls. (d) to (f) Mean fluorescence intensity (relative fluorescence units) of PD-1 expression on (d) CD4 + T cells, (e) PD-1 expression on CD8 + T cells, and (f) PD-L1 expression on CD14 + monocytes Each dot represents one individual. Data are mean +- SEM of three independent experiments. * P < 0.05 compared with healthy controls. (g) Representative PD-1 expression levels on CD4 + T cells and CD8 + T cells, and PD-L1 expression on CD14 + monocytes. Values in the upper-right quadrant indicate the percentage of cells that express PD-1 or PD-L1.
- Submitted by
- Invitrogen Antibodies (provider)
- Main image
- Experimental details
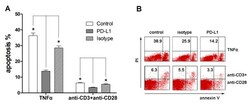
- Figure 3 Blockade of the PD-1/PD-L1 pathway by anti-PD-L1 antibody . Blockade of the programmed death-1 (PD-1)/programmed death ligand-1 (PD-L1) pathway by anti-PD-L1 antibody decreased apoptosis of human peripheral T cells from septic patients induced by TNFalpha and by T-cell receptor ligation. (a) Peripheral blood mononuclear cells were obtained from septic shock patients and cultured at 4 x 10 5 per well in plates precoated with 10 ng/ml TNFalpha (Peprotech) alone or with anti-PD-L1 antibody(10 mug/ml) or isotype (10 mug/ml) for 18 hours to analyze apoptosis by flow cytometry. Alternatively, peripheral blood mononuclear cells were treated with 10 mug/ml anti-CD3 and 5 mug/ml anti-CD28 alone or with anti-PD-L1 antibody (10 mug/ml) or isotype (10 mug/ml) for 72 hours. Cells were doubled-stained with annexin V and propidium iodide (PI) with gating on CD3 + cells and were analyzed by fluorescence-activated cell sorting. Apoptosis was calculated as the percentage of annexin V-positive/PI-negative cells after gating on CD3 + cells. * P < 0.05 compared with control group. (b) Representative micrographs from six independent experiments. Representative data showing apoptosis of CD3 + T cells.

- Submitted by
- Invitrogen Antibodies (provider)
- Main image
- Experimental details
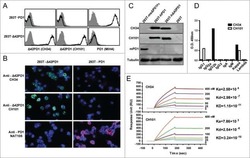
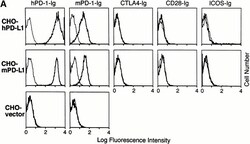
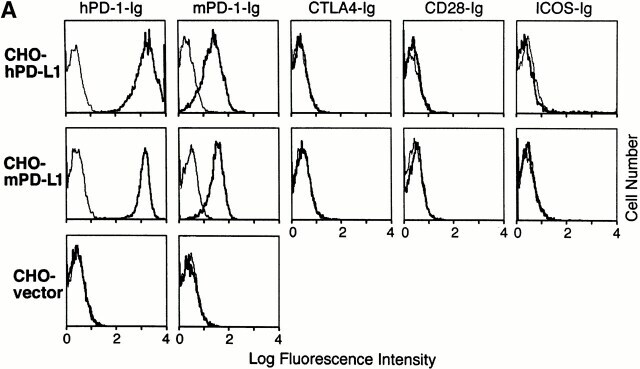
- Figure 2 The binding of PD-1 to PD-L1. (A) CHO cells stably transfected with human or murine PD-L1 or vector alone were stained with hPD-1.Ig(gamma2a), mPD-1.Ig(gamma1), hCTLA-4.Ig(gamma2a), hCD28.Ig(gamma1), or hICOS.Ig(gamma2a) (species matched), and developed with goat anti-murine IgG2a-PE or anti-human IgG-FITC antisera. (B) PD-L1.Ig was tested for binding to immobilized mPD-1.Ig(gamma1) (gray bars), hPD-1.Ig(gamma1) (black bars), and hCTLA-4.Ig(gamma1) (white bars) using surface plasmon resonance on a BIAcore 2000 instrument. Receptor-Fc fusion proteins were immobilized on a CM5 dextran chip by amine coupling with normal human serum/ N -ethyl- N ''-(dimethylamino)propyl I carbodiimide hydrochloride (EDC) in 10 mM sodium acetate, pH 4.0, as described (reference 27 ). The amounts of protein immobilized were 5,383 response units (RU) for mPD-1.Ig(gamma1), 5,416 RU for hPD-1.Ig(gamma1), and 11,493 RU for hCTLA-4.Ig(gamma1). Concentrated COS-conditioned medium from hPD-L1.Ig(gamma2a)-transfected cells was analyzed with (+) or without (-) coinjection of 100 mug/ml of soluble mPD-1.Ig, hPD-1.Ig, or hCTLA-4.Ig for competition. Binding was quantified as an increase in RU at 60 s after the end of injection compared with a baseline established 20 s before injection.
- Submitted by
- Invitrogen Antibodies (provider)
- Main image
- Experimental details
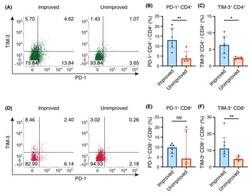
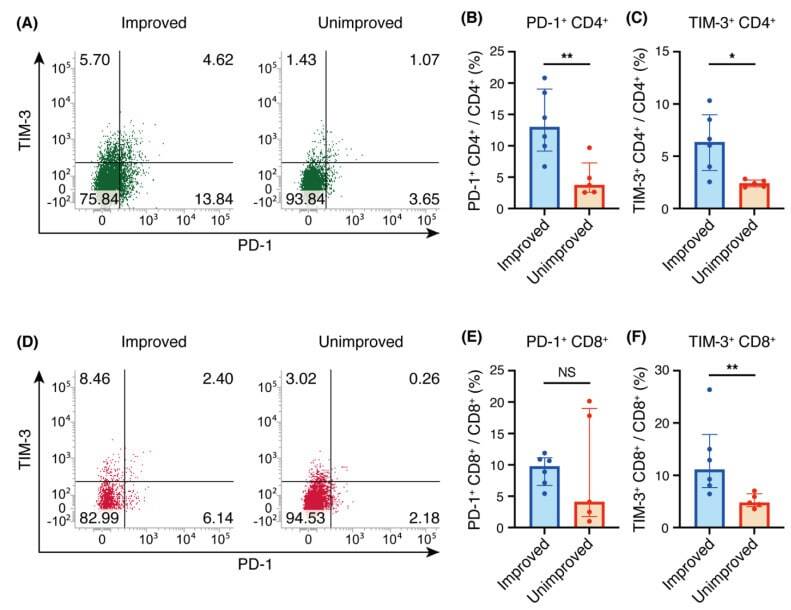
- Figure 2 Programmed cell death 1 (PD-1) and T-cell immunoglobulin- and mucin-domain-containing molecule-3 (TIM-3) expression on CD4 + and CD8 + T cells in bronchoalveolar lavage fluid (BALF). ( A , D ) Representative flow cytometric analysis of PD-1 and TIM-3 expression on CD4 + T cells ( A ) and CD8 + T cells ( D ) in BALF. ( B , E ) Percentages of PD-1 + cells among CD4 + T cells ( B ) and CD8 + T cells ( E ). ( C , F ) Percentages of TIM-3 + cells among CD4 + T cells ( C ) and CD8 + T cells ( F ). ( B , C , E , F ) Individual patient data as well as medians and interquartile ranges are shown. * p < 0.05; ** p < 0.01 (Mann-Whitney U test).
- Submitted by
- Invitrogen Antibodies (provider)
- Main image
- Experimental details
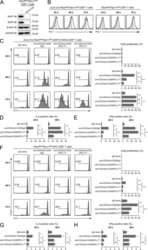
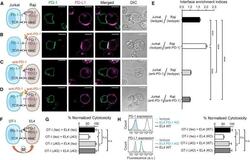
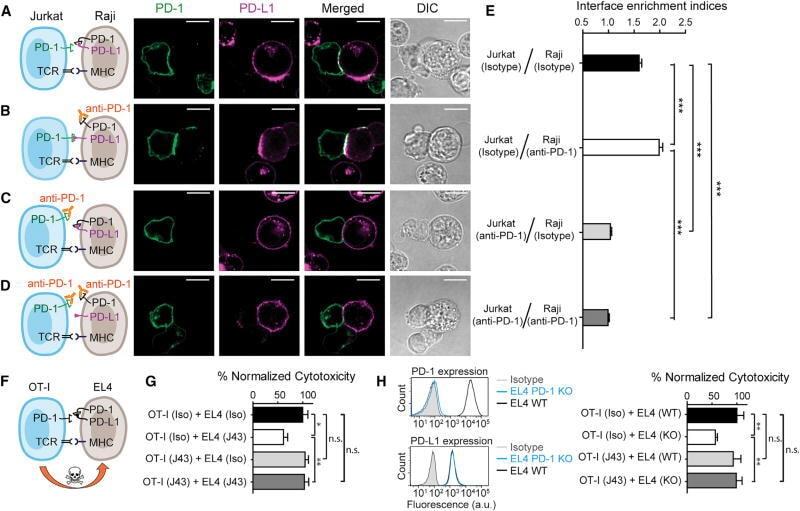
- Figure 7 Blockade of APC-Intrinsic PD-1 Enhances the Synaptic Enrichment of T Cell-Intrinsic PD-1 and Inhibits T Cell-Mediated Cytotoxicity (A) Left: cartoon showing a Jurkat cell expressing PD-1-mGFP (shown as PD-1 in green) conjugated with a Raji cell co-transduced with PD-L1-mCherry and unlabeled PD-1. Right: representative confocal images of the conjugate at the indicated channel acquired 2 min after cell-cell contact. Scale bars, 10 um. (B-D) Same as (A), except that Raji (PD-L1+/PD-1+) cells (B), Jurkat (PD-1-mGFP) cells (C), or both (D) were preincubated with pembrolizumab and washed extensively prior to conjugation. Scale bars, 10 um. (E) Bar graph comparing the interface enrichment indices (calculated as described in STAR Methods) of the four conditions shown in (A)-(D). Data are expressed as mean +- SEM; n = 40 cells from three independent experiments. (F) Cartoon illustrating the cytotoxicity assay, in which EL4 cells were used as the target for OT-I cytotoxic T cells. (G) Bar graph summarizing the OT-I cytotoxicity under indicated conditions, with PD-1 blockade antibody J43 or isotype antibody (Iso) preincubated with neither cell, only EL4, only OT-I, or both cell types. See STAR Methods for details. Cytotoxicity was normalized to the no blockade antibody condition (i.e., EL4 and OT-I preincubated with the isotype control). n.s., not significantly different. Data are presented as mean +- SEM from three independent replicates. (H) Left: FACS histograms showing PD-1
- Submitted by
- Invitrogen Antibodies (provider)
- Main image
- Experimental details
- Figure 1. Expression of CCR7(lo)PD-1(hi) T follicle helper cells in the peripheral blood. Cytometric plots indicating how (A) PERCP-CD4 was used to identify CD4 + T cells. These cells were further analyzed to identify cells expressing (B) CXCR5 and CD45RA. (C) CXCR5 + CD45RA - cells were analyzed to reveal the presence of CCR7 and PD-1. The presence of (D) CXCR5 + CD45RA - CD4 + T cells and (E) CCR7(lo)PD-1(hi) CXCR5 + CD45RA - CD4 + T cells in the RIF group and control group were compared. *P
- Submitted by
- Invitrogen Antibodies (provider)
- Main image
- Experimental details
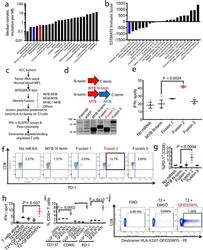
- Fig. 3 - MYB-NFIB generates an immuno-stimulatory peptide recognized by autologous T cells. a , Plot of median tumor mutational burden across 21 TCGA cancer types, adenoid cystic carcinomas 32 , 33 , and Patient MSK-HN1. b , Plot of mean ESTIMATE Immune Scores across 21 TCGA cancer types and adenoid cystic carcinomas. c , Experimental scheme for testing immunogenicity of MYB-NFIB fusion peptides from ACC patients. d , Diagram representation of the MYB-N-term and MYB-NFIB constructs expressed in HEK293 cells and validation by immunoblotting for MYB. Data are representative of two independent experiments. e , Quantification of IFN-gamma spots produced by patient T cells after 18 hr co-culture with healthy donor (""HD1""; HLA-A*02:01-positive) DCs (n=3) electroporated with mRNA. (one-way ANOVA followed by Dunnett's correction for multiple comparisons, 95%CI=-34.96 to -9.044, Effect size Eta Squared=0.782, DF=10, P =0.0024) f , Flow cytometry analysis of PD-1 expression on T cells used in (e). g , Quantification of CD3 + or CD8 + T cells used in (e) that are PD-1 + (n=3). (one-way ANOVA followed by Dunnett's correction for multiple comparisons, 95%CI=-17.58 to -5.877, Effect size Eta Squared=0.742, DF=13, P =0.0004) h , Quantification of IFN-gamma spots produced by patient T cells after 18 hr co-culture with T2 cells (n=3) pulsed with 10 muM of the indicated peptides. (one-way ANOVA followed by Dunnett's correction for multiple comparisons, 95%CI= -9.061 to -0.2724, Effect size E
- Submitted by
- Invitrogen Antibodies (provider)
- Main image
- Experimental details
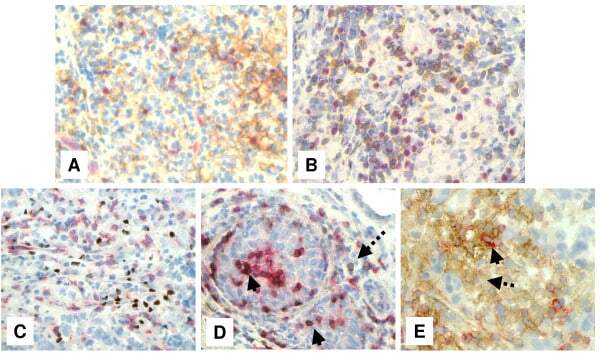
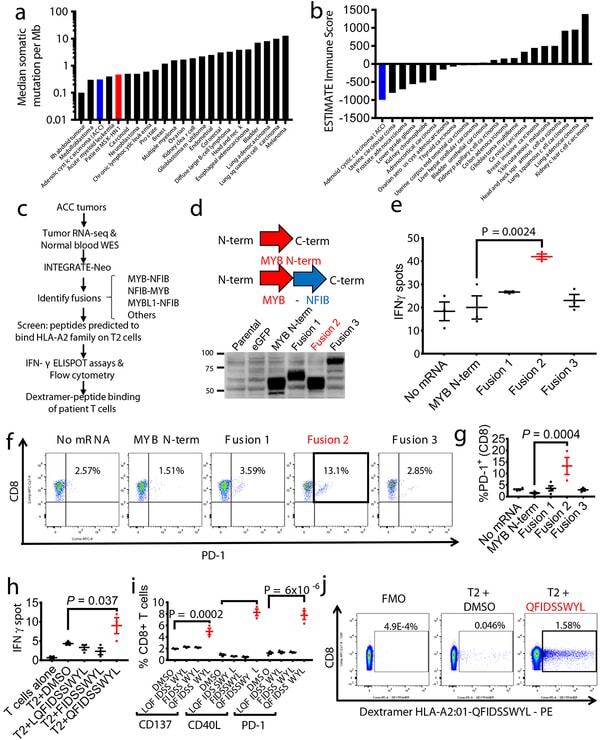
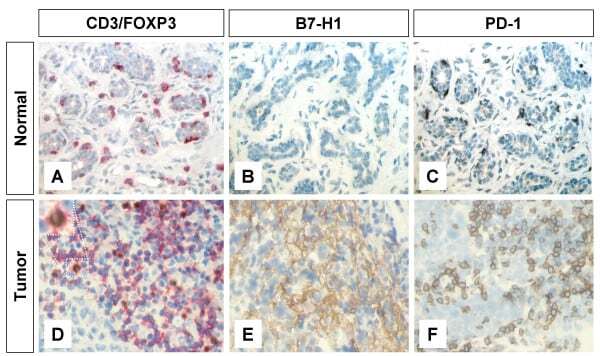
- Figure 1 Immunohistochemical staining of FOXP3+ T regs B7-H1 +and PD-1+ in T lymphocytes of breast tissues . Representative micrographs at x 530 magnification of (A&D) CD3/FOXP3 double staining (red color, membranous for CD3 and brown nuclear color for FOXP3 expression). (B&E) B7-H1 single staining (brown color, membranous/cytoplasmic expression). (C&F) PD-1 single staining (brown color, membranous expression). Upper panel (A-C) is sections for normal breast duct and lower panel (D-F) is sections for infiltrating ductal carcinoma of the breast.
- Submitted by
- Invitrogen Antibodies (provider)
- Main image

- Experimental details
- Figure 4 Immunohistochemical staining showing the expression of FOXP3, B7-H1 and PD-1 molecules by different subsets of TIL . Representative micrographs at x 530 magnification of (A) double staining of B7-H1 (brown color, membranous/cytoplasmic) and FOXP3 (red color, nuclear) in an area rich in TIL of tumor section. (B) Double staining of PD-1 (brown color, membranous) and FOXP3 (red color, nuclear) in sections from the same tumor as in A. (C) double staining of FOXP3 (brown color, nuclear) and CD8 (red color, membranous). (D) double staining of PD-1 (brown color, membranous) and CD8 (red color, membranous). Solid arrows indicate CD8 + /PD-1 + T lymphocytes and dashed arrow indicates a CD8 - /PD-1 + T lymphocyte. (E) Double staining of B7-H1 (brown color, membranous/cytoplasmic) and CD8 (red color, membranous). Solid arrow indicates a CD8 + /B7-H1 + T lymphocyte and dashed arrow indicates a CD8 - /B7-H1 + T lymphocyte.