Explore
 Validate
 Learn
Learn Western blot
Antibody data
- Antibody Data
- Antigen structure
- References [1]
- Comments [0]
- Validations
- Western blot [1]
- Immunocytochemistry [3]
- Immunohistochemistry [1]
- Other assay [1]
Submit
Validation data
Reference
Comment
Report error
- Product number
- PA5-20439 - Provider product page

- Provider
- Invitrogen Antibodies
- Product name
- RASD2 Polyclonal Antibody
- Antibody type
- Polyclonal
- Antigen
- Synthetic peptide
- Description
- A suggested positive control is rat colon lysate. PA5-20439 can be used with blocking peptide PEP-0556.
- Reactivity
- Human, Rat
- Host
- Rabbit
- Isotype
- IgG
- Vial size
- 100 μg
- Concentration
- 1 mg/mL
- Storage
- Maintain refrigerated at 2-8°C for up to 3 months. For long term storage store at -20°C
Submitted references Single-cell RNA-Seq resolves cellular complexity in sensory organs from the neonatal inner ear.
Burns JC, Kelly MC, Hoa M, Morell RJ, Kelley MW
Nature communications 2015 Oct 15;6:8557
Nature communications 2015 Oct 15;6:8557
No comments: Submit comment
Supportive validation
- Submitted by
- Invitrogen Antibodies (provider)
- Main image

- Experimental details
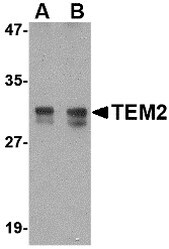
- Western Blot analysis of TEM2 in rat colon tissue lysate with RASD2 Polyclonal Antibody (Product # PA5-20439) at (A) 1 and (B) 2 µg/mL.
Supportive validation
- Submitted by
- Invitrogen Antibodies (provider)
- Main image

- Experimental details
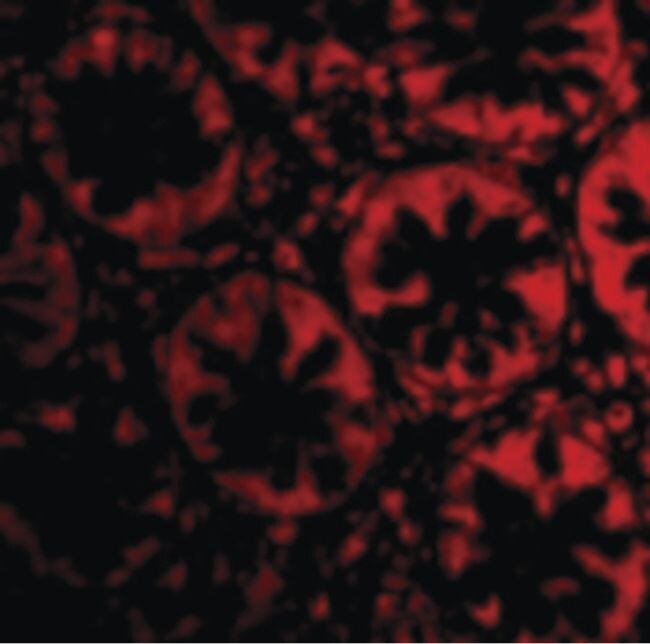
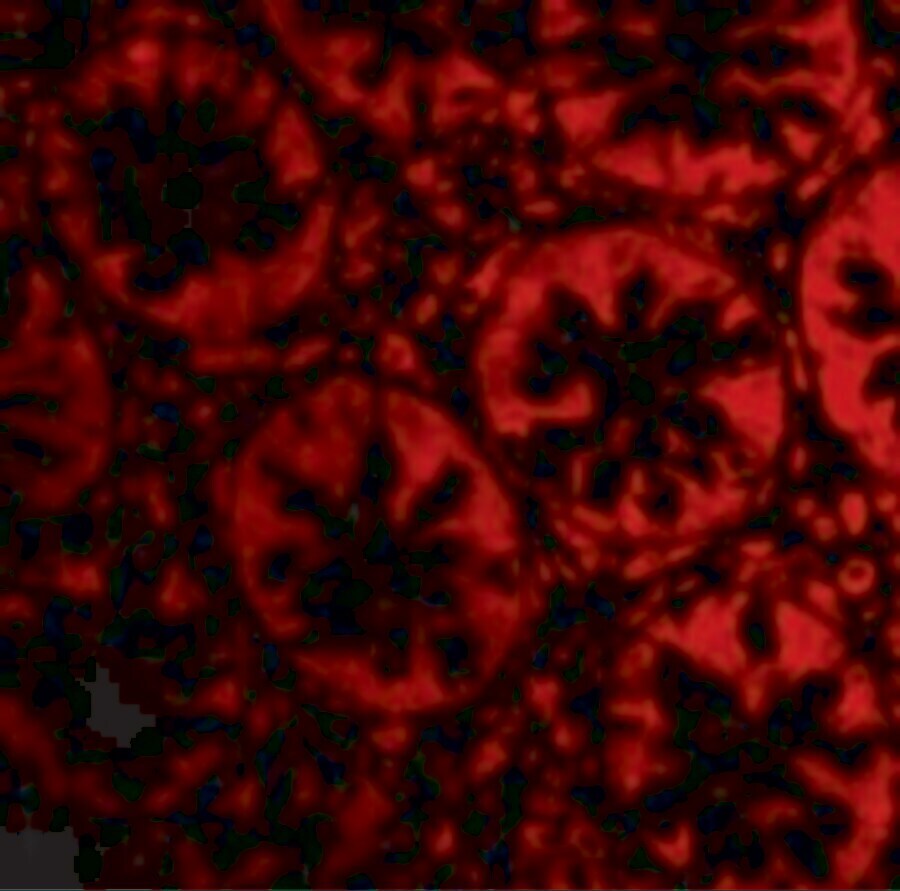
- Immunofluorescent analysis of human colon cells using a TEM2 polyclonal antibody (Product # PA5-20439) at a 20 µg/mL dilution.
- Submitted by
- Invitrogen Antibodies (provider)
- Main image

- Experimental details
- Immunofluorescence of TEM2 in Human Colon cells with RASD2 Polyclonal Antibody (Product # PA5-20439) at 20 µg/mL.

- Submitted by
- Invitrogen Antibodies (provider)
- Main image
- Experimental details
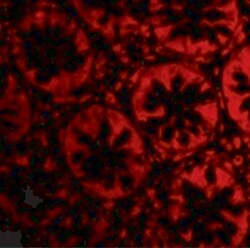
- Immunofluorescence of TEM2 in Human Colon cells with RASD2 Polyclonal Antibody (Product # PA5-20439) at 20 µg/mL.
Supportive validation
- Submitted by
- Invitrogen Antibodies (provider)
- Main image
- Experimental details
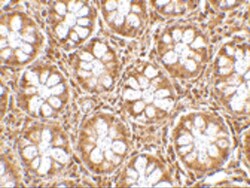
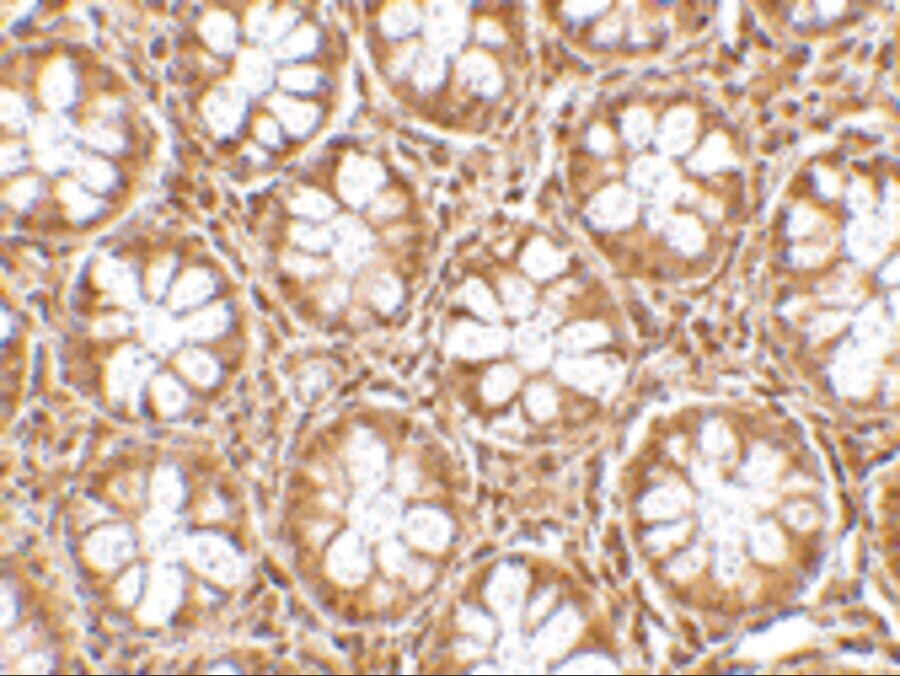
- Immunohistochemistry of TEM2 in human colon tissue with RASD2 Polyclonal Antibody (Product # PA5-20439) at 2.5 µg/mL.
Supportive validation
- Submitted by
- Invitrogen Antibodies (provider)
- Main image
- Experimental details
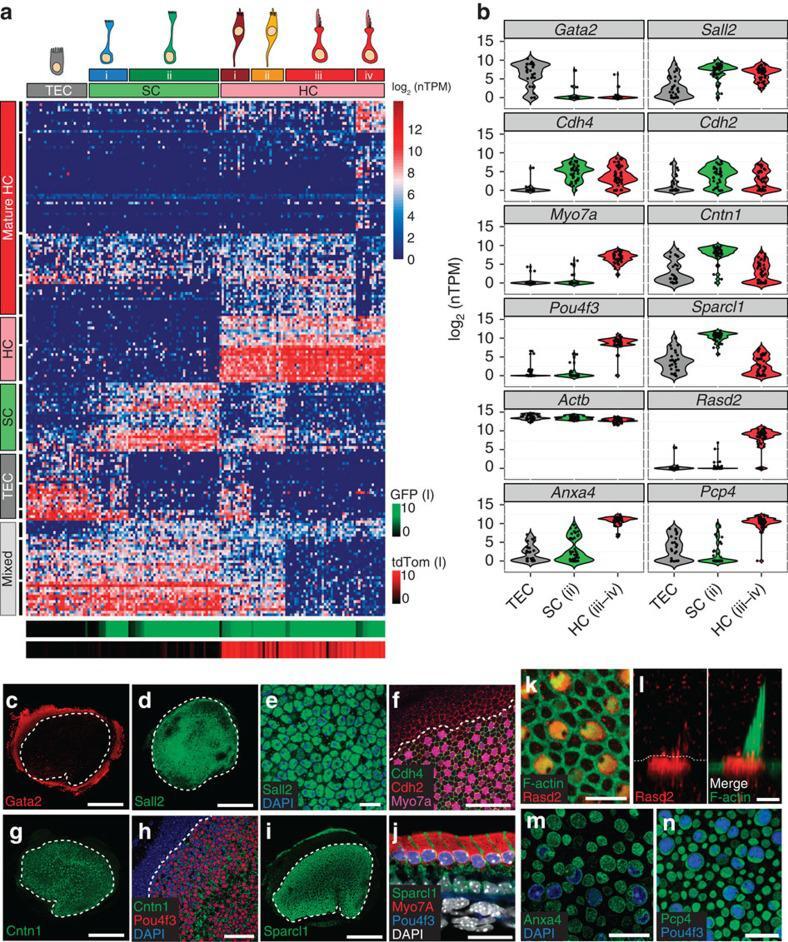
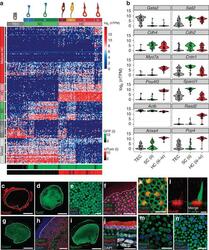
- Figure 2 Single-cell RNA-Seq identifies unique cell types and novel markers in the newborn mouse utricle. ( a ) K -means clustering of 158 P1 utricle cells ( x axis) using the top 195 genes ( y axis) identified with PCA. The gap statistic, an unbiased estimate of the total number of clusters, identified seven distinct clusters. On the basis of expression of known marker genes and fluorescence state (bottom x -axis bars and right legends, displayed on log 2 scale), each cluster was assigned to one of the three known cell types (top x -axis bars): TECs (grey), SCs (light green) and HCs (light red). TECs comprise one cluster, whereas SCs and HCs comprise two (SC.i-ii) and four (HC.i-iv) clusters, respectively. Genes were also divided by k -means (black bars indicate 15 clusters identified by gap statistic) and pooled based on cell type, HC maturity or variation across multiple cell types (Mixed). The Mixed group consists of two gene clusters expressed in non-HCs and one small cluster restricted to SCs and HCs. ( b ) Violin plots for representative genes identified as differentially expressed (FDR