Explore
 Validate
 Learn
Learn Western blot
 Immunocytochemistry
Antibody data
- Antibody Data
- Antigen structure
- References [5]
- Comments [0]
- Validations
- Immunocytochemistry [3]
- Other assay [5]
Submit
Validation data
Reference
Comment
Report error
- Product number
- 14-5643-37 - Provider product page

- Provider
- Invitrogen Antibodies
- Product name
- Myogenin Monoclonal Antibody (F5D), eBioscience™
- Antibody type
- Monoclonal
- Antigen
- Other
- Description
- Description: This F5D monoclonal antibody reacts with human, mouse, dog, and rat myogenin, a 34-kDa transcription factor. Expressed in skeletal and heart muscle, myogenin is a member of the MyoD family of basic-helix-loop-helix proteins, which also includes MyoD, Myf5, and MRF4. This transcription factor interacts with other helix-loop-helix proteins, which may or may not be muscle-specific. Myogenin plays a significant role in myogenic differentiation, even directing nonmuscle cells to the myogenic lineage. Transforming growth factor-beta (TGFb) and bone morphogenetic protein-2 (BMP2) inhibit myogenin transcriptional activity. Predominantly residing within the nucleus, the subcellular localization of myogenin has been shown to be dependent on differentiation status and cell density. For instance, trafficking of myogenin between the nucleus and cytoplasm has been reported during skeletal muscle differentiation to mediate transcription control. Applications Reported: This F5D antibody has been reported for use in immunoblotting (WB) and immunocytochemistry. Applications Tested: This F5D antibody has been tested by western blot and immunocytochemistry of the C2C12 cell line. This can be used at less than or equal to 1-5 µg/mL for both applications. It is recommended that the antibody be carefully titrated for optimal performance in the assay of interest. Purity: Greater than 90%, as determined by SDS-PAGE. Aggregation: Less than 10%, as determined by HPLC. Filtration: 0.2 µm post-manufacturing filtered.
- Reactivity
- Human, Mouse, Rat, Canine
- Host
- Mouse
- Isotype
- IgG
- Antibody clone number
- F5D
- Vial size
- 2 mg
- Concentration
- 0.5 mg/mL
- Storage
- 4°C
Submitted references Evaluation of Myogenin and MyoD1 as Immunohistochemical Markers of Canine Rhabdomyosarcoma.
PUFA Treatment Affects C2C12 Myocyte Differentiation, Myogenesis Related Genes and Energy Metabolism.
Janus effect of glucocorticoids on differentiation of muscle fibro/adipogenic progenitors.
Group I Paks support muscle regeneration and counteract cancer-associated muscle atrophy.
Regulation of myoblast differentiation by metabolic perturbations induced by metformin.
Tuohy JL, Byer BJ, Royer S, Keller C, Nagai-Singer MA, Regan DP, Seguin B
Veterinary pathology 2021 May;58(3):516-526
Veterinary pathology 2021 May;58(3):516-526
PUFA Treatment Affects C2C12 Myocyte Differentiation, Myogenesis Related Genes and Energy Metabolism.
Risha MA, Siengdee P, Dannenberger D, Wimmers K, Ponsuksili S
Genes 2021 Jan 28;12(2)
Genes 2021 Jan 28;12(2)
Janus effect of glucocorticoids on differentiation of muscle fibro/adipogenic progenitors.
Cerquone Perpetuini A, Giuliani G, Reggio A, Cerretani M, Santoriello M, Stefanelli R, Palma A, Vumbaca S, Harper S, Castagnoli L, Bresciani A, Cesareni G
Scientific reports 2020 Mar 24;10(1):5363
Scientific reports 2020 Mar 24;10(1):5363
Group I Paks support muscle regeneration and counteract cancer-associated muscle atrophy.
Cerquone Perpetuini A, Re Cecconi AD, Chiappa M, Martinelli GB, Fuoco C, Desiderio G, Castagnoli L, Gargioli C, Piccirillo R, Cesareni G
Journal of cachexia, sarcopenia and muscle 2018 Aug;9(4):727-746
Journal of cachexia, sarcopenia and muscle 2018 Aug;9(4):727-746
Regulation of myoblast differentiation by metabolic perturbations induced by metformin.
Pavlidou T, Rosina M, Fuoco C, Gerini G, Gargioli C, Castagnoli L, Cesareni G
PloS one 2017;12(8):e0182475
PloS one 2017;12(8):e0182475
No comments: Submit comment
Supportive validation
- Submitted by
- Invitrogen Antibodies (provider)
- Main image

- Experimental details
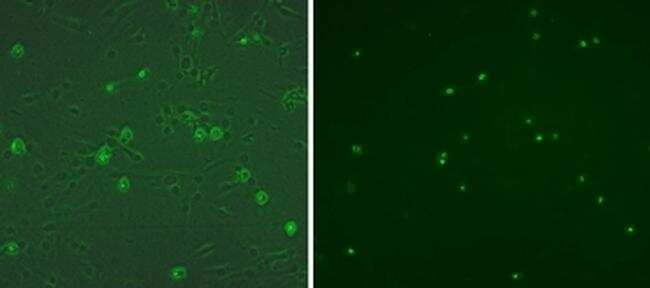
- Immunocytochemistry of fixed and permeabilized C2C12 cell line using 1 µg/mL of Anti-Myogenin Purified antibody followed by Anti-Mouse IgG FITC (Product # 11-4011-85) (right). Phase/fluorescence overlay (left).
- Submitted by
- Invitrogen Antibodies (provider)
- Main image
- Experimental details
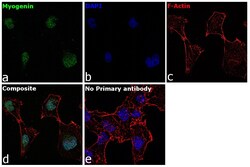
- Immunofluorescence analysis of Myogenin was performed using 70% confluent log phase RD cells. The cells were fixed with 4% paraformaldehyde for 10 minutes, permeabilized with 0.1% Triton™ X-100 for 15 minutes, and blocked with 2% BSA for 1 hour at room temperature. The cells were labeled with Myogenin Mouse Monoclonal Antibody (F5D) (Product # 14-5643-82) at 5 µg/mL in 0.1% BSA, incubated at 4 degree Celsius overnight and then with Goat anti-Mouse IgG (H+L) Superclonal™ Recombinant Secondary Antibody, Alexa Fluor® 488 conjugate (Product # A28175) at a dilution of 1:2000 for 45 minutes at room temperature (Panel a: green). Nuclei (Panel b: blue) were stained with ProLong™ Diamond Antifade Mountant with DAPI (Product # P36962). F-actin (Panel c: red) was stained with Rhodamine Phalloidin (Product # R415, 1:300). Panel d represents the merged image showing nuclear localization. Panel e represents control cells with no primary antibody to assess background. The images were captured at 60X magnification.
- Submitted by
- Invitrogen Antibodies (provider)
- Main image

- Experimental details
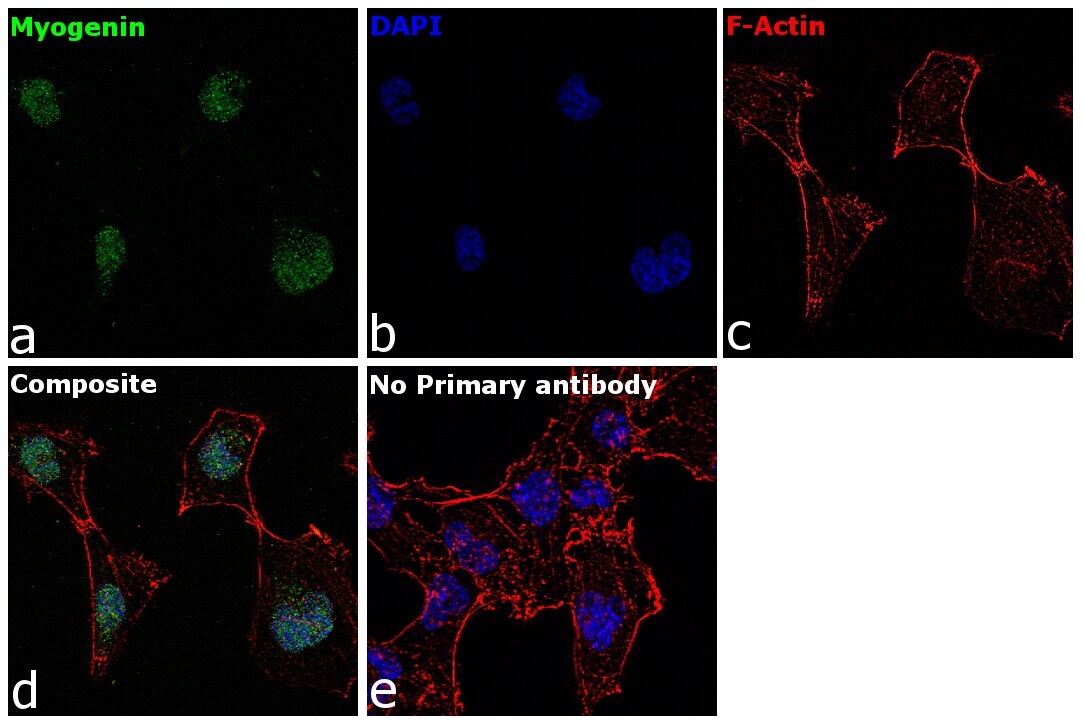
- Immunofluorescence analysis of Myogenin was performed using 70% confluent log phase RD cells. The cells were fixed with 4% paraformaldehyde for 10 minutes, permeabilized with 0.1% Triton™ X-100 for 15 minutes, and blocked with 2% BSA for 1 hour at room temperature. The cells were labeled with Myogenin Mouse Monoclonal Antibody (F5D) (Product # 14-5643-82) at 5 µg/mL in 0.1% BSA, incubated at 4 degree Celsius overnight and then with Goat anti-Mouse IgG (H+L) Superclonal™ Recombinant Secondary Antibody, Alexa Fluor® 488 conjugate (Product # A28175) at a dilution of 1:2000 for 45 minutes at room temperature (Panel a: green). Nuclei (Panel b: blue) were stained with ProLong™ Diamond Antifade Mountant with DAPI (Product # P36962). F-actin (Panel c: red) was stained with Rhodamine Phalloidin (Product # R415, 1:300). Panel d represents the merged image showing nuclear localization. Panel e represents control cells with no primary antibody to assess background. The images were captured at 60X magnification.

Supportive validation
- Submitted by
- Invitrogen Antibodies (provider)
- Main image
- Experimental details
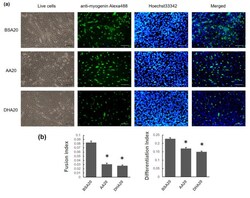
- Figure 3 The effect of 20 muM PUFA on C2C12 myotubes formation. ( a ) Immunofluorescence staining using Anti-Myogenin Alexa Fluor (r) 488 and Hoechst 33342 staining on C2C12 myotubes at day 2 (d2) of the treatment. Scale bar for live cells is 100 mum, Scale bar for anti-myogenin Alexa488, Hoechst 33342 staining and merged is 200muM. ( b ) Quantification of differentiation index and fusion index are shown. The mRNA level of myogenesis markers at three time points (d2 (2 days treatment), d4 (2 days treatment plus 2 days recovery), d8 (2 days treatment plus 6 days recovery)) was showed. ( c ) At d2, Myf5 expression level was induced in both AA20 and DHA20 treatments. MyoG expression level was significantly decreased in DHA20 treatment. MyoD1 expression level was decreased in AA20 treatment. The expression of Myf6 significantly decreased at d4 in DHA20, and significantly decreased in both AA20 and DHA20 at d8. ( d ) The expression levels of Myh1 significantly decreased at d2, d4 and d8 in DHA20 and in AA20 at d8. The expression levels of Myh2 significantly increased in d4 and d8 in AA20 and significantly decreased in DHA20 at d8. The expression levels of Myh4 significantly decreased at d4 in DHA20 and in both AA20 and DHA20 at d8. All values are LS means +- SEM, + indicate p < 0.1 and * indicates p < 0.05 treatment vs. control group BSA20.

- Submitted by
- Invitrogen Antibodies (provider)
- Main image
- Experimental details
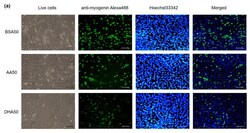
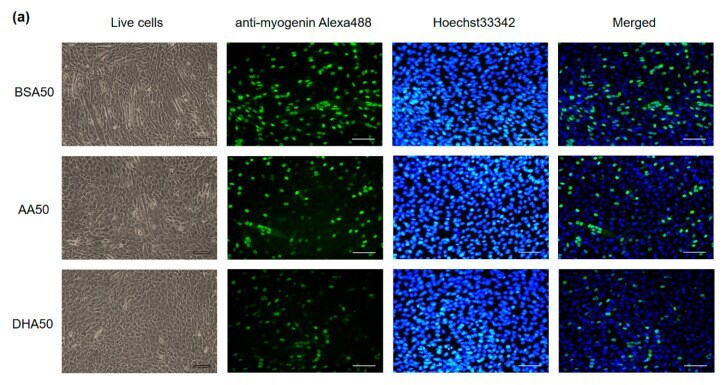
- Figure 4 The effect of 50 muM PUFA on C2C12 myotubes formation. ( a ) Immunofluorescence staining using Anti-Myogenin Alexa Fluor (r) 488 and Hoechst 33342 staining on C2C12 myotubes at day 2 (d2) of the treatment. Scale bar for live cells is 100 mum, Scale bar for anti-myogenin Alexa488, Hoechst 33342 staining and merged is 200 muM. ( b ) Quantification of differentiation index and fusion index are shown. The mRNA level of myogenesis markers at three time points (d2 (2 days treatment), d4 (2 days treatment plus 2 days recovery), d8 (2 days treatment plus 6 days recovery)) was shown. ( c ) At d2, Myf5 expression level was induced in both AA50 and DHA50 treatment. MyoG expression level was significantly decreased in both AA50 and DHA50 treatment. MyoD1 expression level was significantly decreased in AA50 and DHA50 treatments. The expression level of Myf6 was significantly increased in DHA50 at d2 and decreased at d4, but significantly decreased in both AA50 and DHA50 at d8. ( d ) The expression level of Myh1 was significantly decreased in d2, d4 and d8 in DHA50, also significantly decreased in AA50 at d4. The expression level of Myh2 was significantly increased in AA50 and significantly decreased in DHA50 at d8. The expression levels of Myh4 significantly decreased at d4 and d8 in both AA50 and DHA50. All values are LS means +- SEM, + indicate p < 0.1 and * indicates p < 0.05 treatment vs. control group BSA50.
- Submitted by
- Invitrogen Antibodies (provider)
- Main image
- Experimental details
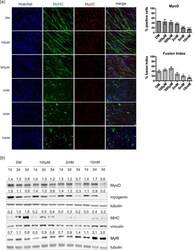
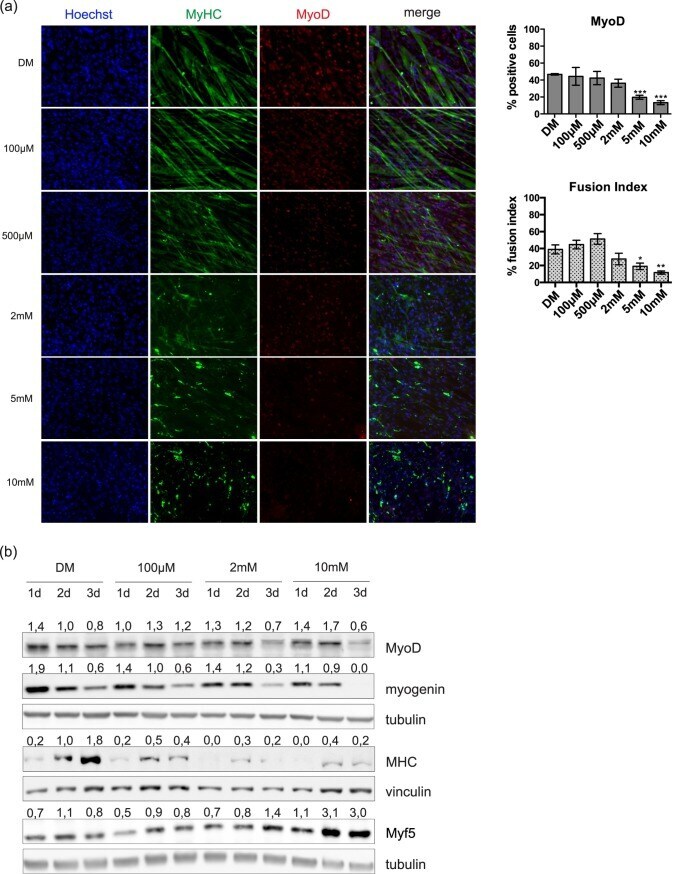
- Fig 2 Metformin inhibits myogenic differentiation of C2C12 cells in a dose-dependent manner. (a) Immunofluorescence microscopy for the expression of the myogenic markers Myosin Heavy Chain (MHC) and MyoD. C2C12 induced to differentiate by serum deprivation in differentiation medium (DM) and treated for 3 days with different doses of metformin (100muM, 500muM, 2mM, 5mM and 10mM) were analyzed by immunofluorescence technique. The percentage of the cells positive for MyoD and the fusion index were determined using the Cell Profiler cell image analysis software. The fusion index was calculated as the % of the nuclei inside myotubes compared to the total number of nuclei. Only myotubes with at least three nuclei inside a continuous cell membrane were considered. Statistical significance was evaluated by the Student's t-test (*p
- Submitted by
- Invitrogen Antibodies (provider)
- Main image
- Experimental details
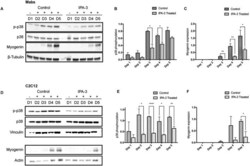
- Figure 6 IPA-3 treatment reduces p38 phosphorylation during Mabs and C2C12 differentiation. Representative western blot revealing total p38, p-p38, and myogenin expression in crude protein extracts from IPA-3 treated or control Mabs (A) and C2C12 (D) during 5 days of myogenic differentiation. beta-Tubulin, vinculin, or actin are used as loading controls. The bar graphs illustrate the ratio between p-p38 and total p38 signals during Mabs (B) or C2C12 (E) differentiation, as determined by the densitometric quantitation of western blots such as the one in panel A and D. The bar graphs represent the densitometric quantitation of myogenin expression for Mabs (C) and C2C12 (F) . The values are mean of at least three independent experiments + SEM. Statistical significance was evaluated by the unpaired t -test, * P

- Submitted by
- Invitrogen Antibodies (provider)
- Main image
- Experimental details
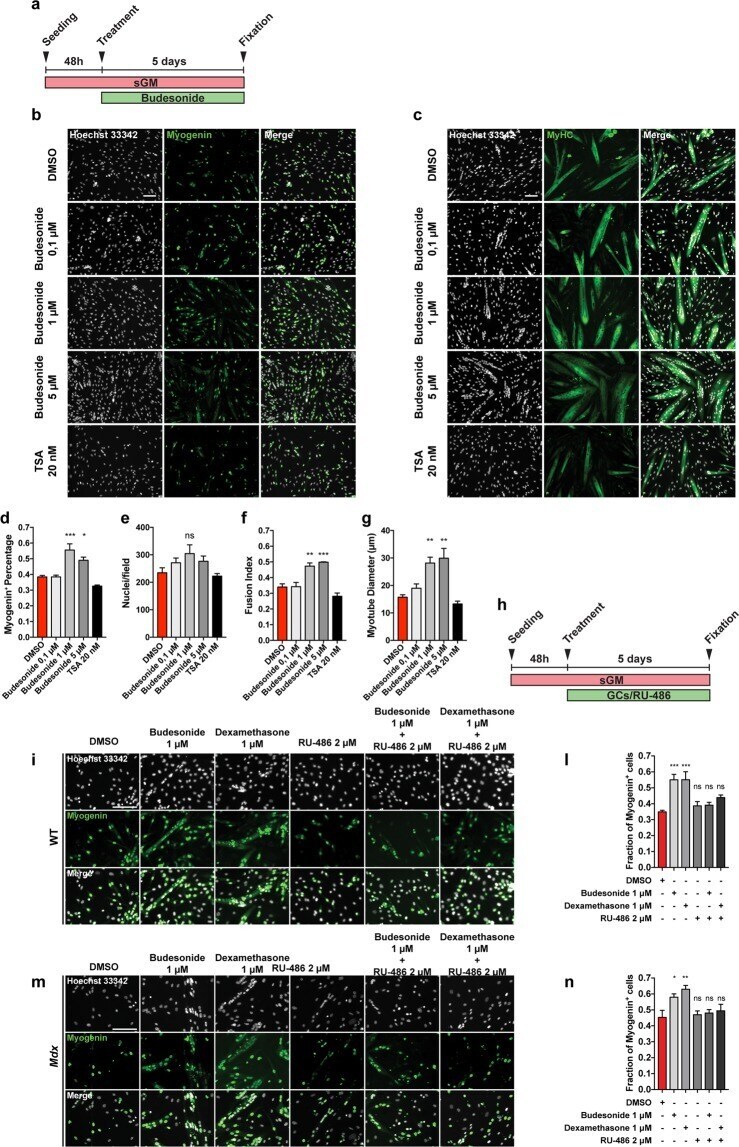
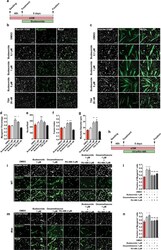
- Figure 3 Budesonide treatment promotes terminal differentiation of mdx satellite cells through the activation of GCr. ( a ) SCs were isolated from muscles of mdx mice as CD45-/CD31-/ITGA7 + cells and plated in sGM. 48 hours after plating, cells were treated with three concentrations of budesonide (0.1, 1 and 5 muM) or TSA (20 nm) for 5 additional days. Myogenic differentiation was assessed by immunostaining with antibodies against myogenin ( b ) and MyHC ( c ) as late muscle-specific differentiation markers. Nuclei were counterstained with Hoechst 33342. ( d ) Column chart showing the percentages of myogenin positive cells in the experiment in panel b. ( e ) Bar plot reporting the number of nuclei per field for the experiments in b and c. ( f,g ) Bar plots showing the fusion index and myotube diameter for the experiment in c. The values are mean of three independent experiments +- SEM (n = 3). Statistical significance was evaluated using one-way ANOVA (*p