Explore
 Validate
 Learn
LearnPA5-46262
antibody from Invitrogen Antibodies
Targeting: SPRTN
C1orf124, DKFZP547N043, DVC1, Spartan
 Western blot
 Other assay
Antibody data
- Antibody Data
- Antigen structure
- References [1]
- Comments [0]
- Validations
- Other assay [3]
Submit
Validation data
Reference
Comment
Report error
- Product number
- PA5-46262 - Provider product page

- Provider
- Invitrogen Antibodies
- Product name
- SPRTN Polyclonal Antibody
- Antibody type
- Polyclonal
- Antigen
- Synthetic peptide
- Description
- Peptide sequence: QIKSSGNDPK YSTTTAQNSS SSSSQSKMVN CPVCQNEVLE SQINEHLDWC Sequence homology: Human: 100%
- Reactivity
- Human
- Host
- Rabbit
- Isotype
- IgG
- Vial size
- 100 μL
- Concentration
- 0.5 mg/mL
- Storage
- -20°C, Avoid Freeze/Thaw Cycles
Submitted references USP11 mediates repair of DNA-protein cross-links by deubiquitinating SPRTN metalloprotease.
Perry M, Biegert M, Kollala SS, Mallard H, Su G, Kodavati M, Kreiling N, Holbrook A, Ghosal G
The Journal of biological chemistry 2021 Jan-Jun;296:100396
The Journal of biological chemistry 2021 Jan-Jun;296:100396
No comments: Submit comment
Supportive validation
- Submitted by
- Invitrogen Antibodies (provider)
- Main image
- Experimental details
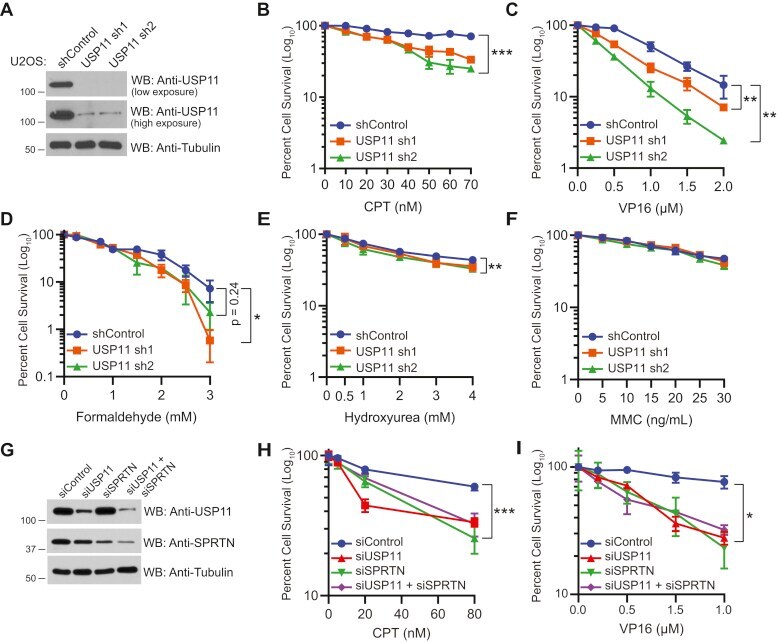
- Figure 4 USP11 is required for cell survival upon DNA damage by DPC-inducing agents. A , WB showing knockdown efficiency of USP11 in U2OS cells stably expressing nonsilencing shRNA control or two different shRNA sequences (sh1 and sh2) targeted to USP11. B - F , clonogenic cell survival curves for shRNA control and USP11 knockdown U2OS treated with indicated concentrations of ( B ) CPT for 24 h, ( C ) VP16 for 4 h, ( D ) formaldehyde for 20 min, ( E ) HU for 24 h, or ( F ) MMC for 24 h. G , WB showing knockdown efficiency of USP11 and SPRTN. H and I , clonogenic cell survival curves for USP11 and SPRTN single and double -knockdown cells treated with indicated concentrations of ( H ) CPT for 24 h or ( I ) VP16 for 2 h. B - F , H and I , percent cell survival was calculated. Data are presented as mean +- SD (n = 3). Statistical analysis: Two-tailed paired t -test was performed using confidence interval =90% and alpha = 0.1; * p
- Submitted by
- Invitrogen Antibodies (provider)
- Main image
- Experimental details
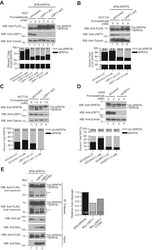
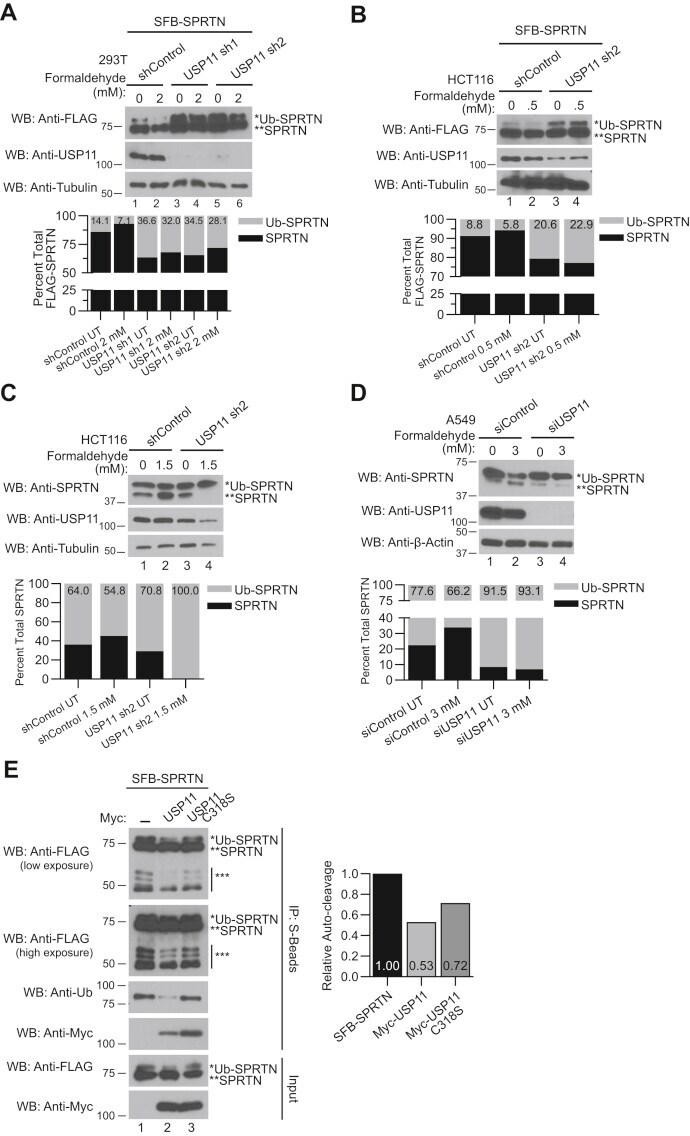
- Figure 5 USP11 deubiquitinates SPRTN upon DPC induction. A and B , HEK 293T ( A ) or HCT116 ( B ) cells stably expressing shRNA targeted to USP11 were transfected with SFB-SPRTN. Twenty-four hours later, cells were treated with the indicated concentrations of formaldehyde for 2 h. C , HCT116 cells stably expressing shRNA targeted to USP11 were treated with the indicated concentrations of formaldehyde for 1 h. The nuclear fraction was isolated and used for WB. D , A549 cells were transfected with siRNA targeted to USP11. Seventy-two hours later, cells were treated with the indicated concentrations of formaldehyde for 2 h. A - D , Top panel , cell lysates were immunoblotted with the indicated antibodies. Bottom panel , graph shows percent total FLAG-SPRTN or percent total SPRTN quantified from anti-FLAG or anti-SPRTN blots, respectively. The percent of unmodified and monoubiquitinated SPRTN was calculated. E , HEK 293T cells were transfected with SFB-SPRTN alone or in combination with Myc-USP11 FL or C318S mutant. Left panel , cell lysates were immunoprecipitated with S-protein agarose beads, and immunoblotting was performed using the indicated antibodies. Anti-Ub blot was probed with K63 ubiquitin antibody. Right panel , graph showing quantification of SFB-SPRTN auto-cleavage products. Anti-FLAG high exposure blot was used for quantification. WB, western blot. See also Figs. S4 , S5 , and S6 .
- Submitted by
- Invitrogen Antibodies (provider)
- Main image
- Experimental details
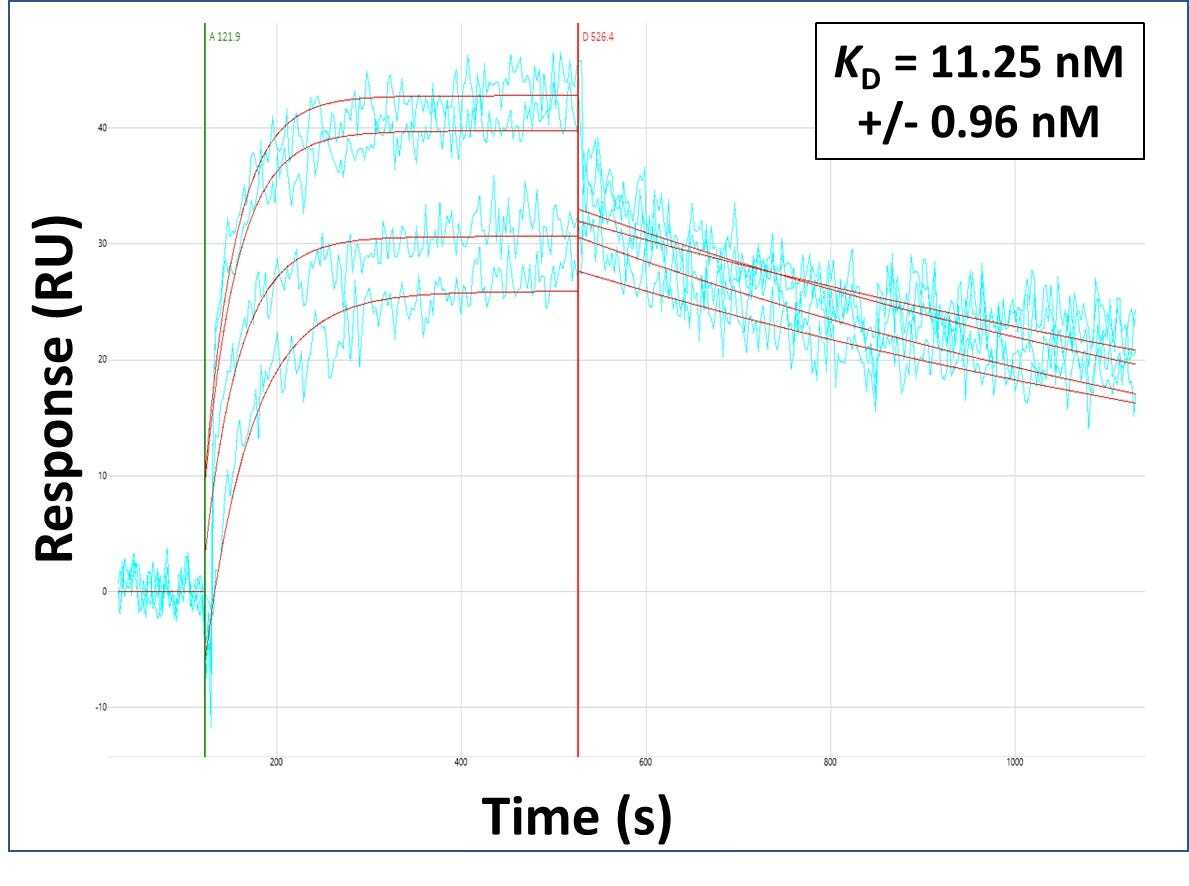
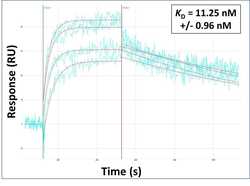
- Surface Plasmon Resonance of SPRTN polyclonal antibody (Product # PA5-46262). Purified polyclonal antibodies were immobilized on a Protein A/G coated Carterra LSA sensor chip at concentrations of 5, and 50 µg/mL in duplicate. Antibodies on the surface were exposed to interaction with peptides sequentially via microfluidic controlled flow at 333 nm peptide concentration for kinetic characterization of the binders for affinity and specificity, followed by curve fitting using the Kinetics software. Kd determinations for both concentrations were averaged and results and standard deviation are shown.