Explore
 Validate
 Learn
Learn Immunohistochemistry
Antibody data
- Antibody Data
- Antigen structure
- References [2]
- Comments [0]
- Validations
- Immunohistochemistry [4]
- Other assay [4]
Submit
Validation data
Reference
Comment
Report error
- Product number
- PA5-52521 - Provider product page

- Provider
- Invitrogen Antibodies
- Product name
- NGEF Polyclonal Antibody
- Antibody type
- Polyclonal
- Antigen
- Recombinant protein fragment
- Description
- Immunogen sequence: METRESEDLE KTRRKSASDQ WNTDNEPAKV KPELLPEKEE TSQADQDIQD KEPHCHIPIK RNSIFNRSIR RKSKAKARDN PERNASCLAD SQDNGKSVNE PLTLNIPWSR TPPCRTAMQT DPGAQEMSES SST Highest antigen sequence identity to the following orthologs: Mouse - 48%, Rat - 26%.
- Reactivity
- Human
- Host
- Rabbit
- Isotype
- IgG
- Vial size
- 100 μL
- Concentration
- 0.1 mg/mL
- Storage
- Store at 4°C short term. For long term storage, store at -20°C, avoiding freeze/thaw cycles.
Submitted references Interactions between EGFR and EphA2 promote tumorigenesis through the action of Ephexin1.
Akt-mediated Ephexin1-Ras interaction promotes oncogenic Ras signaling and colorectal and lung cancer cell proliferation.
Kim J, Chang IY, You HJ
Cell death & disease 2022 Jun 6;13(6):528
Cell death & disease 2022 Jun 6;13(6):528
Akt-mediated Ephexin1-Ras interaction promotes oncogenic Ras signaling and colorectal and lung cancer cell proliferation.
Kim J, Jeon YJ, Lim SC, Ryu J, Lee JH, Chang IY, You HJ
Cell death & disease 2021 Oct 28;12(11):1013
Cell death & disease 2021 Oct 28;12(11):1013
No comments: Submit comment
Supportive validation
- Submitted by
- Invitrogen Antibodies (provider)
- Main image
- Experimental details
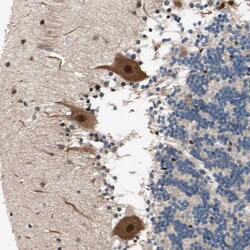
- Immunohistochemical analysis of NGEF in human Cerebellum using NGEF Polyclonal Antibody (Product # PA5-52521) shows strong cytoplasmic and nuclear positivity in Purkinje cells.
- Submitted by
- Invitrogen Antibodies (provider)
- Main image
- Experimental details
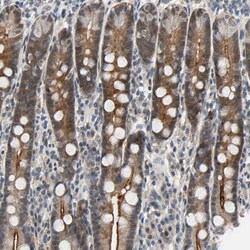
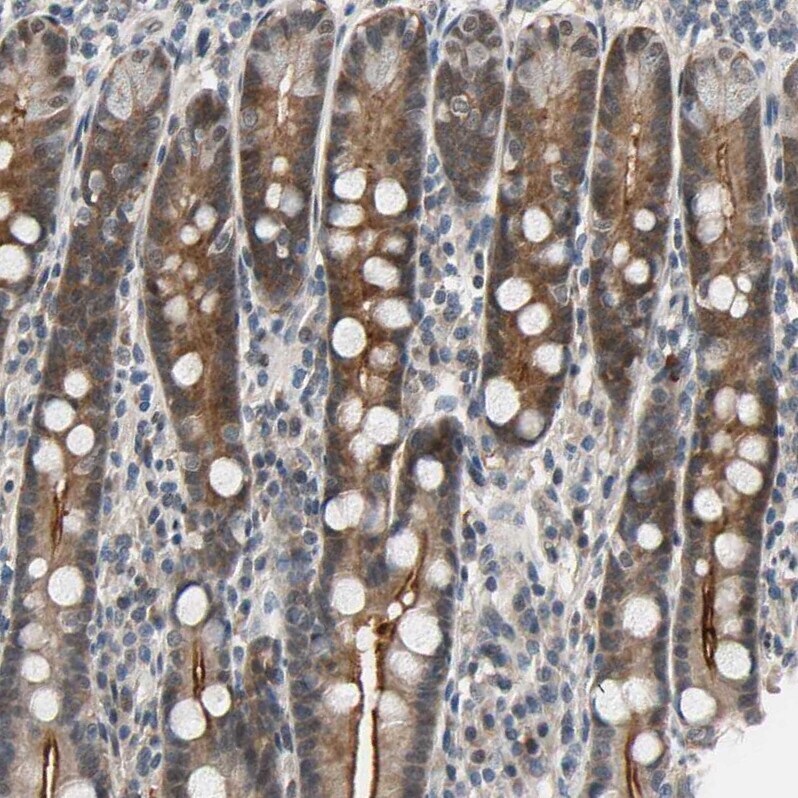
- Immunohistochemical analysis of NGEF in human Duodenum using NGEF Polyclonal Antibody (Product # PA5-52521) shows moderate cytoplasmic and membranous positivity in glandular cells.
- Submitted by
- Invitrogen Antibodies (provider)
- Main image
- Experimental details
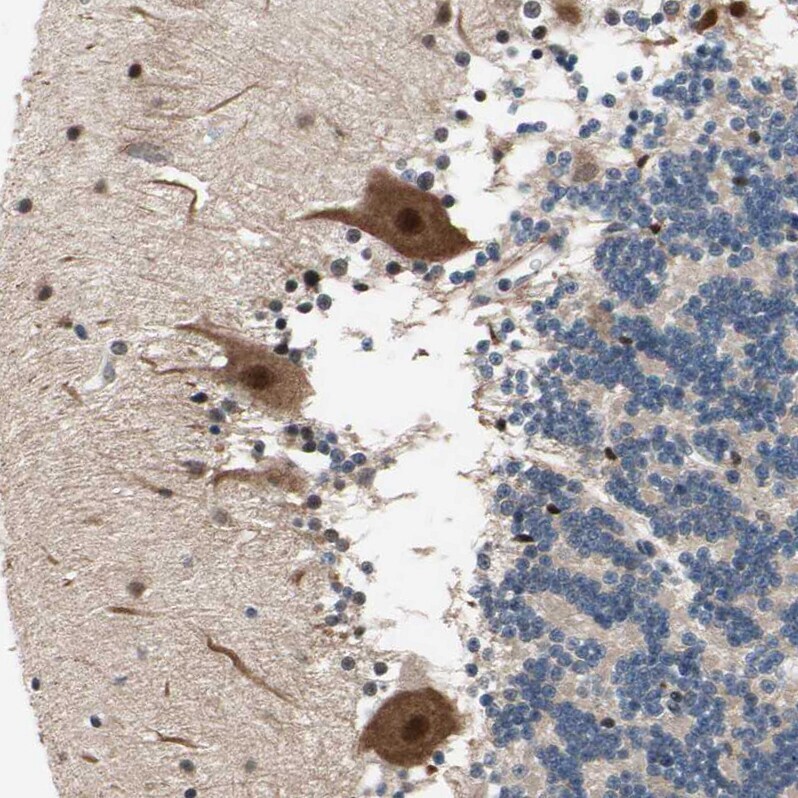
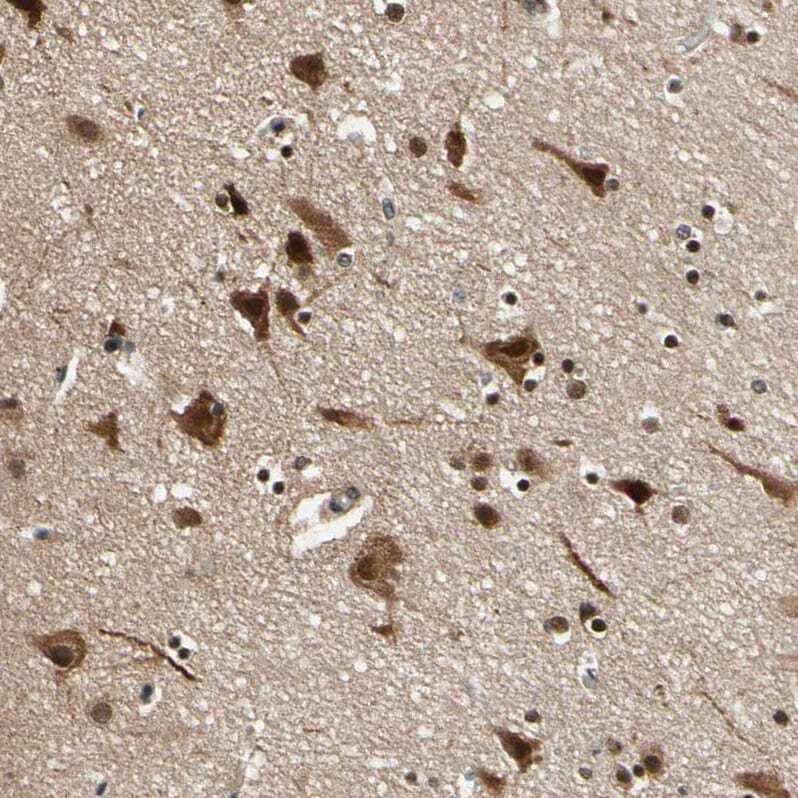
- Immunohistochemical analysis of NGEF in human Cerebral cortex using NGEF Polyclonal Antibody (Product # PA5-52521) shows strong cytoplasmic and nuclear positivity in neuronal cells.
- Submitted by
- Invitrogen Antibodies (provider)
- Main image
- Experimental details
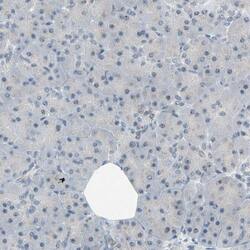
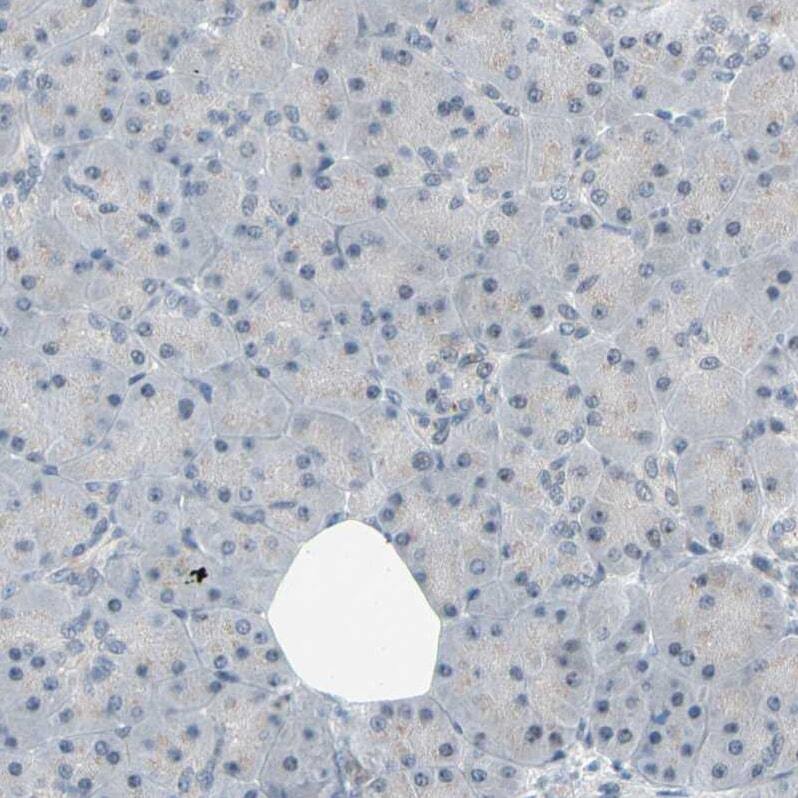
- Immunohistochemical analysis of NGEF in human Pancreas using NGEF Polyclonal Antibody (Product # PA5-52521) shows no cytoplasmic positivity in exocrine glandular cells as expected.
Supportive validation
- Submitted by
- Invitrogen Antibodies (provider)
- Main image

- Experimental details
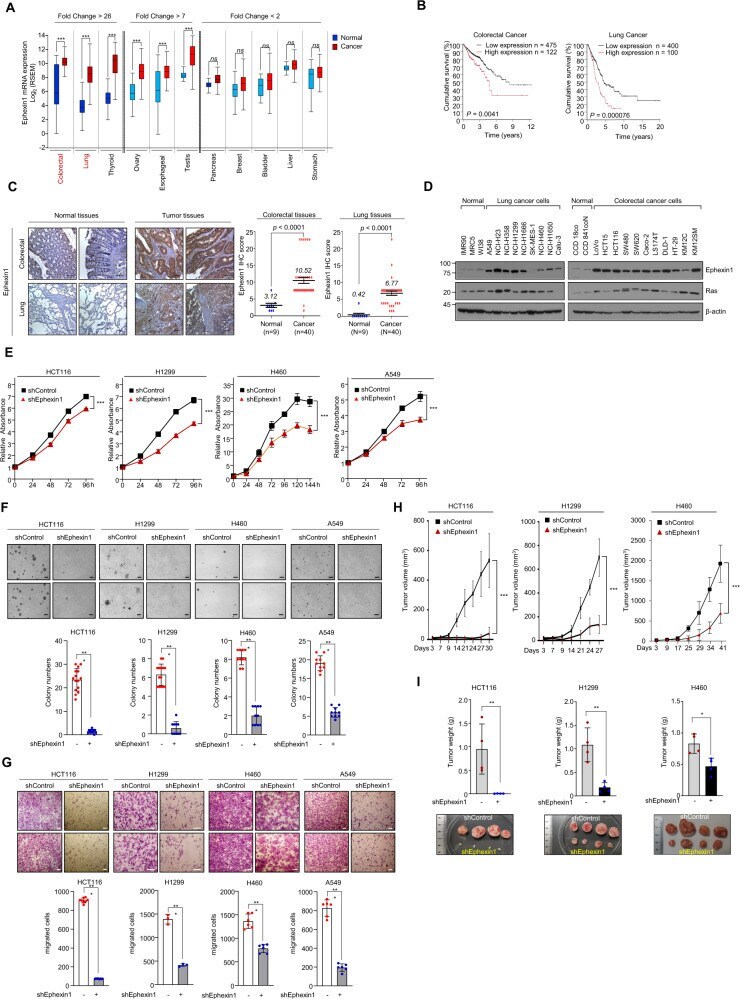
- Fig. 1 Ephexin1 is upregulated in CRC and LC and promotes tumor cell growth and proliferation. A Expression of Ephexin1 mRNA in 12 primary cancer types from TCGA. Data are shown as mean +- SD. ns not significant, *** P < 0.001, two-tailed Student's t test. B Kaplan-Meier analysis of overall survival according to Ephexin1 in CRC and LC patients. P values are for a log-rank test. C Immunohistochemistry (IHC) staining was performed to evaluate Ephexin1 expression in CRC and LC tissues and their corresponding normal tissues. Hematoxylin is the counterstain. Scale bar = 100 mum. Data are shown as mean +- SD, P values are for a two-way ANOVA. D Ephexin1 protein expression in normal and indicated colon ( n = 8) and lung ( n = 11) cancer cell lines were examined by western blot. E Effect of Ephexin1 knockdown on cell proliferation by MTT assay in HCT116, H1299, H460, and A549 cells. Data are shown as mean +- SD. *** P < 0.001, two-way ANOVA. F , G Anchorage-independent growth assessed by soft agar assay ( F ) and migration ability ( G ) determined by transwell assay in Ephexin1-depleted HCT116, H1299, H460, and A549 cells. Representative images are shown. Scale bar = 100 mum. Data are shown as mean +- SD. ** P < 0.01, and *** P < 0.001, two-tailed Student's t test. H Control and Ephexin1-depleted HCT116, H1299, and H460 cells were inoculated subcutaneously in BALB/C nude mice ( n = 4). Tumor volumes recoded at the indicated times are shown. Data are shown as mean +- SD. *** P < 0.001
- Submitted by
- Invitrogen Antibodies (provider)
- Main image
- Experimental details
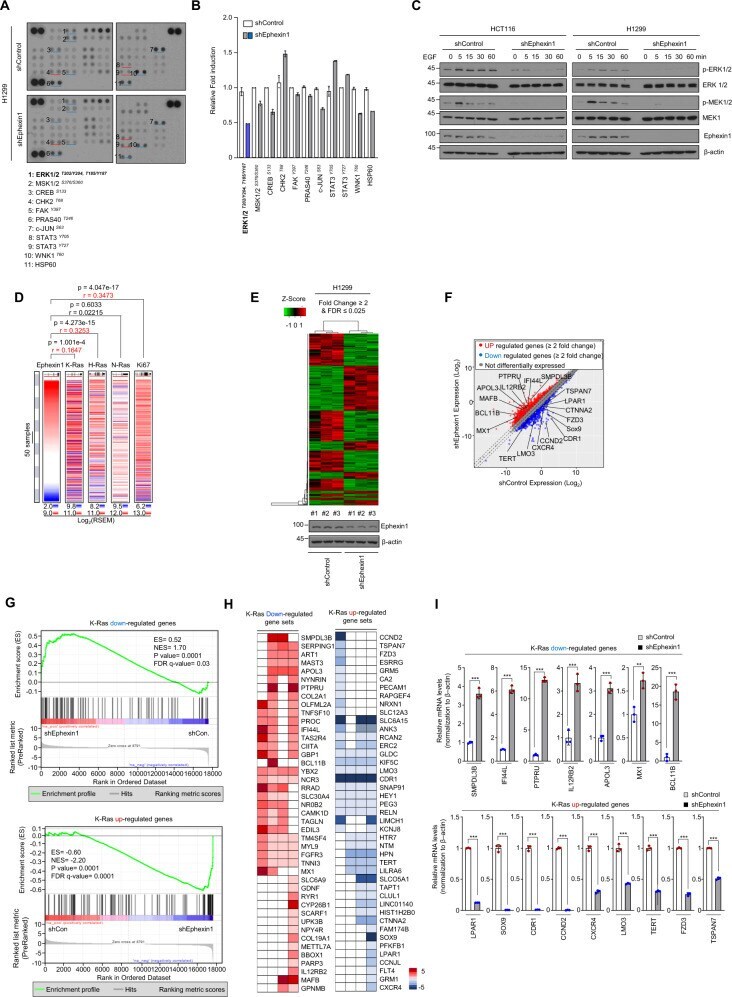
- Fig. 2 Ephexin1 enhances the MEK/ERK signaling pathway and regulates K-Ras-downstream target genes. A Whole-cell lysates from control or Ephexin1-depleted H1299 cells were incubated with human phosphokinase array membranes. Each pair of the most positive kinase dots is numbered with the identification of the corresponding kinase listed. B Levels of indicated protein kinases were quantified after normalized positive control. Error bars indicate mean +- SD of spots. C Western blot analysis to detect MEK/ERK activation in indicated cells treated with EGF for the indicated amounts of time after serum starvation. D The co-expression heat map of Ephexin1 with K-Ras, H-Ras, N-Ras, or Ki-67 in TCGA and GTEx ( n = 5151) derived from the UCSC Xena browser. E Heat map showing the differential expressed genes induced by Ephexin1 shRNA in H1299 cells. Red and green indicate high and low mRNA expression levels, respectively. F Scatter plot shows the differently expressed genes (FDR = 2) in Ephexin1-depleted H1299 cells compared with control cells. Compared to the control group (shControl), shEphexin1 downregulates 155 genes, whereas upregulates 227 genes expression levels. White circles highlight the position of the indicated K-Ras-downstream target genes. G Gene set enrichment analysis (GSEA) was used to identify K-Ras-downstream target genes differentially expressed between control and Ephexin1-depleted H1299 cells. H Heatmap of Ras-target genes downregulate
- Submitted by
- Invitrogen Antibodies (provider)
- Main image
- Experimental details
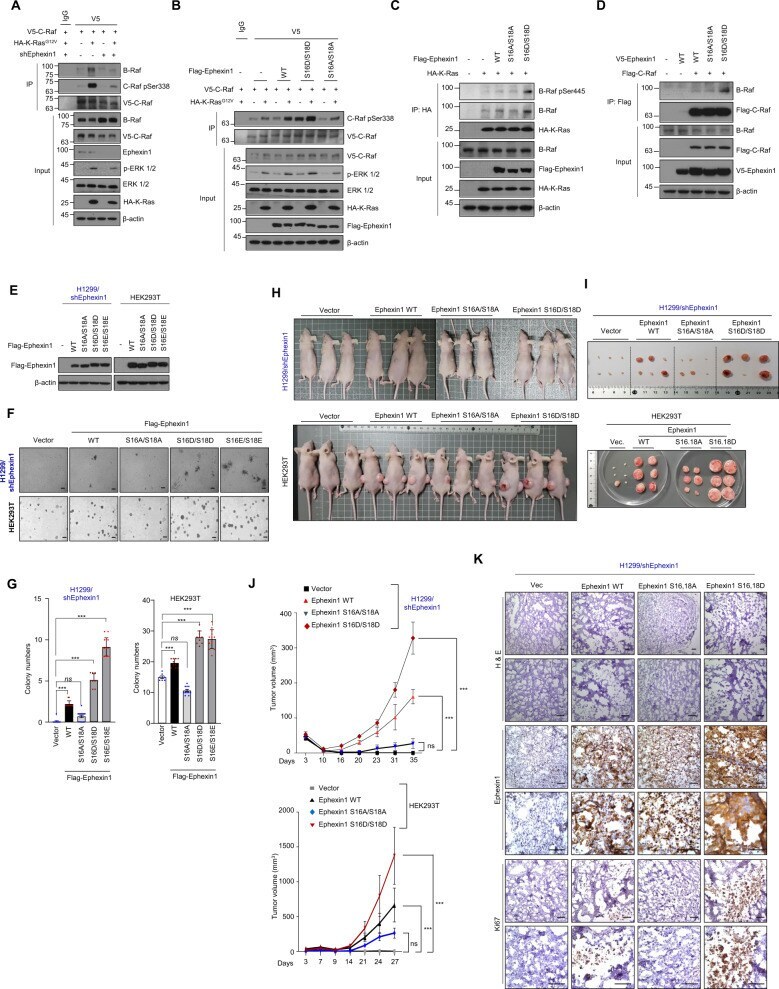
- Fig. 5 Phosphorylation of Ephexin1 at Ser16/18 promotes tumor cell growth and proliferation. A Lysates from control and Ephexin1-depleted HEK293T cells transfected with V5-tagged C-Raf along with or without HA-tagged K-Ras G12V were immunoprecipitated with anti-V5 antibody and subjected to western blot analysis with indicated antibodies. B Co-IP analysis was conducted in HEK293T cells cotransfected with V5-C-Raf and Flag-Ephexin1 (WT, S16D/S18D, or S16A/S18A) with or without HA-K-Ras G12V . Cell lysates were immunoprecipitated with anti-V5 antibody and subjected to western blot analysis with indicated antibodies. C Co-IP analysis was conducted in HEK293T cells cotransfected with WT HA-K-Ras and Flag-Ephexin1 (WT, S16A/S18A, or S16D/S18D). Cell lysates were immunoprecipitated with anti-HA antibody and subjected to western blot analysis with indicated antibodies. D Co-IP analysis was conducted in HEK293T cells cotransfected with Flag-C-Raf and V5-Ephexin1 (WT, S16A/S18A, or S16D/S18D). Cell lysates were immunoprecipitated with anti-Flag antibody and subjected to western blot analysis with indicated antibodies. E Western blot analysis for Ephexin1 expression in indicated Ephexin1-depleted H1299 and HEK293T cells. F Anchorage-independent growth assessed by soft agar assay in Ephexin1-depleted H1299 cells transfected with Flag-tagged WT or mutant Ephexin1 (top) or in HEK293T cells transfected Flag-tagged WT or mutant Ephexin1 (bottom). Representative images are shown. Scale bar =
- Submitted by
- Invitrogen Antibodies (provider)
- Main image

- Experimental details
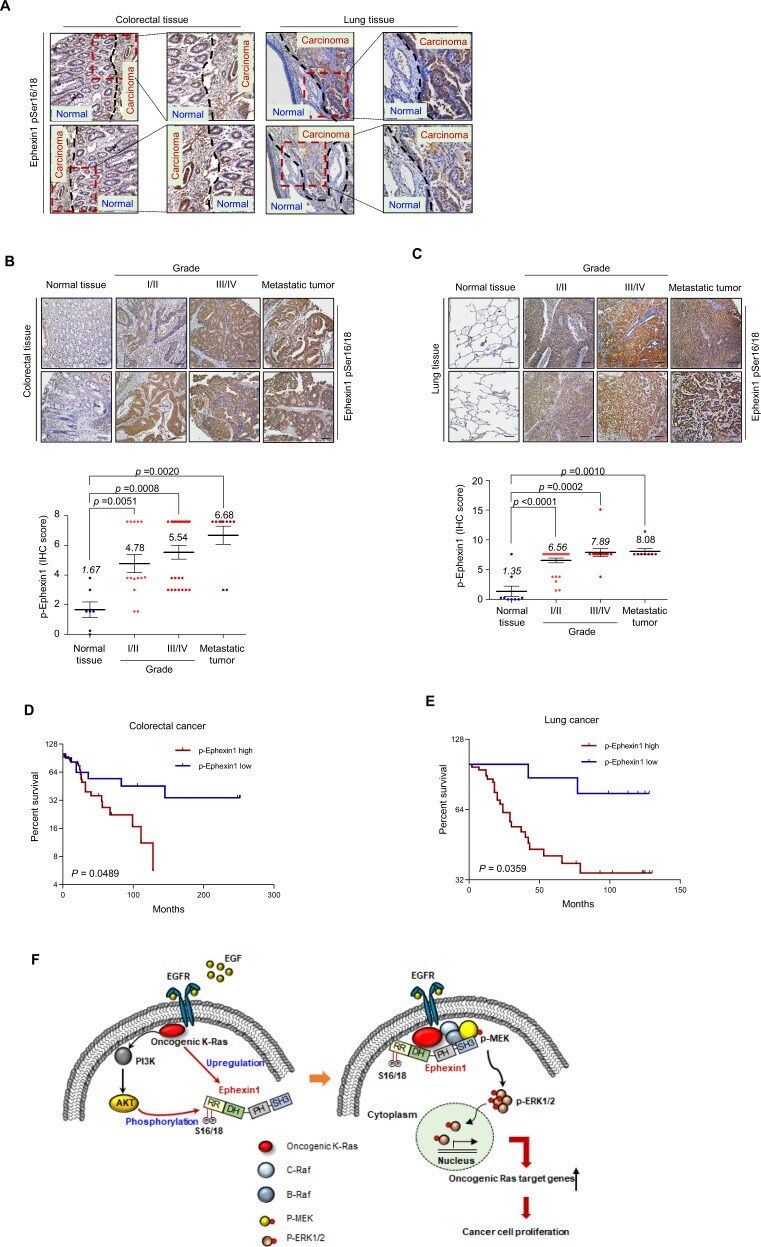
- Fig. 6 Ephexin1 is phosphorylated at Ser16/18 in human CRC and LC tissues and is associated with poor prognoses. A Representative image of pSer16/18 Ephexin1 immunoreactivity in normal and cancerous colorectal and lung tissues (separated by dashed lines). B , C IHC staining was performed to evaluate pSer16/18 Ephexin1 expression in normal, grade I/II, grade III/IV, and metastatic CRC ( B ) and LC ( C ) tissues and their corresponding normal tissues. Hematoxylin is the counterstain. Scale bar = 100 mum. Expression scores of pSer16/18 Ephexin1 in CRC tissue microarray (TMA) that was containing 9 cases of normal mucosa tissues, 14 cases grade I/II, 26 cases grade III/IV, and 10 cases of metastatic tumor tissues. Expression scores of pSer16/18 Ephexin1 in LC TMA that was containing 9 cases of normal mucosa tissues, 27 cases grade I/II, 13 cases grade III/IV, and 10 cases of metastatic tumor tissues. Data are shown as mean +- SD, P values are for a Mann-Whitney test. D A Kaplan-Meier graph representing overall survival rates for patients with pSer16/18 Ephexin1-overexpressing CRC. High pSer16/18 Ephexin1 expression, n = 33; low pSer16/18 Ephexin1 expression, n = 12. P values are for a log-rank test. E As in ( D ) but for LC. High pSer16/18 Ephexin1 expression, n = 42; low pSer16/18 Ephexin1 expression, n = 8. P values are for a log-rank test. F Schematic representation of a model for the major mechanism of the tumorigenic effect of Akt-mediated Ephexin1 phosphorylation on CRC and