Explore
 Validate
 Learn
Learn Western blot
 Flow cytometry
Antibody data
- Antibody Data
- Antigen structure
- References [5]
- Comments [0]
- Validations
- Flow cytometry [1]
- Other assay [3]
Submit
Validation data
Reference
Comment
Report error
- Product number
- 14-5875-37 - Provider product page

- Provider
- Invitrogen Antibodies
- Product name
- CD357 (AITR/GITR) Monoclonal Antibody (eBioAITR), eBioscience™
- Antibody type
- Monoclonal
- Antigen
- Other
- Description
- Description: The monoclonal antibody reacts with human AITR, Activation Inducible TNFR family member, an approximately 25 kDa member of the TNFR superfamily. AITR mRNA is detected in lymph node, peripheral blood leukocytes and weakly in spleen. AITR mRNA expression was upregulated within 24 hour on PMA/ionomycin or PHA stimulated PBMC. At the protein level, AITR is expressed by a small population of activated PBMC. AITR associates with TRAF1, TRAF2 and TRAF3 and induces nuclear factor NF-kappaB activation via TRAF2. Recently TL6 (AITRL) has been reported as the ligand for AITR. Interaction of AITR with AITRL is important for cross-talk between T lymphocytes and endothelial cells. Applications Reported: This eBioAITR antibody has been reported for use in flow cytometric analysis, immunoblotting (WB), and ELISA. Applications Tested: This eBioAITR antibody has been tested by flow cytometric analysis of PHA-stimulated normal human peripheral blood cells. This can be used at less than or equal to 0.125 µg per test. A test is defined as the amount (µg) of antibody that will stain a cell sample in a final volume of 100 µL. Cell number should be determined empirically but can range from 10^5 to 10^8 cells/test. It is recommended that the antibody be carefully titrated for optimal performance in the assay of interest. Purity: Greater than 90%, as determined by SDS-PAGE. Aggregation: Less than 10%, as determined by HPLC. Filtration: 0.2 µm post-manufacturing filtered.
- Reactivity
- Human
- Host
- Mouse
- Isotype
- IgG
- Antibody clone number
- eBioAITR
- Vial size
- 2 mg
- Concentration
- 0.5 mg/mL
- Storage
- 4° C
Submitted references Immune rebound associates with a favorable clinical response to autologous HSCT in systemic sclerosis patients.
Follicular Regulatory CD8 T Cells Impair the Germinal Center Response in SIV and Ex Vivo HIV Infection.
CD103+ intraepithelial T cells in high-grade serous ovarian cancer are phenotypically diverse TCRαβ+ CD8αβ+ T cells that can be targeted for cancer immunotherapy.
HTLV-1 modulates the frequency and phenotype of FoxP3+CD4+ T cells in virus-infected individuals.
CD4(+) regulatory T cells in a cynomolgus macaque model of Mycobacterium tuberculosis infection.
Arruda LCM, Malmegrim KCR, Lima-Júnior JR, Clave E, Dias JBE, Moraes DA, Douay C, Fournier I, Moins-Teisserenc H, Alberdi AJ, Covas DT, Simões BP, Lansiaux P, Toubert A, Oliveira MC
Blood advances 2018 Jan 23;2(2):126-141
Blood advances 2018 Jan 23;2(2):126-141
Follicular Regulatory CD8 T Cells Impair the Germinal Center Response in SIV and Ex Vivo HIV Infection.
Miles B, Miller SM, Folkvord JM, Levy DN, Rakasz EG, Skinner PJ, Connick E
PLoS pathogens 2016 Oct;12(10):e1005924
PLoS pathogens 2016 Oct;12(10):e1005924
CD103+ intraepithelial T cells in high-grade serous ovarian cancer are phenotypically diverse TCRαβ+ CD8αβ+ T cells that can be targeted for cancer immunotherapy.
Komdeur FL, Wouters MC, Workel HH, Tijans AM, Terwindt AL, Brunekreeft KL, Plat A, Klip HG, Eggink FA, Leffers N, Helfrich W, Samplonius DF, Bremer E, Wisman GB, Daemen T, Duiker EW, Hollema H, Nijman HW, de Bruyn M
Oncotarget 2016 Nov 15;7(46):75130-75144
Oncotarget 2016 Nov 15;7(46):75130-75144
HTLV-1 modulates the frequency and phenotype of FoxP3+CD4+ T cells in virus-infected individuals.
Satou Y, Utsunomiya A, Tanabe J, Nakagawa M, Nosaka K, Matsuoka M
Retrovirology 2012 May 30;9:46
Retrovirology 2012 May 30;9:46
CD4(+) regulatory T cells in a cynomolgus macaque model of Mycobacterium tuberculosis infection.
Green AM, Mattila JT, Bigbee CL, Bongers KS, Lin PL, Flynn JL
The Journal of infectious diseases 2010 Aug 15;202(4):533-41
The Journal of infectious diseases 2010 Aug 15;202(4):533-41
No comments: Submit comment
Supportive validation
- Submitted by
- Invitrogen Antibodies (provider)
- Main image

- Experimental details
- Normal human peripheral blood cells were cultured for 3 days with PHA and stained with Mouse IgG1 k Isotype Control Purified (Product # 14-4714-82) (open histogram) or Anti-Human CD357 (AITR) Purified (filled histogram) followed by F (ab')2 Anti-Mouse IgG PE (Product # 12-4012).Total viable cells were used for analysis.

Supportive validation
- Submitted by
- Invitrogen Antibodies (provider)
- Main image
- Experimental details
- NULL
- Submitted by
- Invitrogen Antibodies (provider)
- Main image
- Experimental details
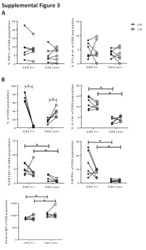
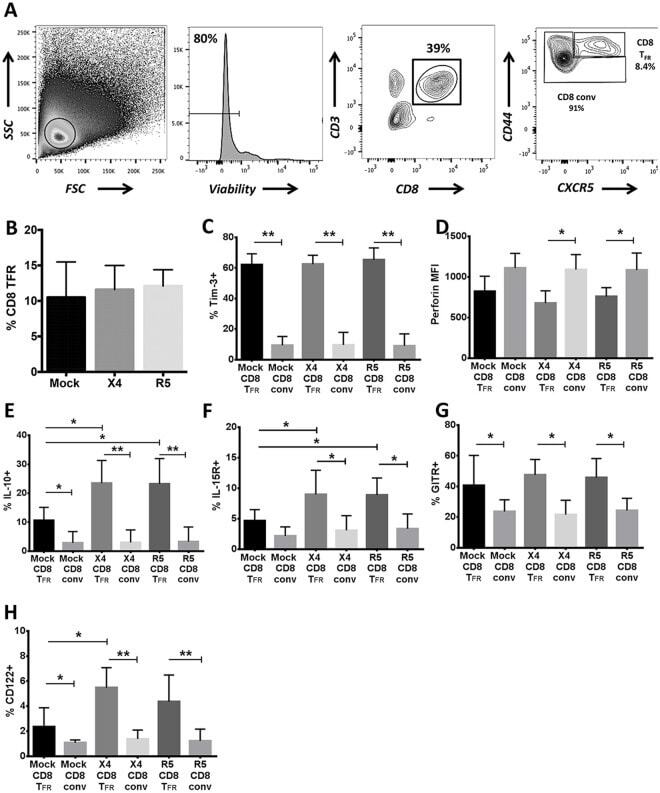
- Fig 1 Human tonsil CD8 T FR are distinct from conventional CD8 T cells. Disaggregated tonsil cell cultures were mock-spinoculated or spinoculated with X4- or R5-tropic HIV and cultured for 2 days (n = 8). (A) Flow gating strategy to determine viable, CD8 T FR (CD3+CD8+CXCR5 hi CD44 hi ) and all other CD3+CD8+ cells (CD8 conv). (B) The percentage of CD8 T FR in mock- or HIV-spinoculated samples. The percent or MFI of CD8 T FR and CD8 conv expressing (C) Tim-3, (D) perforin, (E) IL-10, (F) IL-15 receptor, (G) GITR, and (H) CD122 (IL-2Rbeta). Graphs depict median and range. Statistical significance was determined by non-parametric one-way ANOVA (Friedman test) and is displayed as * = p
- Submitted by
- Invitrogen Antibodies (provider)
- Main image
- Experimental details
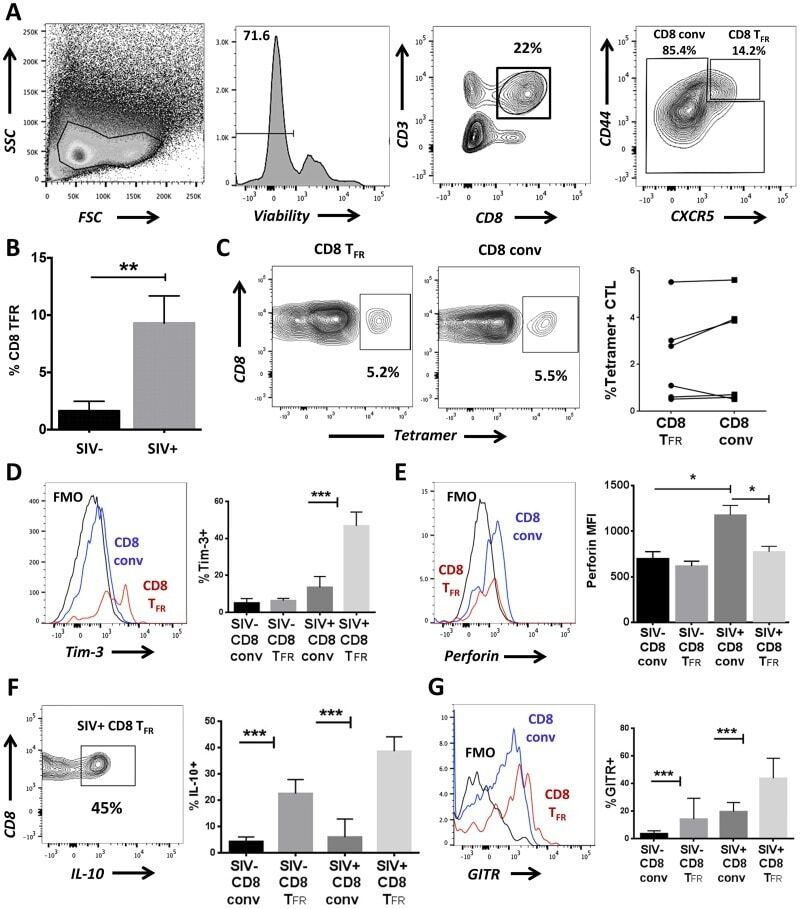
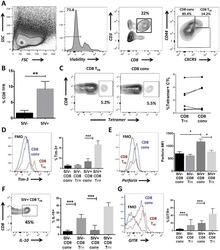
- Fig 6 CD8 T FR are higher in SIV-infected than uninfected rhesus macaques. Disaggregated cells from lymph nodes and spleen of SIV-uninfected (n = 6) and SIV-infected (n = 6) rhesus macaques were analyzed for CD8 T FR by flow cytometry. (A) Flow gating strategy to determine viable CD8 T FR (CD3+CD8+CXCR5 hi CD44 hi ) and CD8 conv. (B) Percent CD8 T FR in SIV-uninfected compared to SIV-infected rhesus macaques. (C) Percent of SIV-Gag tetramer+ CD8 T FR compared to CD8 conv. CD8 T FR and CD8 conv from SIV-uninfected and SIV-infected rhesus macaques were analyzed for percent or MFI expression of (D) Tim-3, (E) perforin, (F) IL-10, and (G) GITR. Graphs depict median and range. Statistical significance was determined by non-parametric one-way ANOVA (Friedman test) and is displayed as * = p