Explore
 Validate
 Learn
Learn13-1500
antibody from Invitrogen Antibodies
Targeting: MAP2
MAP2A, MAP2B, MAP2C
 Western blot
 ELISA
ELISA Immunocytochemistry Immunoprecipitation Immunohistochemistry Flow cytometry Other assay
Antibody data
- Antibody Data
- Antigen structure
- References [52]
- Comments [0]
- Validations
- Immunocytochemistry [4]
- Immunohistochemistry [1]
- Flow cytometry [1]
- Other assay [22]
Submit
Validation data
Reference
Comment
Report error
- Product number
- 13-1500 - Provider product page

- Provider
- Invitrogen Antibodies
- Product name
- MAP2 Monoclonal Antibody (M13)
- Antibody type
- Monoclonal
- Antigen
- Other
- Description
- This antibody reacts with a 300 kD cytoskeletal protein (MAP2A and MAP2B) primarily expressed in the somatodendritic domain of the neuron but is also found in the glia. Reactivity is not affected by phospohorylation state of MAP2. Abnormal expression of MAP2 may cause cytoskeletal abnormalities and impair signal transduction in dendrites. This antibody is suitable for immunohistochemical staining of alcohol-fixed paraffin embedded or frozen tissue sections.
- Reactivity
- Human, Mouse, Rat
- Host
- Mouse
- Isotype
- IgG
- Antibody clone number
- M13
- Vial size
- 100 μg
- Concentration
- 0.5 mg/mL
- Storage
- -20°C
Submitted references Transcriptome analyses of the cortex and white matter of focal cortical dysplasia type II: Insights into pathophysiology and tissue characterization.
Modelling host- Trypanosoma brucei gambiense interactions in vitro using human induced pluripotent stem cell-derived cortical brain organoids.
Neural fate commitment of rat full-term amniotic fluid stem cells via three-dimensional embryoid bodies and neurospheres formation.
Progranulin Protects against Hyperglycemia-Induced Neuronal Dysfunction through GSK3β Signaling.
Deletion of TRPC6, an Autism Risk Gene, Induces Hyperexcitability in Cortical Neurons Derived from Human Pluripotent Stem Cells.
Identifying cellular markers of focal cortical dysplasia type II with cell-type deconvolution and single-cell signatures.
Molecular and Functional Characterization of Different BrainSphere Models for Use in Neurotoxicity Testing on Microelectrode Arrays.
Progranulin Preserves Autophagy Flux and Mitochondrial Function in Rat Cortical Neurons Under High Glucose Stress.
Discovery of imidazole-based GSK-3β inhibitors for transdifferentiation of human mesenchymal stem cells to neurons: A potential single-molecule neurotherapeutic foresight.
CRISPR/dCas9-Dnmt3a-mediated targeted DNA methylation of APP rescues brain pathology in a mouse model of Alzheimer's disease.
Peptide functionalized DNA hydrogel enhances neuroblastoma cell growth and differentiation.
α-Synuclein fibrils explore actin-mediated macropinocytosis for cellular entry into model neuroblastoma neurons.
Differential Effects of the G-Protein-Coupled Estrogen Receptor (GPER) on Rat Embryonic (E18) Hippocampal and Cortical Neurons.
Bisphenol-A impairs synaptic formation and function by RGS4-mediated regulation of BDNF signaling in the cerebral cortex.
AAV9-NGLY1 gene replacement therapy improves phenotypic and biomarker endpoints in a rat model of NGLY1 Deficiency.
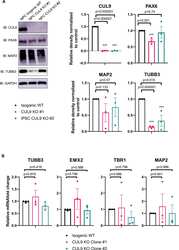
A proteomics approach for the identification of cullin-9 (CUL9) related signaling pathways in induced pluripotent stem cell models.
Schizophrenia-Linked Protein tSNARE1 Regulates Endosomal Trafficking in Cortical Neurons.
Small molecules efficiently reprogram apical papilla stem cells into neuron-like cells.
Environmentally relevant developmental methylmercury exposures alter neuronal differentiation in a human-induced pluripotent stem cell model.
Functional Expression of Choline Transporters in Human Neural Stem Cells and Its Link to Cell Proliferation, Cell Viability, and Neurite Outgrowth.
Hyperexcitability and Pharmacological Responsiveness of Cortical Neurons Derived from Human iPSCs Carrying Epilepsy-Associated Sodium Channel Nav1.2-L1342P Genetic Variant.
Bio-electrosprayed human neural stem cells are viable and maintain their differentiation potential.
Effect of a Bone Marrow-Derived Extracellular Matrix on Cell Adhesion and Neural Induction of Dental Pulp Stem Cells.
Human iPSC-Derived Neuronal Cells From CTBP1-Mutated Patients Reveal Altered Expression of Neurodevelopmental Gene Networks.
Inhibition of Hsp90 in the spinal cord enhances the antinociceptive effects of morphine by activating an ERK-RSK pathway.
CYLD is a causative gene for frontotemporal dementia - amyotrophic lateral sclerosis.
Kinin B1 Receptor Blockade Prevents Angiotensin II-induced Neuroinflammation and Oxidative Stress in Primary Hypothalamic Neurons.
Activation of Kinin B1R Upregulates ADAM17 and Results in ACE2 Shedding in Neurons.
In vitro Characteristics of Heterogeneous Equine Hoof Progenitor Cell Isolates.
Ultrastructural morphology is distinct among primary progenitor cell isolates from normal, inflamed, and cryopreserved equine hoof tissue and CD105(+)K14(+) progenitor cells.
Detecting Neurodevelopmental Toxicity of Domoic Acid and Ochratoxin A Using Rat Fetal Neural Stem Cells.
Identification and Massively Parallel Characterization of Regulatory Elements Driving Neural Induction.
Novel Positive Allosteric Modulators of Glutamate Transport Have Neuroprotective Properties in an in Vitro Excitotoxic Model.
Spontaneous Differentiation of Human Neural Stem Cells on Nanodiamonds.
Cotargeting Ephrin Receptor Tyrosine Kinases A2 and A3 in Cancer Stem Cells Reduces Growth of Recurrent Glioblastoma.
Temporal Profile of Microtubule-Associated Protein 2: A Novel Indicator of Diffuse Brain Injury Severity and Early Mortality after Brain Trauma.
Monoclonal antibodies from a patient with anti-NMDA receptor encephalitis.
Duration of simulated microgravity affects the differentiation of mesenchymal stem cells.
Transcription activator-like effector nuclease (TALEN)-mediated CLYBL targeting enables enhanced transgene expression and one-step generation of dual reporter human induced pluripotent stem cell (iPSC) and neural stem cell (NSC) lines.
Biocompatibility of nanostructured boron doped diamond for the attachment and proliferation of human neural stem cells.
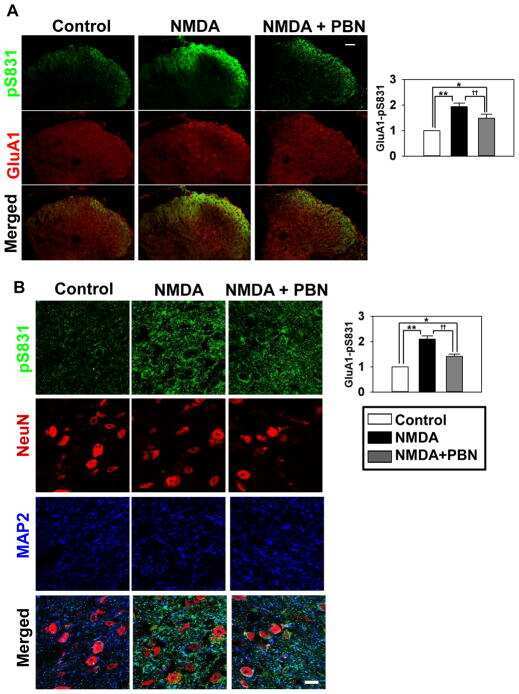
Reactive oxygen species (ROS) modulate AMPA receptor phosphorylation and cell-surface localization in concert with pain-related behavior.
Immunohistochemical analysis of developmental neural antigen expression in the balloon cells of focal cortical dysplasia.
Regional differentiation of retinoic acid-induced human pluripotent embryonic carcinoma stem cell neurons.
The difference in gliosis induced by β-amyloid and Tau treatments in astrocyte cultures derived from senescence accelerated and normal mouse strains.
Bcl-2 expression in a papillary tumor of the pineal region.
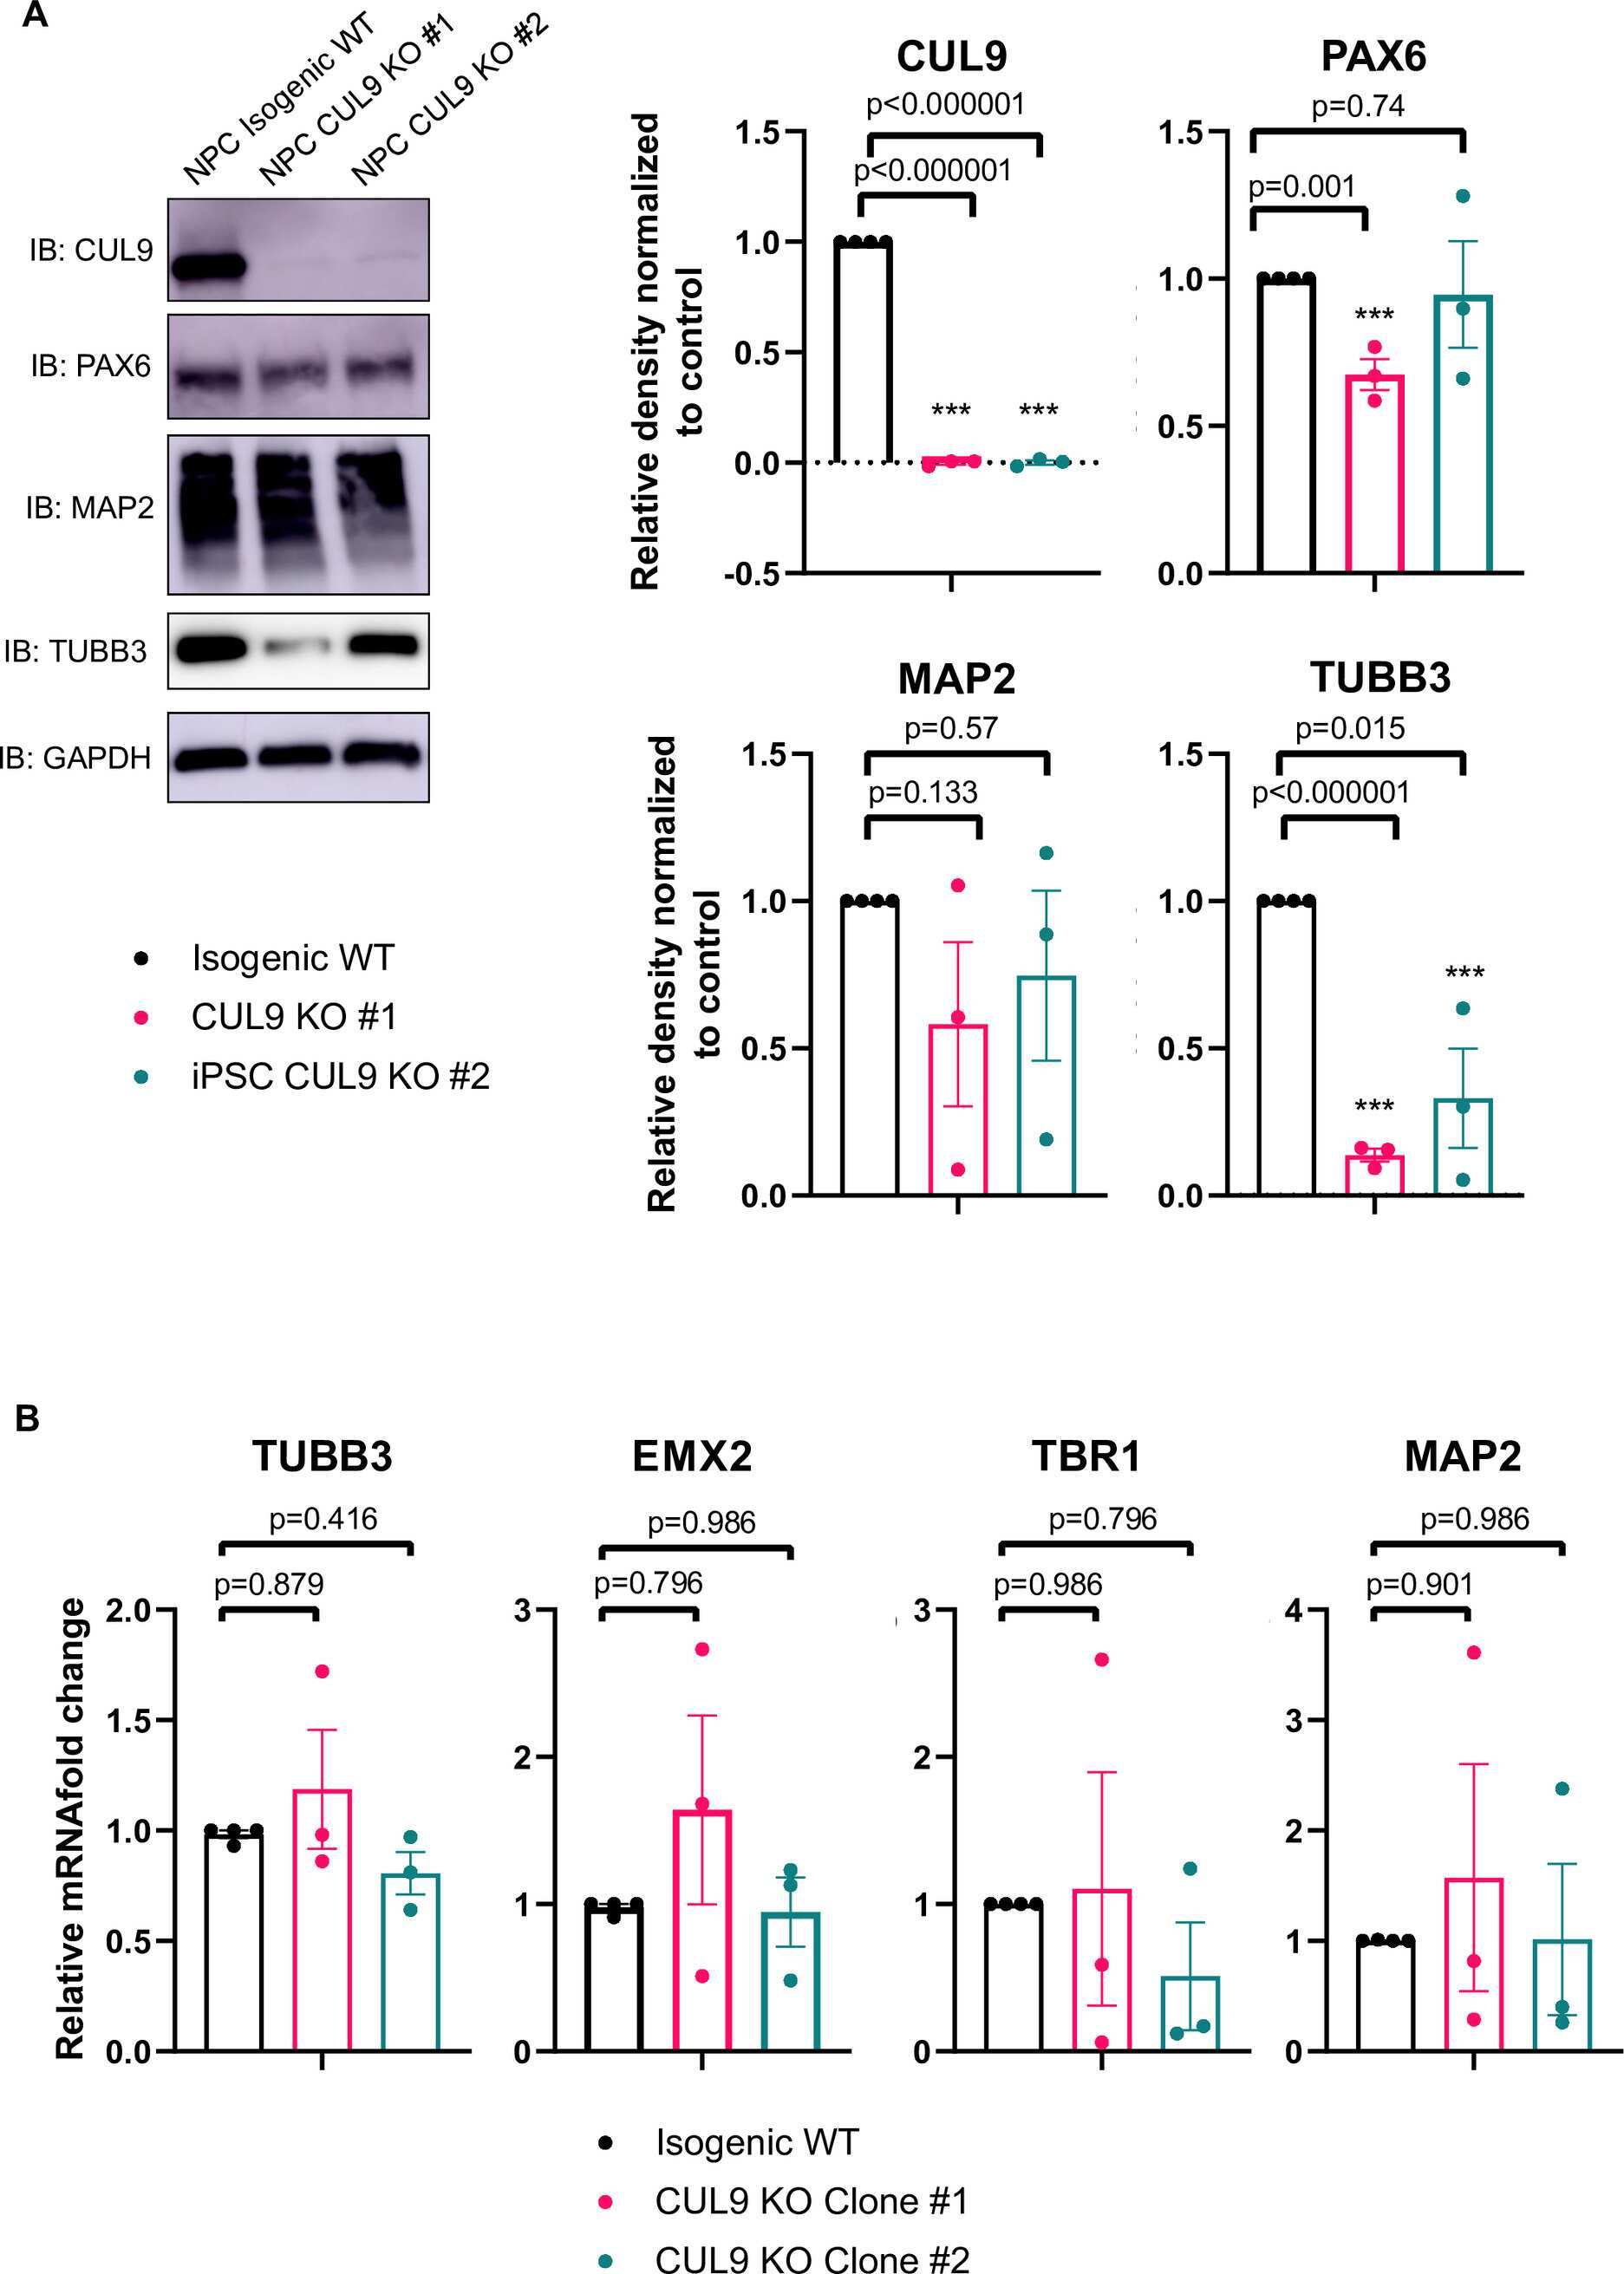
Chronic, low-dose rotenone reproduces Lewy neurites found in early stages of Parkinson's disease, reduces mitochondrial movement and slowly kills differentiated SH-SY5Y neural cells.
Neurofibrillary tangles may interfere with Smad 2/3 signaling in neurons.
Combination of hTERT and bmi-1, E6, or E7 induces prolongation of the life span of bone marrow stromal cells from an elderly donor without affecting their neurogenic potential.
Parkinson's disease transgenic mitochondrial cybrids generate Lewy inclusion bodies.
Parkinson's disease transgenic mitochondrial cybrids generate Lewy inclusion bodies.
Microtubule-associated protein 2 (MAP2) associates with the NMDA receptor and is spatially redistributed within rat hippocampal neurons after oxygen-glucose deprivation.
Abnormal expression of two microtubule-associated proteins (MAP2 and MAP5) in specific subfields of the hippocampal formation in schizophrenia.
Assis-Mendonça GR, Athié MCP, Tamanini JVG, de Souza A, Zanetti GG, Araújo PAORA, Ghizoni E, Tedeschi H, Alvim MKM, de Almeida VS, de Souza W, Coras R, Yasuda CL, Blümcke I, Vieira AS, Cendes F, Lopes-Cendes I, Rogerio F
Frontiers in neurology 2023;14:1023950
Frontiers in neurology 2023;14:1023950
Modelling host- Trypanosoma brucei gambiense interactions in vitro using human induced pluripotent stem cell-derived cortical brain organoids.
Chandrasegaran P, Nabilla Lestari A, Sinton MC, Gopalakrishnan J, Quintana JF
F1000Research 2023;12:437
F1000Research 2023;12:437
Neural fate commitment of rat full-term amniotic fluid stem cells via three-dimensional embryoid bodies and neurospheres formation.
Azmi N, Mustaffa Al Bakri SS, Khor W, Hamzah SN, Ferdaos N, Ling KH, Nordin N
IBRO neuroscience reports 2023 Jun;14:235-243
IBRO neuroscience reports 2023 Jun;14:235-243
Progranulin Protects against Hyperglycemia-Induced Neuronal Dysfunction through GSK3β Signaling.
Dedert C, Salih L, Xu F
Cells 2023 Jul 7;12(13)
Cells 2023 Jul 7;12(13)
Deletion of TRPC6, an Autism Risk Gene, Induces Hyperexcitability in Cortical Neurons Derived from Human Pluripotent Stem Cells.
Shin KC, Ali G, Ali Moussa HY, Gupta V, de la Fuente A, Kim HG, Stanton LW, Park Y
Molecular neurobiology 2023 Dec;60(12):7297-7308
Molecular neurobiology 2023 Dec;60(12):7297-7308
Identifying cellular markers of focal cortical dysplasia type II with cell-type deconvolution and single-cell signatures.
Galvão IC, Kandratavicius L, Messias LA, Athié MCP, Assis-Mendonça GR, Alvim MKM, Ghizoni E, Tedeschi H, Yasuda CL, Cendes F, Vieira AS, Rogerio F, Lopes-Cendes I, Veiga DFT
Scientific reports 2023 Aug 16;13(1):13321
Scientific reports 2023 Aug 16;13(1):13321
Molecular and Functional Characterization of Different BrainSphere Models for Use in Neurotoxicity Testing on Microelectrode Arrays.
Hartmann J, Henschel N, Bartmann K, Dönmez A, Brockerhoff G, Koch K, Fritsche E
Cells 2023 Apr 27;12(9)
Cells 2023 Apr 27;12(9)
Progranulin Preserves Autophagy Flux and Mitochondrial Function in Rat Cortical Neurons Under High Glucose Stress.
Dedert C, Mishra V, Aggarwal G, Nguyen AD, Xu F
Frontiers in cellular neuroscience 2022;16:874258
Frontiers in cellular neuroscience 2022;16:874258
Discovery of imidazole-based GSK-3β inhibitors for transdifferentiation of human mesenchymal stem cells to neurons: A potential single-molecule neurotherapeutic foresight.
Gupta V, Mahata T, Roy R, Gharai PK, Jana A, Garg S, Ghosh S
Frontiers in molecular neuroscience 2022;15:1002419
Frontiers in molecular neuroscience 2022;15:1002419
CRISPR/dCas9-Dnmt3a-mediated targeted DNA methylation of APP rescues brain pathology in a mouse model of Alzheimer's disease.
Park H, Shin J, Kim Y, Saito T, Saido TC, Kim J
Translational neurodegeneration 2022 Sep 15;11(1):41
Translational neurodegeneration 2022 Sep 15;11(1):41
Peptide functionalized DNA hydrogel enhances neuroblastoma cell growth and differentiation.
Hivare P, Gangrade A, Swarup G, Bhavsar K, Singh A, Gupta R, Thareja P, Gupta S, Bhatia D
Nanoscale 2022 Jun 23;14(24):8611-8620
Nanoscale 2022 Jun 23;14(24):8611-8620
α-Synuclein fibrils explore actin-mediated macropinocytosis for cellular entry into model neuroblastoma neurons.
Hivare P, Gadhavi J, Bhatia D, Gupta S
Traffic (Copenhagen, Denmark) 2022 Jul;23(7):391-410
Traffic (Copenhagen, Denmark) 2022 Jul;23(7):391-410
Differential Effects of the G-Protein-Coupled Estrogen Receptor (GPER) on Rat Embryonic (E18) Hippocampal and Cortical Neurons.
Pemberton K, Rosato M, Dedert C, DeLeon C, Arnatt C, Xu F
eNeuro 2022 Jul-Aug;9(4)
eNeuro 2022 Jul-Aug;9(4)
Bisphenol-A impairs synaptic formation and function by RGS4-mediated regulation of BDNF signaling in the cerebral cortex.
Hyun SA, Ko MY, Jang S, Lee BS, Rho J, Kim KK, Kim WY, Ka M
Disease models & mechanisms 2022 Jul 1;15(7)
Disease models & mechanisms 2022 Jul 1;15(7)
AAV9-NGLY1 gene replacement therapy improves phenotypic and biomarker endpoints in a rat model of NGLY1 Deficiency.
Zhu L, Tan B, Dwight SS, Beahm B, Wilsey M, Crawford BE, Schweighardt B, Cook JW, Wechsler T, Mueller WF
Molecular therapy. Methods & clinical development 2022 Dec 8;27:259-271
Molecular therapy. Methods & clinical development 2022 Dec 8;27:259-271
A proteomics approach for the identification of cullin-9 (CUL9) related signaling pathways in induced pluripotent stem cell models.
Ortolano NA, Romero-Morales AI, Rasmussen ML, Bodnya C, Kline LA, Joshi P, Connelly JP, Rose KL, Pruett-Miller SM, Gama V
PloS one 2021;16(3):e0248000
PloS one 2021;16(3):e0248000
Schizophrenia-Linked Protein tSNARE1 Regulates Endosomal Trafficking in Cortical Neurons.
Plooster M, Rossi G, Farrell MS, McAfee JC, Bell JL, Ye M, Diering GH, Won H, Gupton SL, Brennwald P
The Journal of neuroscience : the official journal of the Society for Neuroscience 2021 Nov 10;41(45):9466-9481
The Journal of neuroscience : the official journal of the Society for Neuroscience 2021 Nov 10;41(45):9466-9481
Small molecules efficiently reprogram apical papilla stem cells into neuron-like cells.
Chen Q, Yuan C, Jiang S, Heng BC, Zou T, Shen Z, Wang P, Zhang C
Experimental and therapeutic medicine 2021 Jun;21(6):546
Experimental and therapeutic medicine 2021 Jun;21(6):546
Environmentally relevant developmental methylmercury exposures alter neuronal differentiation in a human-induced pluripotent stem cell model.
Prince LM, Neely MD, Warren EB, Thomas MG, Henley MR, Smith KK, Aschner M, Bowman AB
Food and chemical toxicology : an international journal published for the British Industrial Biological Research Association 2021 Jun;152:112178
Food and chemical toxicology : an international journal published for the British Industrial Biological Research Association 2021 Jun;152:112178
Functional Expression of Choline Transporters in Human Neural Stem Cells and Its Link to Cell Proliferation, Cell Viability, and Neurite Outgrowth.
Fujita Y, Nagakura T, Uchino H, Inazu M, Yamanaka T
Cells 2021 Feb 20;10(2)
Cells 2021 Feb 20;10(2)
Hyperexcitability and Pharmacological Responsiveness of Cortical Neurons Derived from Human iPSCs Carrying Epilepsy-Associated Sodium Channel Nav1.2-L1342P Genetic Variant.
Que Z, Olivero-Acosta MI, Zhang J, Eaton M, Tukker AM, Chen X, Wu J, Xie J, Xiao T, Wettschurack K, Yunis L, Shafer JM, Schaber JA, Rochet JC, Bowman AB, Yuan C, Huang Z, Hu CD, Trader DJ, Skarnes WC, Yang Y
The Journal of neuroscience : the official journal of the Society for Neuroscience 2021 Dec 8;41(49):10194-10208
The Journal of neuroscience : the official journal of the Society for Neuroscience 2021 Dec 8;41(49):10194-10208
Bio-electrosprayed human neural stem cells are viable and maintain their differentiation potential.
Helenes González C, Jayasinghe SN, Ferretti P
F1000Research 2020;9:267
F1000Research 2020;9:267
Effect of a Bone Marrow-Derived Extracellular Matrix on Cell Adhesion and Neural Induction of Dental Pulp Stem Cells.
Laudani S, La Cognata V, Iemmolo R, Bonaventura G, Villaggio G, Saccone S, Barcellona ML, Cavallaro S, Sinatra F
Frontiers in cell and developmental biology 2020;8:100
Frontiers in cell and developmental biology 2020;8:100
Human iPSC-Derived Neuronal Cells From CTBP1-Mutated Patients Reveal Altered Expression of Neurodevelopmental Gene Networks.
Vijayalingam S, Ezekiel UR, Xu F, Subramanian T, Geerling E, Hoelscher B, San K, Ganapathy A, Pemberton K, Tycksen E, Pinto AK, Brien JD, Beck DB, Chung WK, Gurnett CA, Chinnadurai G
Frontiers in neuroscience 2020;14:562292
Frontiers in neuroscience 2020;14:562292
Inhibition of Hsp90 in the spinal cord enhances the antinociceptive effects of morphine by activating an ERK-RSK pathway.
Duron DI, Lei W, Barker NK, Stine C, Mishra S, Blagg BSJ, Langlais PR, Streicher JM
Science signaling 2020 May 5;13(630)
Science signaling 2020 May 5;13(630)
CYLD is a causative gene for frontotemporal dementia - amyotrophic lateral sclerosis.
Dobson-Stone C, Hallupp M, Shahheydari H, Ragagnin AMG, Chatterton Z, Carew-Jones F, Shepherd CE, Stefen H, Paric E, Fath T, Thompson EM, Blumbergs P, Short CL, Field CD, Panegyres PK, Hecker J, Nicholson G, Shaw AD, Fullerton JM, Luty AA, Schofield PR, Brooks WS, Rajan N, Bennett MF, Bahlo M, Landers JE, Piguet O, Hodges JR, Halliday GM, Topp SD, Smith BN, Shaw CE, McCann E, Fifita JA, Williams KL, Atkin JD, Blair IP, Kwok JB
Brain : a journal of neurology 2020 Mar 1;143(3):783-799
Brain : a journal of neurology 2020 Mar 1;143(3):783-799
Kinin B1 Receptor Blockade Prevents Angiotensin II-induced Neuroinflammation and Oxidative Stress in Primary Hypothalamic Neurons.
Parekh RU, Robidoux J, Sriramula S
Cellular and molecular neurobiology 2020 Jul;40(5):845-857
Cellular and molecular neurobiology 2020 Jul;40(5):845-857
Activation of Kinin B1R Upregulates ADAM17 and Results in ACE2 Shedding in Neurons.
Parekh RU, Sriramula S
International journal of molecular sciences 2020 Dec 25;22(1)
International journal of molecular sciences 2020 Dec 25;22(1)
In vitro Characteristics of Heterogeneous Equine Hoof Progenitor Cell Isolates.
Yang Q, Pinto VMR, Duan W, Paxton EE, Dessauer JH, Ryan W, Lopez MJ
Frontiers in bioengineering and biotechnology 2019;7:155
Frontiers in bioengineering and biotechnology 2019;7:155
Ultrastructural morphology is distinct among primary progenitor cell isolates from normal, inflamed, and cryopreserved equine hoof tissue and CD105(+)K14(+) progenitor cells.
Yang Q, Lopez MJ
In vitro cellular & developmental biology. Animal 2019 Sep;55(8):641-655
In vitro cellular & developmental biology. Animal 2019 Sep;55(8):641-655
Detecting Neurodevelopmental Toxicity of Domoic Acid and Ochratoxin A Using Rat Fetal Neural Stem Cells.
Gill S, Kumara VMR
Marine drugs 2019 Oct 4;17(10)
Marine drugs 2019 Oct 4;17(10)
Identification and Massively Parallel Characterization of Regulatory Elements Driving Neural Induction.
Inoue F, Kreimer A, Ashuach T, Ahituv N, Yosef N
Cell stem cell 2019 Nov 7;25(5):713-727.e10
Cell stem cell 2019 Nov 7;25(5):713-727.e10
Novel Positive Allosteric Modulators of Glutamate Transport Have Neuroprotective Properties in an in Vitro Excitotoxic Model.
Falcucci RM, Wertz R, Green JL, Meucci O, Salvino J, Fontana ACK
ACS chemical neuroscience 2019 Aug 21;10(8):3437-3453
ACS chemical neuroscience 2019 Aug 21;10(8):3437-3453
Spontaneous Differentiation of Human Neural Stem Cells on Nanodiamonds.
Taylor AC, González CH, Ferretti P, Jackman RB
Advanced biosystems 2019 Apr;3(4):e1800299
Advanced biosystems 2019 Apr;3(4):e1800299
Cotargeting Ephrin Receptor Tyrosine Kinases A2 and A3 in Cancer Stem Cells Reduces Growth of Recurrent Glioblastoma.
Qazi MA, Vora P, Venugopal C, Adams J, Singh M, Hu A, Gorelik M, Subapanditha MK, Savage N, Yang J, Chokshi C, London M, Gont A, Bobrowski D, Grinshtein N, Brown KR, Murty NK, Nilvebrant J, Kaplan D, Moffat J, Sidhu S, Singh SK
Cancer research 2018 Sep 1;78(17):5023-5037
Cancer research 2018 Sep 1;78(17):5023-5037
Temporal Profile of Microtubule-Associated Protein 2: A Novel Indicator of Diffuse Brain Injury Severity and Early Mortality after Brain Trauma.
Papa L, Robicsek SA, Brophy GM, Wang KKW, Hannay HJ, Heaton S, Schmalfuss I, Gabrielli A, Hayes RL, Robertson CS
Journal of neurotrauma 2018 Jan 1;35(1):32-40
Journal of neurotrauma 2018 Jan 1;35(1):32-40
Monoclonal antibodies from a patient with anti-NMDA receptor encephalitis.
Sharma R, Al-Saleem FH, Panzer J, Lee J, Puligedda RD, Felicori LF, Kattala CD, Rattelle AJ, Ippolito G, Cox RH, Lynch DR, Dessain SK
Annals of clinical and translational neurology 2018 Aug;5(8):935-951
Annals of clinical and translational neurology 2018 Aug;5(8):935-951
Duration of simulated microgravity affects the differentiation of mesenchymal stem cells.
Xue L, Li Y, Chen J
Molecular medicine reports 2017 May;15(5):3011-3018
Molecular medicine reports 2017 May;15(5):3011-3018
Transcription activator-like effector nuclease (TALEN)-mediated CLYBL targeting enables enhanced transgene expression and one-step generation of dual reporter human induced pluripotent stem cell (iPSC) and neural stem cell (NSC) lines.
Cerbini T, Funahashi R, Luo Y, Liu C, Park K, Rao M, Malik N, Zou J
PloS one 2015;10(1):e0116032
PloS one 2015;10(1):e0116032
Biocompatibility of nanostructured boron doped diamond for the attachment and proliferation of human neural stem cells.
Taylor AC, Vagaska B, Edgington R, Hébert C, Ferretti P, Bergonzo P, Jackman RB
Journal of neural engineering 2015 Dec;12(6):066016
Journal of neural engineering 2015 Dec;12(6):066016
Reactive oxygen species (ROS) modulate AMPA receptor phosphorylation and cell-surface localization in concert with pain-related behavior.
Lee DZ, Chung JM, Chung K, Kang MG
Pain 2012 Sep;153(9):1905-1915
Pain 2012 Sep;153(9):1905-1915
Immunohistochemical analysis of developmental neural antigen expression in the balloon cells of focal cortical dysplasia.
Han CW, Min BW, Kim Y, Jeong EH, Park CS, Woo YJ, Kim HS, Lee MC
Journal of clinical neuroscience : official journal of the Neurosurgical Society of Australasia 2011 Jan;18(1):114-8
Journal of clinical neuroscience : official journal of the Neurosurgical Society of Australasia 2011 Jan;18(1):114-8
Regional differentiation of retinoic acid-induced human pluripotent embryonic carcinoma stem cell neurons.
Coyle DE, Li J, Baccei M
PloS one 2011 Jan 20;6(1):e16174
PloS one 2011 Jan 20;6(1):e16174
The difference in gliosis induced by β-amyloid and Tau treatments in astrocyte cultures derived from senescence accelerated and normal mouse strains.
Lü L, Mak YT, Fang M, Yew DT
Biogerontology 2009 Dec;10(6):695-710
Biogerontology 2009 Dec;10(6):695-710
Bcl-2 expression in a papillary tumor of the pineal region.
Fèvre-Montange M, Grand S, Champier J, Hoffmann D, Pasquier B, Jouvet A
Neuropathology : official journal of the Japanese Society of Neuropathology 2008 Dec;28(6):660-3
Neuropathology : official journal of the Japanese Society of Neuropathology 2008 Dec;28(6):660-3
Chronic, low-dose rotenone reproduces Lewy neurites found in early stages of Parkinson's disease, reduces mitochondrial movement and slowly kills differentiated SH-SY5Y neural cells.
Borland MK, Trimmer PA, Rubinstein JD, Keeney PM, Mohanakumar K, Liu L, Bennett JP Jr
Molecular neurodegeneration 2008 Dec 29;3:21
Molecular neurodegeneration 2008 Dec 29;3:21
Neurofibrillary tangles may interfere with Smad 2/3 signaling in neurons.
Chalmers KA, Love S
Journal of neuropathology and experimental neurology 2007 Feb;66(2):158-67
Journal of neuropathology and experimental neurology 2007 Feb;66(2):158-67
Combination of hTERT and bmi-1, E6, or E7 induces prolongation of the life span of bone marrow stromal cells from an elderly donor without affecting their neurogenic potential.
Mori T, Kiyono T, Imabayashi H, Takeda Y, Tsuchiya K, Miyoshi S, Makino H, Matsumoto K, Saito H, Ogawa S, Sakamoto M, Hata J, Umezawa A
Molecular and cellular biology 2005 Jun;25(12):5183-95
Molecular and cellular biology 2005 Jun;25(12):5183-95
Parkinson's disease transgenic mitochondrial cybrids generate Lewy inclusion bodies.
Trimmer PA, Borland MK, Keeney PM, Bennett JP Jr, Parker WD Jr
Journal of neurochemistry 2004 Feb;88(4):800-12
Journal of neurochemistry 2004 Feb;88(4):800-12
Parkinson's disease transgenic mitochondrial cybrids generate Lewy inclusion bodies.
Trimmer PA, Borland MK, Keeney PM, Bennett JP Jr, Parker WD Jr
Journal of neurochemistry 2004 Feb;88(4):800-12
Journal of neurochemistry 2004 Feb;88(4):800-12
Microtubule-associated protein 2 (MAP2) associates with the NMDA receptor and is spatially redistributed within rat hippocampal neurons after oxygen-glucose deprivation.
Buddle M, Eberhardt E, Ciminello LH, Levin T, Wing R, DiPasquale K, Raley-Susman KM
Brain research 2003 Jul 18;978(1-2):38-50
Brain research 2003 Jul 18;978(1-2):38-50
Abnormal expression of two microtubule-associated proteins (MAP2 and MAP5) in specific subfields of the hippocampal formation in schizophrenia.
Arnold SE, Lee VM, Gur RE, Trojanowski JQ
Proceedings of the National Academy of Sciences of the United States of America 1991 Dec 1;88(23):10850-4
Proceedings of the National Academy of Sciences of the United States of America 1991 Dec 1;88(23):10850-4
No comments: Submit comment
Supportive validation
- Submitted by
- Invitrogen Antibodies (provider)
- Main image

- Experimental details
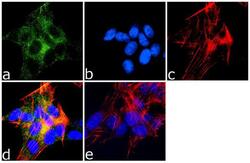
- Immunofluorescence analysis of MAP2 was done on 70% confluent log phase SH-SY5Y cells. The cells were fixed with 4% paraformaldehyde for 10 minutes, permeabilized with 0.1% Triton™ X-100 for 10 minutes, and blocked with 1% BSA for 1 hour at room temperature. The cells were labeled with MAP2 (M13) Mouse Monoclonal Antibody (Product # 13-1500) at 1:250 dilution in 0.1% BSA and incubated for 3 hours at room temperature and then labeled with Goat anti-Mouse IgG (H+L) Superclonal™ Secondary Antibody, Alexa Fluor® 488 conjugate (Product # A28175) at a dilution of 1:2000 for 45 minutes at room temperature (Panel a: green). Nuclei (Panel b: blue) were stained with SlowFade® Gold Antifade Mountant with DAPI (Product # S36938). F-actin (Panel c: red) was stained with Rhodamine Phalloidin (Product # R415, 1:300). Panel d is a merged image showing cytoplasmic localization. Panel e is a no primary antibody control. The images were captured at 60X magnification.

- Submitted by
- Invitrogen Antibodies (provider)
- Main image

- Experimental details
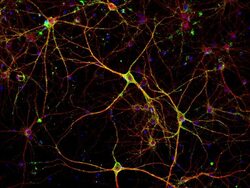
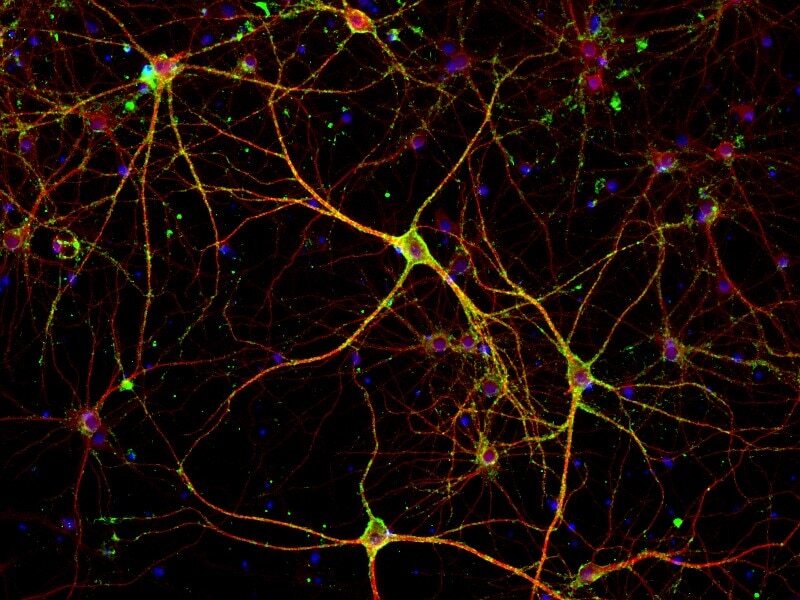
- Immunofluorescent analysis of PSD-95 (green) and MAP2 (red) on rat primary cortical neurons cultured for 28 days in the B-27 Plus Neuronal Culture System (Product # A3653401). At day 28 the cells were fixed with 4% paraformaldehyde for 15 min, permeabilized with 0.1% triton x-100 for 30min, and blocked with 1% BSA for 30 min at room temperature. Cells were stained with anti-PSD95 antibody (Product # 51-6900) at a dilution of 1:200, and anti-MAP2 (Product # 13-1500) at a dilution of 1:400, in 1% BSA staining buffer, overnight at 4C, and then incubated with Alexa Fluor 488 conjugated donkey anti-rabbit (Product # A-21206) and Alexa Fluor 594 donkey anti-mouse (Product # A-21203) antibodies at a dilution of 1:1000 for 30 min. at room temp. Wash 3 times with DPBS. Stain with DAPI for nucleus.

- Submitted by
- Invitrogen Antibodies (provider)
- Main image
- Experimental details
- Immunofluorescence analysis of MAP2 was done on 70% confluent log phase SH-SY5Y cells. The cells were fixed with 4% paraformaldehyde for 10 minutes, permeabilized with 0.1% Triton™ X-100 for 10 minutes, and blocked with 1% BSA for 1 hour at room temperature. The cells were labeled with MAP2 (M13) Mouse Monoclonal Antibody (Product # 13-1500) at 1:250 dilution in 0.1% BSA and incubated for 3 hours at room temperature and then labeled with Goat anti-Mouse IgG (H+L) Superclonal™ Secondary Antibody, Alexa Fluor® 488 conjugate (Product # A28175) at a dilution of 1:2000 for 45 minutes at room temperature (Panel a: green). Nuclei (Panel b: blue) were stained with SlowFade® Gold Antifade Mountant with DAPI (Product # S36938). F-actin (Panel c: red) was stained with Rhodamine Phalloidin (Product # R415, 1:300). Panel d is a merged image showing cytoplasmic localization. Panel e is a no primary antibody control. The images were captured at 60X magnification.

- Submitted by
- Invitrogen Antibodies (provider)
- Main image
- Experimental details
- Immunofluorescent analysis of PSD-95 (green) and MAP2 (red) on rat primary cortical neurons cultured for 28 days in the B-27 Plus Neuronal Culture System (Product # A3653401). At day 28 the cells were fixed with 4% paraformaldehyde for 15 min, permeabilized with 0.1% triton x-100 for 30min, and blocked with 1% BSA for 30 min at room temperature. Cells were stained with anti-PSD95 antibody (Product # 51-6900) at a dilution of 1:200, and anti-MAP2 (Product # 13-1500) at a dilution of 1:400, in 1% BSA staining buffer, overnight at 4C, and then incubated with Alexa Fluor 488 conjugated donkey anti-rabbit (Product # A-21206) and Alexa Fluor 594 donkey anti-mouse (Product # A-21203) antibodies at a dilution of 1:1000 for 30 min. at room temp. Wash 3 times with DPBS. Stain with DAPI for nucleus.
Supportive validation
- Submitted by
- Invitrogen Antibodies (provider)
- Main image

- Experimental details
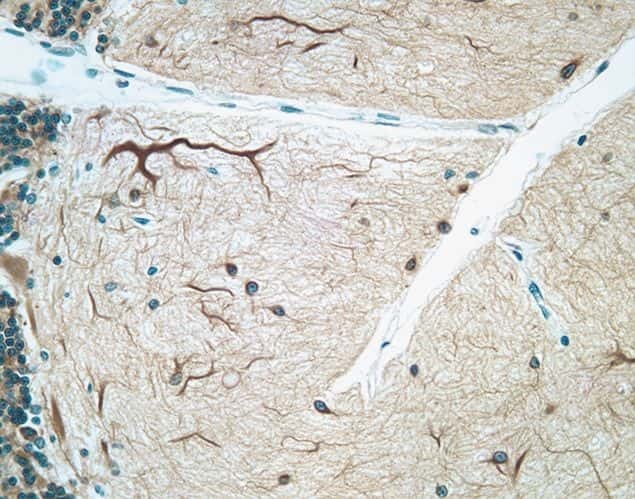
- Immunohistochemical staining of human cerebellum tissue using mouse anti-MAP2 monoclonal antibody (Product # 13-1500).
Supportive validation
- Submitted by
- Invitrogen Antibodies (provider)
- Main image
- Experimental details
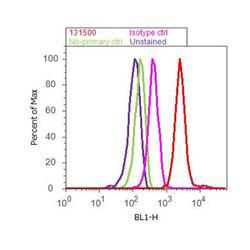
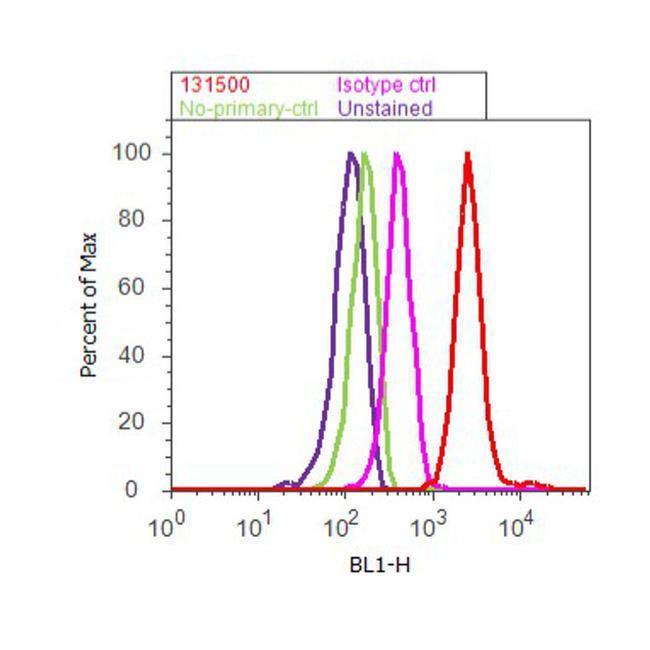
- Flow cytometry analysis of MAP2 was done on U-87 MG cells. Cells were fixed with 70% ethanol for 10 minutes, permeabilized with 0.25% Triton™ X-100 for 20 minutes, and blocked with 5% BSA for 30 minutes at room temperature. Cells were labeled with MAP2 Mouse Monoclonal Antibody (131500, red histogram) or with mouse isotype control (pink histogram) at 3-5 ug/million cells in 2.5% BSA. After incubation at room temperature for 2 hours, the cells were labeled with Alexa Fluor® 488 Rabbit Anti-Mouse Secondary Antibody (A11059) at a dilution of 1:400 for 30 minutes at room temperature. The representative 10,000 cells were acquired and analyzed for each sample using an Attune® Acoustic Focusing Cytometer. The purple histogram represents unstained control cells and the green histogram represents no-primary-antibody control.
Supportive validation
- Submitted by
- Invitrogen Antibodies (provider)
- Main image
- Experimental details
- NULL
- Submitted by
- Invitrogen Antibodies (provider)
- Main image
- Experimental details
- NULL
- Submitted by
- Invitrogen Antibodies (provider)
- Main image
- Experimental details
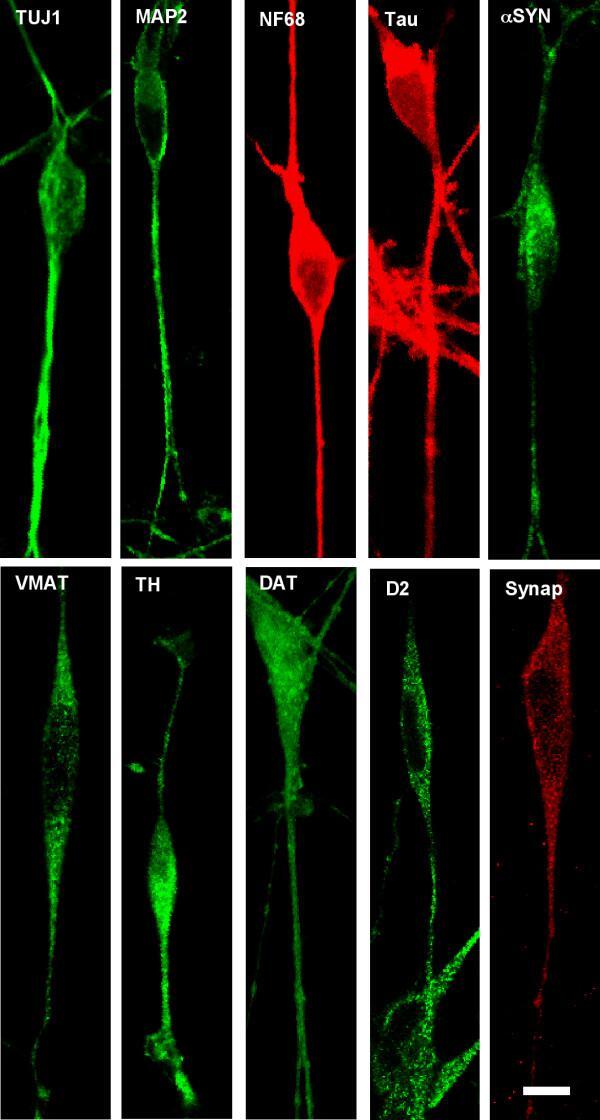
- Figure 1 Confocal microscopic images of immunohistochemical staining of differentiated SH-SY5Y neural cells following differentiation in staurosporine . Abbreviations: TUJ1 (Neuronal Class III beta-Tubulin); MAP-2 (microtubule associated protein 2); NF68 (neurofilament 68); alpha SYN (alpha-synuclein); VMAT (vesicular monoamine transporter) TH (tyrosine hydroxylase); DAT (dopamine transporter); D2 (D2 dopamine receptor); Synap (synaptophysin).
- Submitted by
- Invitrogen Antibodies (provider)
- Main image
- Experimental details
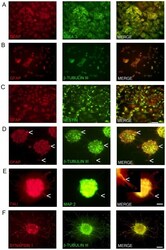
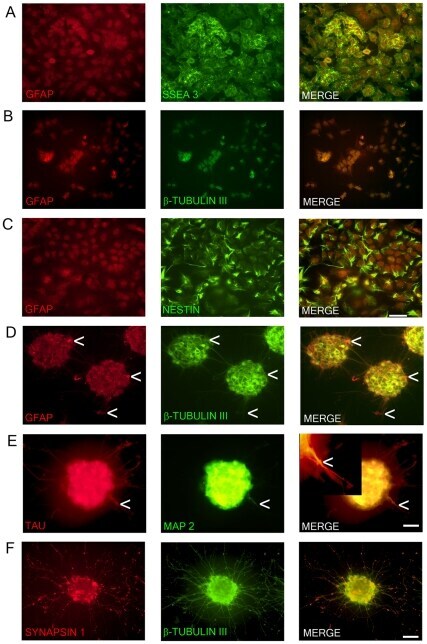
- Figure 1 Marker expression of NTERA2 (NT2) cells and ATRA differentiated NTERA2 neurons (NT2N). NT2 cells (A-C) co-express GFAP and SSEA3 with GFAP staining confined to the nucleus (A). NT2 cells also co-express GFAP and beta-tubulin III (BT3) which are both mainly confined to the nucleus (B). Nestin with GFAP are co-localized in NT2 cells (C). NT2N assembled themselves into cell clusters which co-expressed GFAP and BT3 found within the cytoplasm and neurites (D). Arrow heads point to cells that appear as radial glia cells which only display GFAP staining (D). NT2N also express neural markers TAU and MAP2 with MAP2 confined to dendrites (tapering morphology shown by arrow heads) and TAU not displaying restriction to axons. In merge panel insert shows close-up view of neurite (E). Synapsin 1 staining is seen as punctate along neurite projections co-expressing BT3 (F). Photomicrographs were obtained at 100X (A-C; scale bar 200 um) and 200X (D-F; scale bar 100 um).
- Submitted by
- Invitrogen Antibodies (provider)
- Main image
- Experimental details
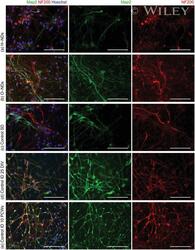
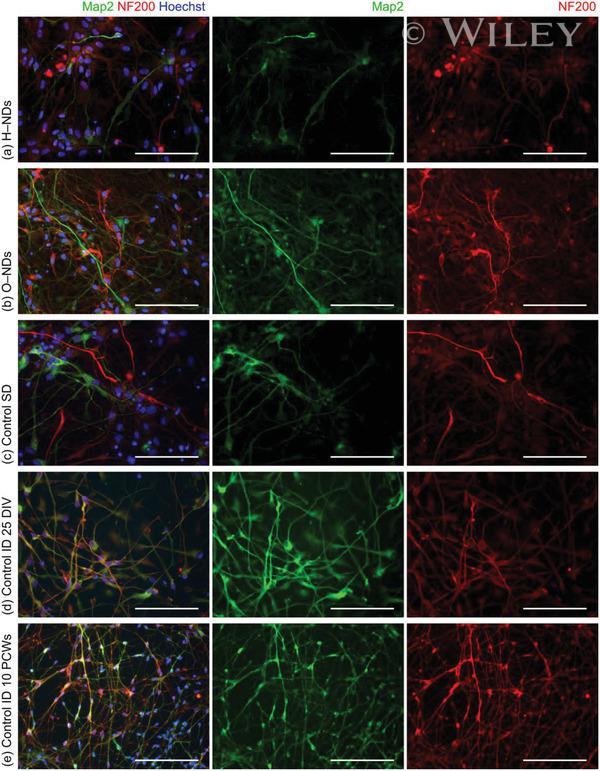
- Fluorescently stained images of neurons, which have been differentiated from hNSCs after a-d) 25 DIV and e) 10 Post Conception Weeks (PCWs). (a) Spontaneous differentiation on H-NDs, b) spontaneous on O-NDs, c) Spontaneous Differentiation (SD) on the glass Control. d,e) Induced Differentiation (ID) into neurons on TCPS control after 25 DIV and 10 PCWs respectively. Neurons have been stained using MAP2 (green), NF200 (red), and Hoechst (blue). All scale bars 100 um, magnification 40x.
- Submitted by
- Invitrogen Antibodies (provider)
- Main image

- Experimental details
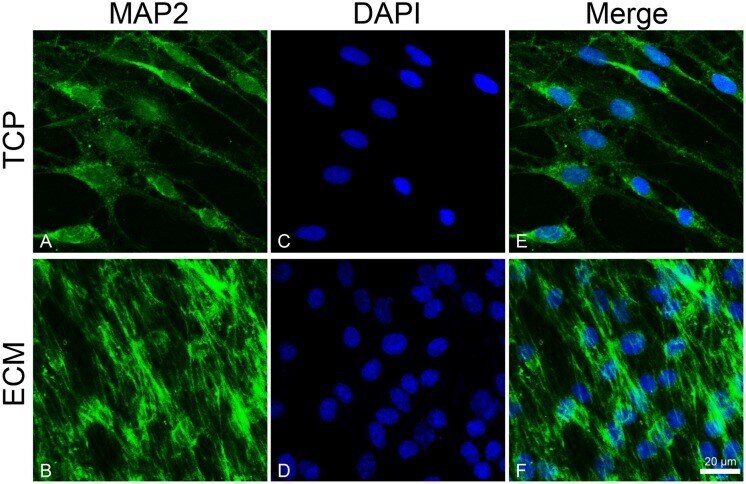
- FIGURE 5 Distribution of the MAP2 (green signals) in DPSC-derived neuronal-like stem cells grew for 7 days on glass (A) and ECM (B) support. MAP2 was detected by a mouse primary antibody followed by a FITC-conjugated goat anti-mouse secondary antibody. Nuclei were stained with DAPI (C-D) and a merge was made (E-F) . Images were captured using lasers with wavelenght of 405 and 488 nm. Scale bar corresponds to 20 mum.
- Submitted by
- Invitrogen Antibodies (provider)
- Main image

- Experimental details
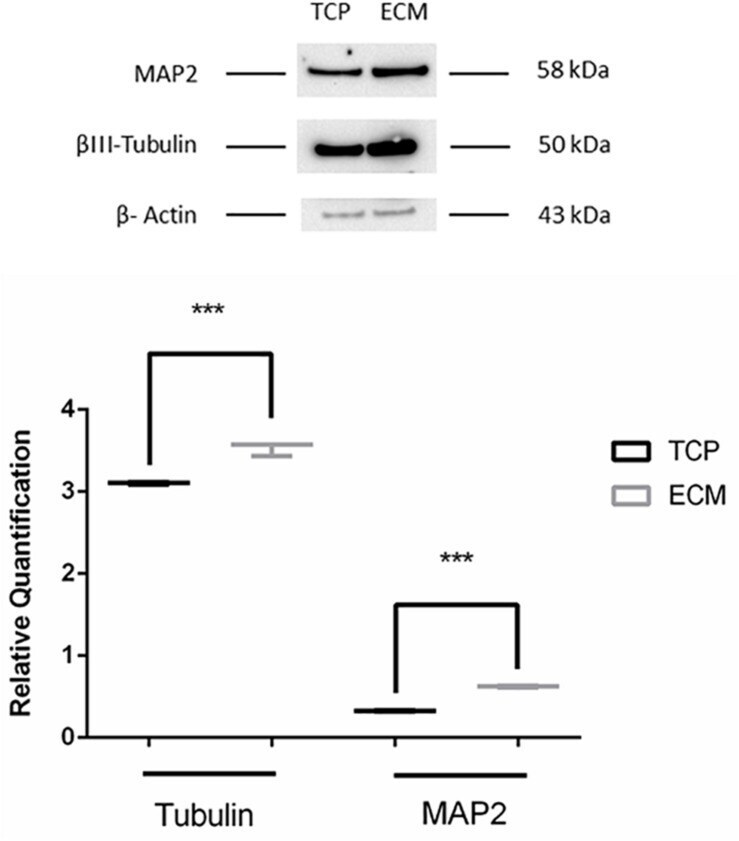
- FIGURE 9 Western blot assay. The data are expressed as mean +- standard deviation (*** P < 0.001 vs. Control as determined by Student''s t -test) from at least three independent experiments.
- Submitted by
- Invitrogen Antibodies (provider)
- Main image
- Experimental details
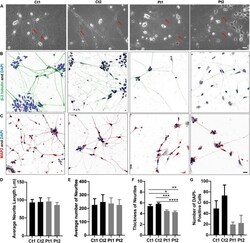
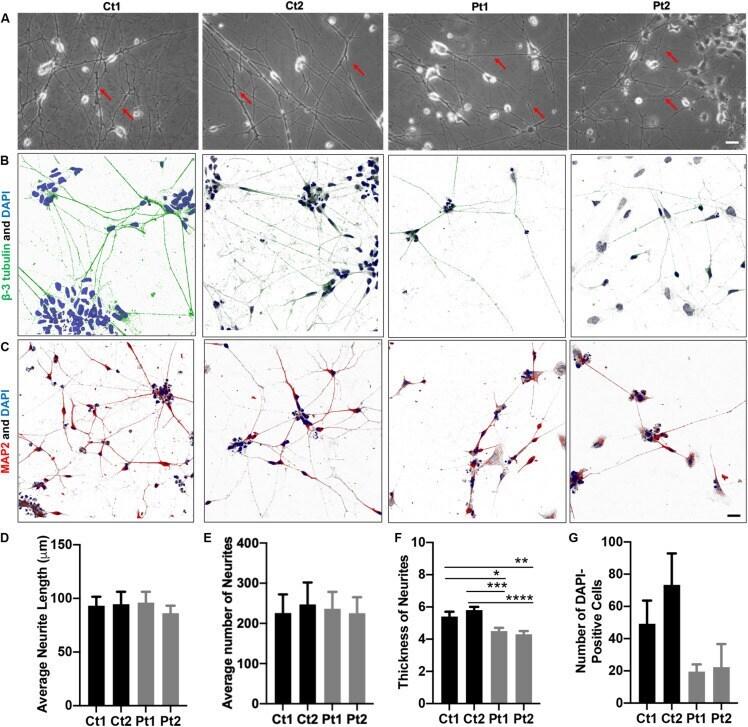
- FIGURE 1 Morphology of iPSC/NSC-derived neurons. Neurite networks of healthy donor control (Ct1 and Ct2) and patient (Pt1 and Pt2) neurons were revealed by phase contrast imaging (A) and immunofluorescence imaging of cells stained with antibodies to cytoskeletal proteins beta-3-Tubulin (B) and MAP2 (C) . The length (D) , number (E) and thickness (F) of neurites were measured from phase contrast images and quantified. There were no significant differences in either the number or the length of neurites between control or patient-cells. Specifically, the average neurite length (D) of different cells was: Ct1, 93.2 +- 8.4 mum; Ct2, 94.6 +- 11.6 mum; Pt1, 96.1 +- 10.1 mum; and Pt2, 86.2 +- 7.0 mum ( p = 0.882; n = 5). The average number (E) of neurites per image was: Ct1, 225.8 +- 46.4; Ct 2, 247.2 +- 54.6: Pt1, 236.0 +- 42.4; and Pt2, 225.4 +- 39.8 ( p = 0.985; n = 5). The average neurite thickness (F) in Ct1 was 5.4 +- 0.3 mum, Ct2 was 5.8 +- 0.2 mum, Pt1 was 4.5 +- 0.2 mum, and Pt2 was 4.3 +- 0.2 mum ( p = 0.03 for Ct1 vs Pt1; p = 0.00045 for Ct2 vs Pt1; p = 0.005 for Ct1 vs Pt2; p = 0.00004 for Ct2 vs Pt2; n = 10 primary neurites measured in 5 phase contrast images for all conditions, totaling 50 neurites measured per condition). * Indicates a significance level of p < 0.05, ** p < 0.01, *** p < 0.001, and **** p < 0.0001. (G) Number of DAPI-Positive Cells Bar Graph. DAPI staining of nuclei revealed fewer patient neurons adhered to the culture dish. Number of DAPI-positive cel
- Submitted by
- Invitrogen Antibodies (provider)
- Main image

- Experimental details
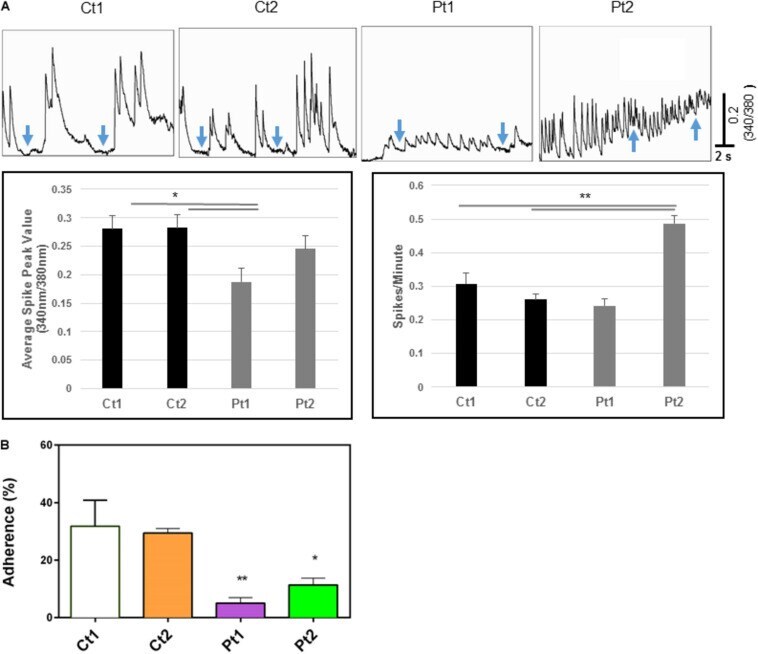
- FIGURE 5 (A) Calcium imaging data. Top panels show raw traces of spontaneous calcium transients recorded from neurons of control donors and patients. Bottom bar graphs are quantitative data of the mean peak amplitudes and spiking frequency of calcium transients. Our data show that neurons from patients (Pt1 and Pt2) exhibited significant changes in either the amplitude or the frequency of calcium transients with the inability to return to basal levels compared to their matched donor controls (Ct1 and Ct2). Arrows indicate basal levels between calcium transcients. (B) Adhesion activity of neurons. Control (Ct1 and Ct2) and patient-derived (Pt1 and Pt2) neurons (6-days after differentiation from NSC) were plated onto Geltrex coated 8-well glass slide Chamber and incubated at 37degC for 30 min, the dishes were flipped to remove non-adherent cells. The adherent neurons were stained with an antibody specific to MAP2 and DAPI and MAP2-expressing cells were counted. Percentage of adherent (flipped) cells was calculated based on un-flipped cells. Patient-derived cells exhibited statistically less adhesion than control cells Ct1 and Ct2: Pt1 ( p < 0.05) and Pt2 (
- Submitted by
- Invitrogen Antibodies (provider)
- Main image
- Experimental details
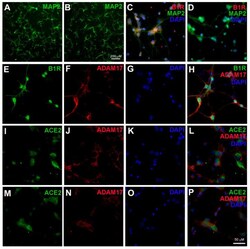
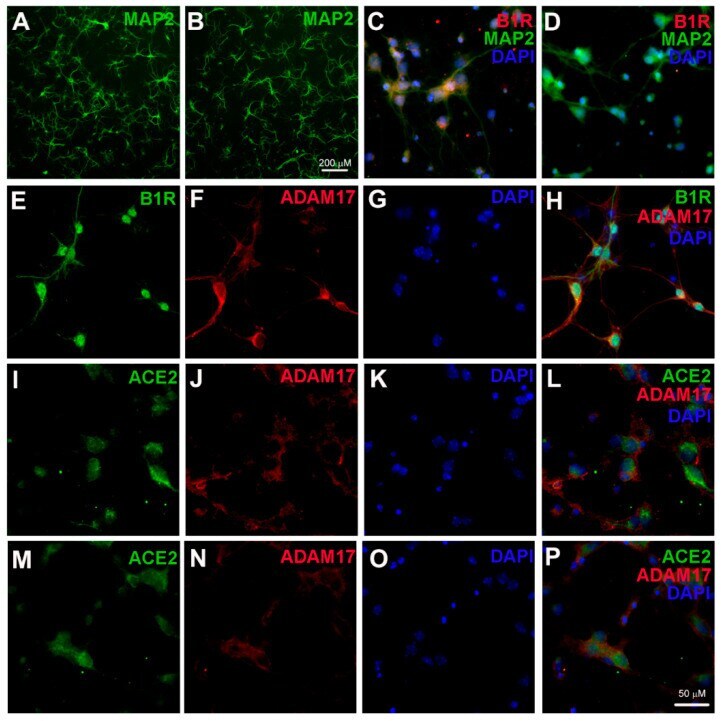
- Figure 1 Kinin B1 receptor (B1R), A Disintegrin And Metalloprotease 17 (ADAM17), and angiotensin converting enzyme 2 (ACE2) expression in primary hypothalamic neurons. Representative photomicrographs showing immunofluorescence staining for neuron-specific marker microtubule associated protein 2 (MAP-2) (Green) in primary neurons from wild-type ( A ) and B1R knockout mice ( B ) cultured for 10 days. Primary neurons from wild-type mice pups showed immunopositivity for the presence of B1R ( C ), while B1R immunoreactivity was absent in neurons with B1R deletion ( D ). Representative triple immunostaining revealed that kinin B1R ( E ) and ADAM17 ( F ) are expressed in primary hypothalamic neurons expressing nuclear DAPI staining in blue ( G ), and merged image ( H ) shows the colocalization of B1R and ADAM17. Representative triple immunostaining showing ACE2 and ADAM17 expression and co-localization in wild-type neurons ( I - L ) and in B1R knockout neurons ( M - P ).
- Submitted by
- Invitrogen Antibodies (provider)
- Main image

- Experimental details
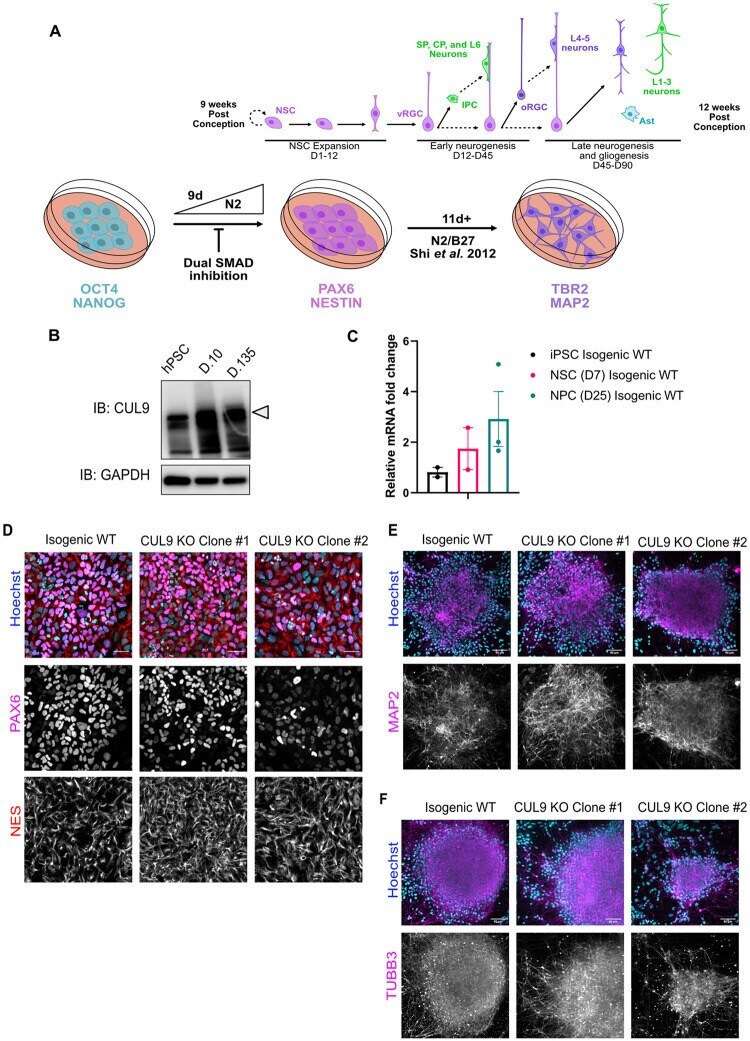
- Fig 2 CUL9 KO clones differentiate to hNPCs and early born cortical neurons. ( A ) Protocol for neuronal differentiation of hPSCs. Diagram above in vitro differentiation roughly correlates to in vivo corticogenesis with differentiation protocol. Exact cell population at stages of differentiation often varies between differentiations. NPC = neuroepithelial progenitor cells; PP = preplate; vRGC = ventricular radial glia cells; IPC = intermediate progenitor cells; SP = subplate; CP = cortical plate; oRGC = outer radial glia cells; Ast = astrocyte ( B ) CUL9 protein levels increase over the course of cortical neuron differentiation. Western blot analysis of lysates obtained from WT neurons differentiated for ten days and 135 days show gradual increase in CUL9 protein levels compared to WT hPSCs. APC7 levels increase during initial neuronal induction, and then remain relatively stable throughout maturation. n = 3. ( C ) CUL9 mRNA levels increase over the course of cortical differentiation. RNA isolated from iPSCs, D7 cortical differentiation, and D25 cortical differentiation were analyzed by RT-qPCR. Error bars +/- SD. iPSC and D7 n = 2. D25 n = 3. Key hNPC ( D ) and neuronal markers ( E ) are appropriately localized and expressed in CUL9 KO cells. hNSCs were fixed with 4% PFA and stained with key transcription factor PAX6 (red, Alexa 546) and NESTIN (purple, Alexa 647), and Hoechst, marking nuclei (blue). hNPCs were fixed and stained with neuronal markers MAP2 (purple, Alexa 647)
- Submitted by
- Invitrogen Antibodies (provider)
- Main image

- Experimental details
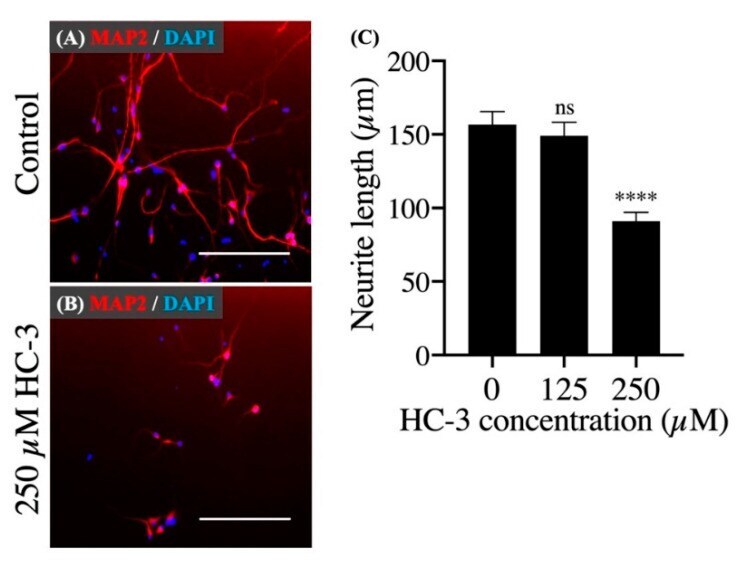
- Figure 5 The effect of extracellular choline uptake inhibition on neurite outgrowth in hNSCs. ( A ) Cultivation in the control differentiation medium (0 muM HC-3) for 7 days. Staining shows microtubule-associated protein 2 (MAP2) (red) and DAPI (blue). Scale bar: 200 mum. ( B ) Cultivation in the differentiation medium with 250 muM HC-3 for 7 days. Staining shows MAP2 (red) and DAPI (blue). Scale bar: 200 mum. ( C ) Comparison of the neurite length in various HC-3 concentrations medium. The neurite length was measured in randomly chosen cells (30 cells) by tracing individual neurites. **** p < 0.0001 denotes statistical significance vs. 0 muM HC-3 group using Dunnett multiple comparison test. ns means not significant.
- Submitted by
- Invitrogen Antibodies (provider)
- Main image

- Experimental details
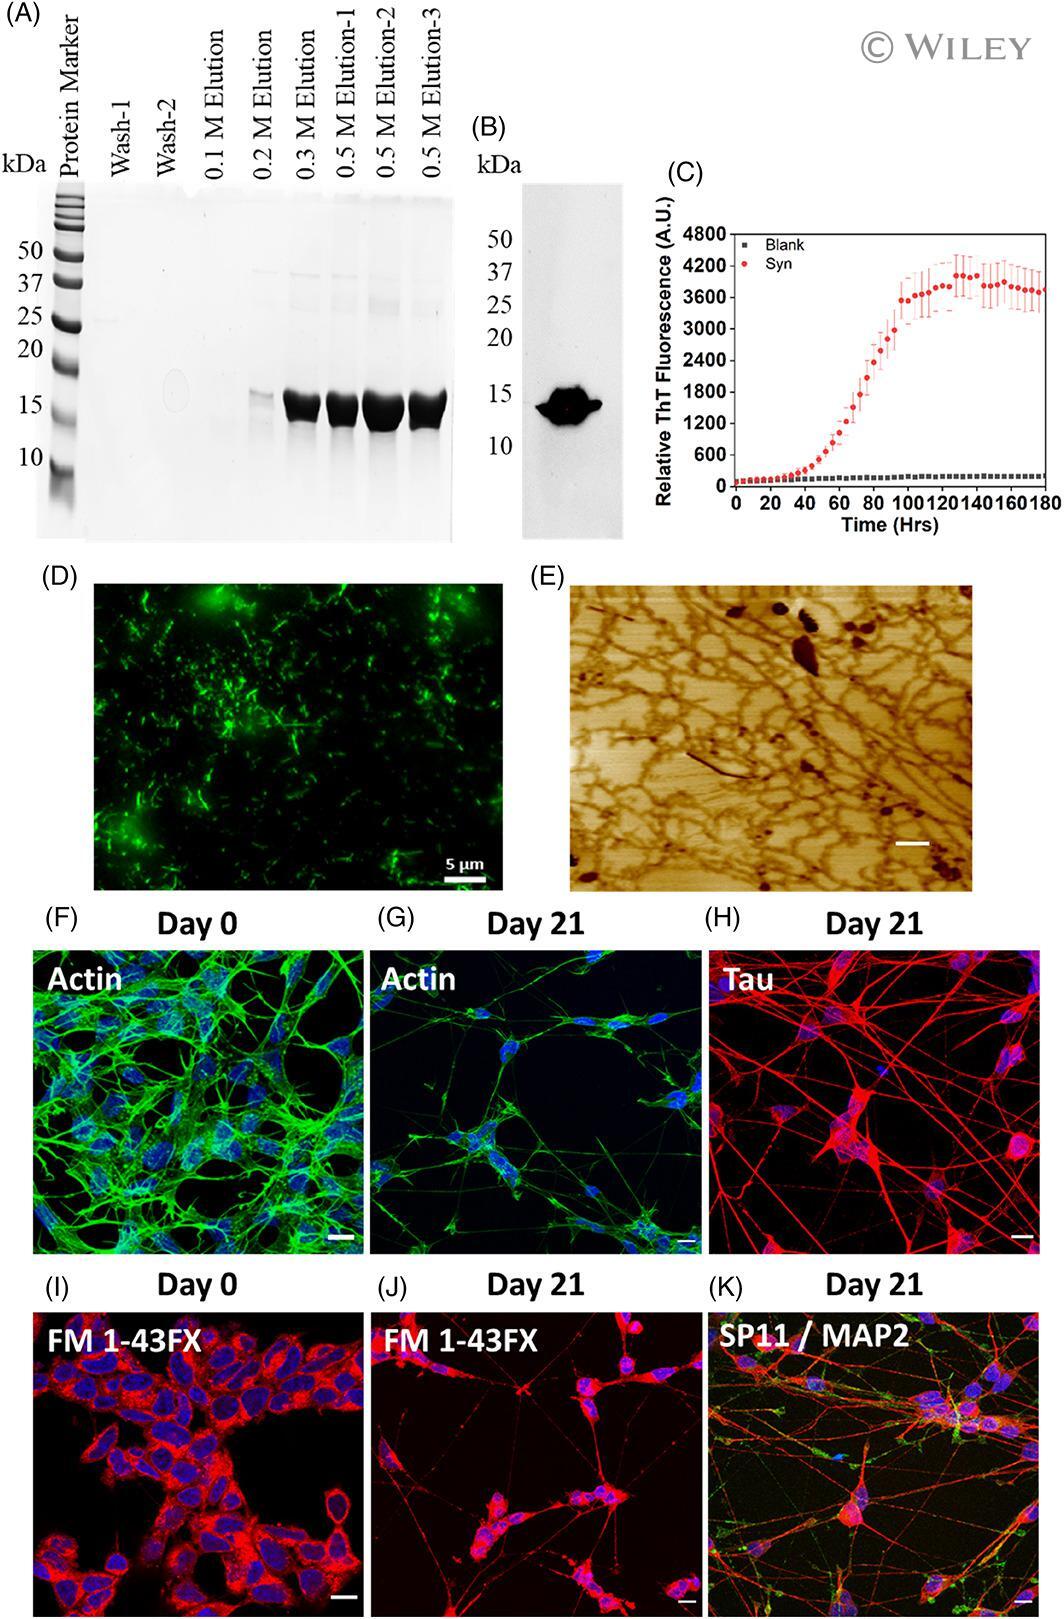
- 1 FIGURE alpha-Synuclein preformed fibrils (PFF) preparation, Characterization, and SH-SY5Y neuroblastoma cell differentiation. (A) Characterization of purified alpha-syn fractions on 15% SDS-PAGE eluted with different NaCl concentrations. (B) Western blot of purified alpha-syn. Western blot analysis of purified alpha-syn, primary antibody: H3C And secondary: Anti-mouse HRP conjugated antibody. (C) Thioflavin-T assay of alpha-synuclein (Red Dots) aggregation. The data represent +-SEM of three independent replicates. (D) Representative fluorescence microscopy image of alpha-synuclein fibrils. Scale bar indicates 5 mum: (E) Representative AFM image of alpha-synuclein fibrils. The scale bar indicates 500 nm. (F-K) show the confocal microscopy images represented as maximum z projection (F-G), Phalloidin (F-Actin) staining in undifferentiated SH-SY5Y cells at day 0, and differentiated neurons on day 21, respectively. (I and J) FM 1-43 dye staining in undifferentiated SH-SY5Y cells at day 0 and differentiated neurons on day 21, respectively. The cells were stained with FM 1-43FX (5 mug/ml) dye for 15 min at 37degC, followed by cell fixation with 4% PFA. (H and K) shows the immunofluorescence analysis done on differentiated neurons on day 21 for Tau, Synaptophysin (SP11) and Microtubule associated protein (MAP2). Mature neurons confirmation was done against Tau, SP11 and MAP2 at 1:250 dilution for 3 h followed by secondary antibody labeling with Goat anti-Rabbit IgG (H + L) Highly C
- Submitted by
- Invitrogen Antibodies (provider)
- Main image
- Experimental details
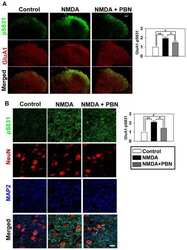
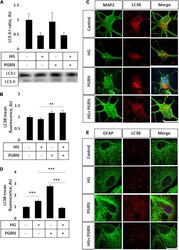
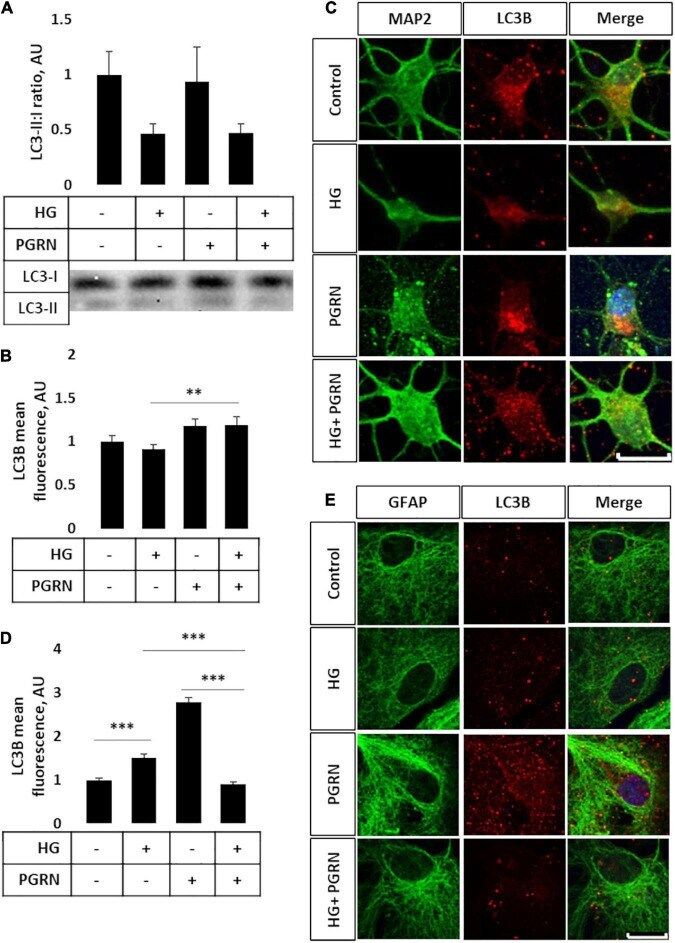
- FIGURE 3 LC3B lipidation and punctate formation in cortical neurons due to high glucose and PGRN. (A) Western blot analysis of LC3 lipidation (i.e., LC3-II:I ratio) in primary cortical neurons after 72 h of treatment. The LC3-II:I ratio decreased from control to high glucose (1.000 +- 0.208 AU to 0.464 +- 0.092 AU), an effect that appeared unaffected when treated with PGRN alongside high glucose (0.474 +- 0.076 AU). No difference was observed between control and PGRN-treated samples (0.938 +- 0.309 AU). N = 9 samples. (B) Immunofluorescence analysis of LC3B puncta expression in neurons after 72 h of treatment. The amount of punctate expression trended toward an increase due to PGRN (from 1.000 +- 0.069 AU, to 1.183 +- 0.077 AU). This difference was significant under high-glucose conditions (from 0.916 +- 0.045 AU, to 1.190 +- 0.097 AU). N = 11-29 cells. (C) Representative immunofluorescence images of primary neurons after 72 h of treatment, with blue as DAPI, green as MAP2, and red as LC3B. Scale bar, 10 mum. (D) Immunofluorescence of LC3B puncta expression in astrocytes after 72 h of treatment increased significantly due to high glucose as well as PGRN treatment (from 1.000 +- 0.0374 AU to 1.512 +- 0.087 AU and 2.792 +- 0.099 AU, respectively). This decreased to control levels under HG + PGRN treatment, to 0.899 +- 0.049 AU. N = 12-29 cells. (E) Representative immunofluorescence images of primary astrocytes after 72 h of treatment, with blue as DAPI, green as GFAP, and red a
- Submitted by
- Invitrogen Antibodies (provider)
- Main image
- Experimental details
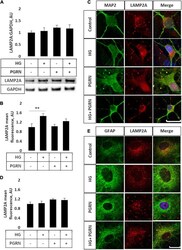
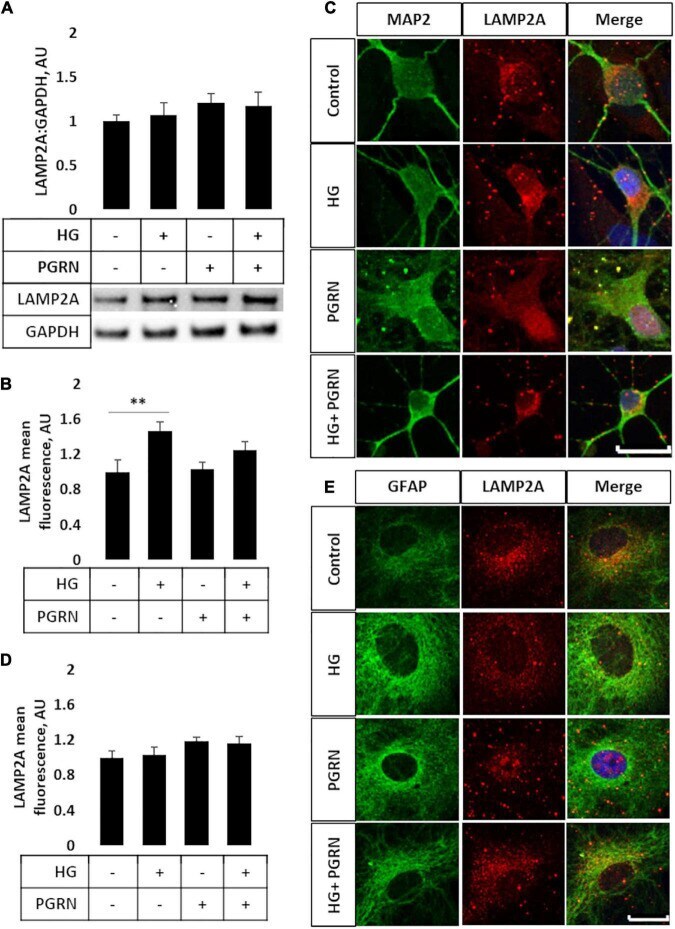
- FIGURE 4 LAMP2A protein levels and punctate localization in cortical neurons and astrocytes due to high glucose and PGRN treatment. (A) Total protein LAMP2A levels are unchanged among treatment groups in primary cortical neurons treated for 24 h. N = 6 samples. (B) Perinuclear LAMP2A punctate formation increased in neurons under HG (from 1.000 +- 0.137 AU to 1.463 +- 0.108 AU), an effect that was attenuated with PGRN (from 1.031 +- 0.083 AU to 1.246 +- 0.096 AU). N = 12-27 cells. (C) Representative immunofluorescence images of primary neurons after 72 h of treatment, with blue as DAPI, green as MAP2, and red as LAMP2A. Scale bar, 10 mum. (D) Perinuclear LAMP2A punctate formation appeared to show a trend toward an increase due to PGRN but was not statistically significant ( F = 1.825, p = 0.151). N = 16-22 cells. (E) Representative immunofluorescence images of primary astrocytes after 72 h of treatment, with blue as DAPI, green as GFAP, and red as LAMP2A. Scale bar, 10 mum. ** p < 0.01.
- Submitted by
- Invitrogen Antibodies (provider)
- Main image
- Experimental details
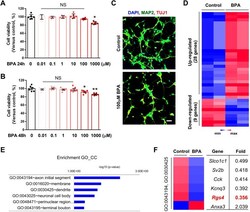
- Fig. 1. Gene expression changes in cultured cortical neurons after bisphenol-A (BPA) exposure. (A,B) Cell viability: WST-8 assay. Histograms represent the percentage, with respect to control cells, of viable cells after exposure to 0.01, 0.1, 1, 10, 100 or 1000 muM BPA for 24 h or 48 h. Statistical significance was determined by two-way ANOVA with Bonferroni correction. Data are shown as relative changes versus controls. NS, not significant; * P

- Submitted by
- Invitrogen Antibodies (provider)
- Main image
- Experimental details
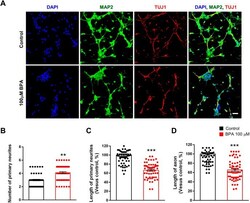
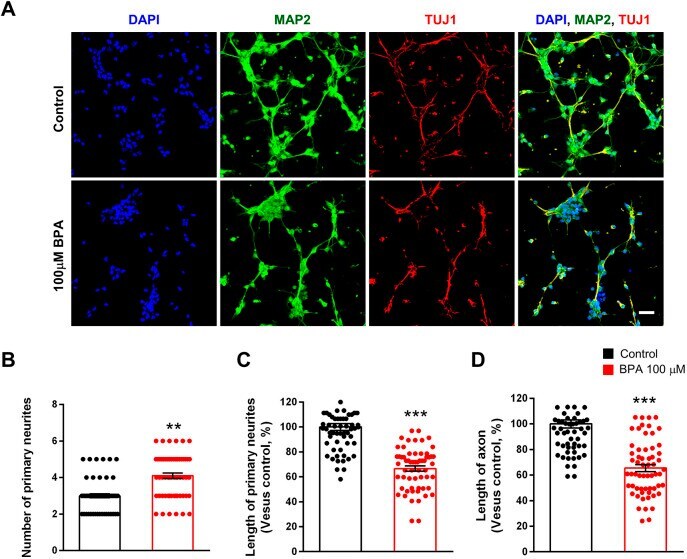
- Fig. 2. Abnormal neurite architecture in cultured cortical neurons after BPA exposure. (A) BPA initially suppressed neurite outgrowth in cultured cortical neurons. At 5 days in vitro (DIV5), cultured cortical neurons were treated with saline or BPA (100 muM) for 24 h. Neurites were assessed by immunostaining using an anti-MAP2 antibody. Axons were assessed by immunostaining using an anti-TUJ1 antibody. Scale bar: 10 mum. (B) Quantification of the number of primary neurites in each condition. n =60 neurons for control; n =60 neurons for the BPA-exposed condition. (C) Quantification of the length of primary neurites in each condition. n =60 neurons for control; n =60 neurons for the BPA-exposed condition. (D) Quantification of the length of axons in each condition. n =60 neurons for control; n =60 neurons for the BPA condition. Statistical significance was determined by one-way ANOVA with Bonferroni correction. Data are shown as relative changes versus controls. ** P
- Submitted by
- Invitrogen Antibodies (provider)
- Main image
- Experimental details
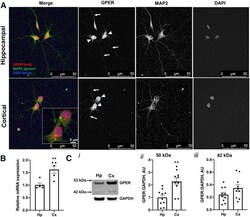
- Figure 7. Studies of GPER expression in hippocampal and cortical cultures and tissues. GPER expression and localization in cultured hippocampal and cortical neurons 72 HIC were measured using immunofluorescent and confocal microscopy techniques. A , Representative fluorescence images showing the localization of GPER (red) in cell bodies (arrowheads) and neurites (arrows). Cell nuclei are labeled with DAPI (blue) and neurites are labeled with MAP2 (green). B , RT-qPCR measurement of the relative GPER mRNA level in samples derived from hippocampal and cortical culture at 72 HIC shows a significantly (unpaired Student's t test, p < 0.01, n = 5 replicates) higher GPER mRNA level in cortical than hippocampal cultures. C , Western blot measurements of GPER protein expression in ex vivo hippocampal and cortical tissues from individual E18 rat brains ( n = 10) reveals two protein species with mass sizes of ~50 and 42 kDa ( i ). Statistical analysis shows that expression of GPER ~50 kDa is significantly higher in cortical than in hippocampal tissues ( ii ), while GPER ~42 kDa is slightly, but not significantly, higher in cortical than in hippocampal tissues ( iii ). Unpaired Student's t test; ** p < 0.01. The specificity of the GPER antibody used for this study was validated by immunocytochemistry and Western blotting. The validation results are shown in Extended Data Figure 7-1 .

- Submitted by
- Invitrogen Antibodies (provider)
- Main image
- Experimental details
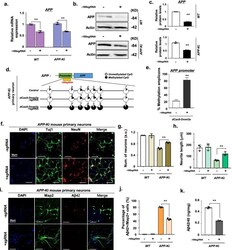
- Fig. 2 dCas9-Dnmt3a-mediated APP methylation enhanced neuroprotection in APP -KI mouse primary neurons. a Quantitative real-time PCR analysis of APP expression in WT and APP -KI mouse primary neurons treated with - 189 sgRNA and dCas9-Dnmt3a. Data are expressed as mean +- SEM ( n = 3). ** P < 0.01, two-sided Student's t -test. b , c Western blot analysis of APP in WT and APP -KI mouse primary neurons treated with - 189 sgRNA and dCas9-Dnmt3a. Data are expressed as mean +- SEM ( n = 3). ** P < 0.01, two-sided Student's t -test. d Bisulfite sequencing analysis of the promoter region of APP in APP -KI mouse primary neurons treated with - 189 sgRNA and dCas9-Dnmt3a. e Quantification of methylated amplicons. In 3 independent experiments, 10 to 30 sequencing data were measured in total. Data are expressed as mean +- SEM. ** P < 0.01, two-sided Student's t -test. f Immunostaining of Tuj1 (green), NeuN (red), and DAPI (blue) in APP -KI mouse primary neurons treated with - 189 sgRNA and dCas9-Dnmt3a. g The number of Tuj1-positive neurons in f . Data are expressed as mean +- SEM ( n = 3). ** P < 0.01, two-sided Student's t -test. h Quantification of neurite length. In 3 independent experiments, over 100 neurites were measured. Data are expressed as mean +- SEM ( n = 3). ** P < 0.01, two-sided Student's t -test. i Map2 (green), Abeta42 (red), and DAPI (blue) immunostaining in APP -KI mouse primary neurons treated with - 189 sgRNA and dCas9-Dnmt3a. j Percentage of Abeta42+/Map2+ cells fr

- Submitted by
- Invitrogen Antibodies (provider)
- Main image
- Experimental details
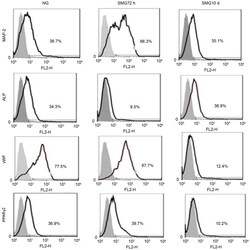
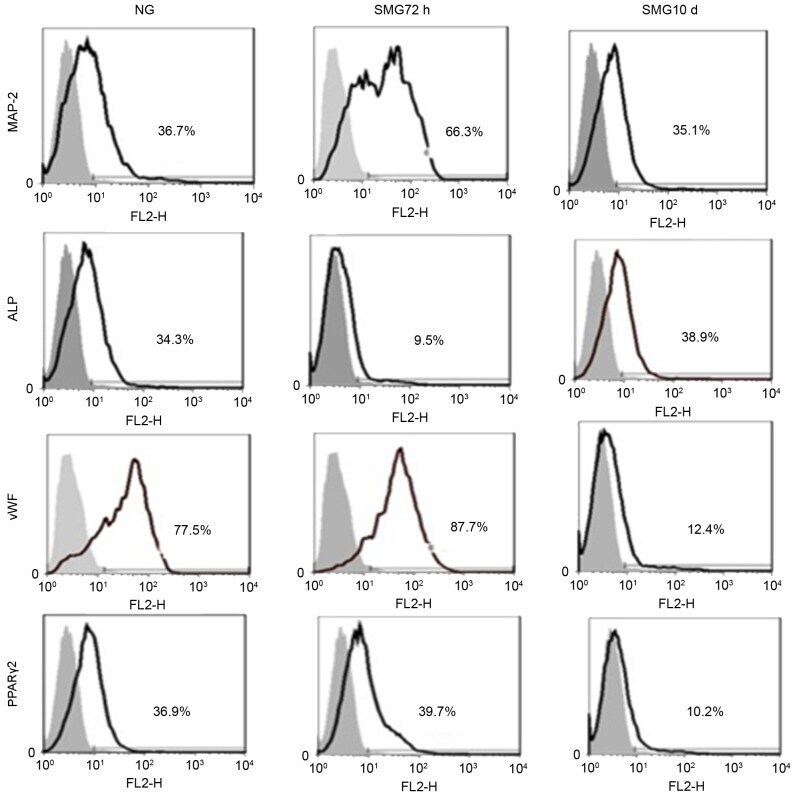
- Figure 3. Fluorescence-activated cell sorting analysis of MAP-2, vWF, ALP and PPARgamma-2 following culture of rat mesenchymal stem cells for 10 days in differentiation medium subsequent to exposure to NG and 72 h and 10 days SMG. The gray area is the isotype control. The results represent three independent experiments. MAP-2, microtubule-associated protein 2; vWF, von Willebrand factor; ALP, alkaline phosphatase; PPARgamma2, peroxisome proliferator-activated receptor gamma2; NG, normal gravity; SMG, simulated microgravity.
- Submitted by
- Invitrogen Antibodies (provider)
- Main image
- Experimental details
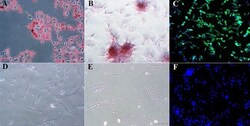
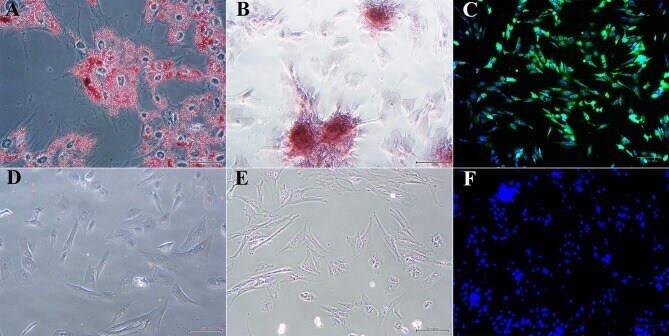
- Figure 5 Photomicrographs of P1 laminar progenitor cells cultured in adipogenic (A) , osteogenic (B) , neurogenic (C) or stromal (D-F) medium and stained with oil red O (A,D) , alizarin red (B,E) or anti-map2, anti-mouse IgG-488 (green, C,F ). DAPI nuclear stain (blue, C,F ). Magnification = 20X, Bar = 100 mum.
- Submitted by
- Invitrogen Antibodies (provider)
- Main image
- Experimental details
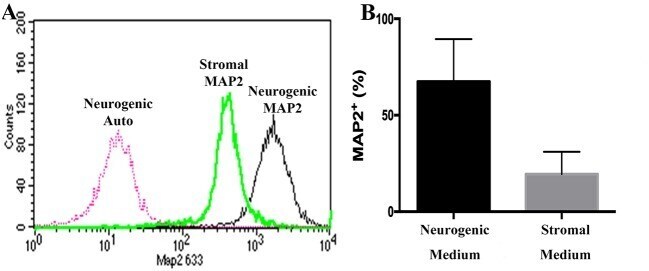
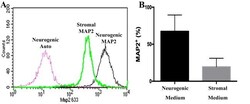
- Flow cytometry histogram showing MAP2 labeling of P1 equine hoof progenitor cells from an unaffected hoof cultured in stromal (Stromal MAP2) or neurogenic medium (Neurogenic MAP2), and autofluorescence of unlabelled cells cultured in neurogenic medium (Neurogenic Auto, A ). Percentage (mean +- SEM) of P1 hoof progenitor cells from unaffected hooves expressing MAP2 after culture in stromal (Stromal) or neurogenic (Neurogenic) induction medium (B) .