 Explore
 Validate
 Learn
Learn Immunocytochemistry
Antibody data
- Antibody Data
- Antigen structure
- References [13]
- Comments [0]
- Validations
- Immunocytochemistry [6]
- Immunohistochemistry [3]
- Other assay [4]
Submit
Validation data
Reference
Comment
Report error
- Product number
- PA5-17646 - Provider product page

- Provider
- Invitrogen Antibodies
- Product name
- MAP2 Polyclonal Antibody
- Antibody type
- Polyclonal
- Antigen
- Synthetic peptide
- Description
- It is not recommended to aliquot this antibody.
- Concentration
- 73.6 µg/mL
Submitted references Alzheimer's disease associated AKAP9 I2558M mutation alters posttranslational modification and interactome of tau and cellular functions in CRISPR-edited human neuronal cells.
SARS-CoV-2 Infects Primary Neurons from Human ACE2 Expressing Mice and Upregulates Genes Involved in the Inflammatory and Necroptotic Pathways.
Low dose lead exposure induces alterations on heterochromatin hallmarks persisting through SH-SY5Y cell differentiation.
Profiling senescent cells in human brains reveals neurons with CDKN2D/p19 and tau neuropathology.
Microfluidic Multielectrode Arrays for Spatially Localized Drug Delivery and Electrical Recordings of Primary Neuronal Cultures.
The Interaction of Aging and Cellular Stress Contributes to Pathogenesis in Mouse and Human Huntington Disease Neurons.
Suppression of MEHMO Syndrome Mutation in eIF2 by Small Molecule ISRIB.
Robotic High-Throughput Biomanufacturing and Functional Differentiation of Human Pluripotent Stem Cells.
Progesterone through Progesterone Receptor B Isoform Promotes Rodent Embryonic Oligodendrogenesis.
Determinants of Zika virus host tropism uncovered by deep mutational scanning.
Complement-independent bystander injury in AQP4-IgG seropositive neuromyelitis optica produced by antibody-dependent cellular cytotoxicity.
Scaling Principles of Distributed Circuits.
An RGD small-molecule integrin antagonist induces detachment-mediated anoikis in glioma cancer stem cells.
You Y, Hersh SW, Aslebagh R, Shaffer SA, Ikezu S, Mez J, Lunetta KL, Logue MW, Farrer LA, Ikezu T
Aging cell 2022 Jun;21(6):e13617
Aging cell 2022 Jun;21(6):e13617
SARS-CoV-2 Infects Primary Neurons from Human ACE2 Expressing Mice and Upregulates Genes Involved in the Inflammatory and Necroptotic Pathways.
Rothan HA, Kumari P, Stone S, Natekar JP, Arora K, Auroni TT, Kumar M
Pathogens (Basel, Switzerland) 2022 Feb 17;11(2)
Pathogens (Basel, Switzerland) 2022 Feb 17;11(2)
Low dose lead exposure induces alterations on heterochromatin hallmarks persisting through SH-SY5Y cell differentiation.
Lin LF, Xie J, Sánchez OF, Bryan C, Freeman JL, Yuan C
Chemosphere 2021 Feb;264(Pt 1):128486
Chemosphere 2021 Feb;264(Pt 1):128486
Profiling senescent cells in human brains reveals neurons with CDKN2D/p19 and tau neuropathology.
Dehkordi SK, Walker J, Sah E, Bennett E, Atrian F, Frost B, Woost B, Bennett RE, Orr TC, Zhou Y, Andhey PS, Colonna M, Sudmant PH, Xu P, Wang M, Zhang B, Zare H, Orr ME
Nature aging 2021 Dec;1(12):1107-1116
Nature aging 2021 Dec;1(12):1107-1116
Microfluidic Multielectrode Arrays for Spatially Localized Drug Delivery and Electrical Recordings of Primary Neuronal Cultures.
Bruno G, Colistra N, Melle G, Cerea A, Hubarevich A, Deleye L, De Angelis F, Dipalo M
Frontiers in bioengineering and biotechnology 2020;8:626
Frontiers in bioengineering and biotechnology 2020;8:626
The Interaction of Aging and Cellular Stress Contributes to Pathogenesis in Mouse and Human Huntington Disease Neurons.
Machiela E, Jeloka R, Caron NS, Mehta S, Schmidt ME, Baddeley HJE, Tom CM, Polturi N, Xie Y, Mattis VB, Hayden MR, Southwell AL
Frontiers in aging neuroscience 2020;12:524369
Frontiers in aging neuroscience 2020;12:524369
Suppression of MEHMO Syndrome Mutation in eIF2 by Small Molecule ISRIB.
Young-Baird SK, Lourenço MB, Elder MK, Klann E, Liebau S, Dever TE
Molecular cell 2020 Feb 20;77(4):875-886.e7
Molecular cell 2020 Feb 20;77(4):875-886.e7
Robotic High-Throughput Biomanufacturing and Functional Differentiation of Human Pluripotent Stem Cells.
Tristan CA, Ormanoglu P, Slamecka J, Malley C, Chu PH, Jovanovic VM, Gedik Y, Bonney C, Barnaeva E, Braisted J, Mallanna SK, Dorjsuren D, Iannotti MJ, Voss TC, Michael S, Simeonov A, Singeç I
bioRxiv : the preprint server for biology 2020 Aug 3;
bioRxiv : the preprint server for biology 2020 Aug 3;
Progesterone through Progesterone Receptor B Isoform Promotes Rodent Embryonic Oligodendrogenesis.
González-Orozco JC, Moral-Morales AD, Camacho-Arroyo I
Cells 2020 Apr 14;9(4)
Cells 2020 Apr 14;9(4)
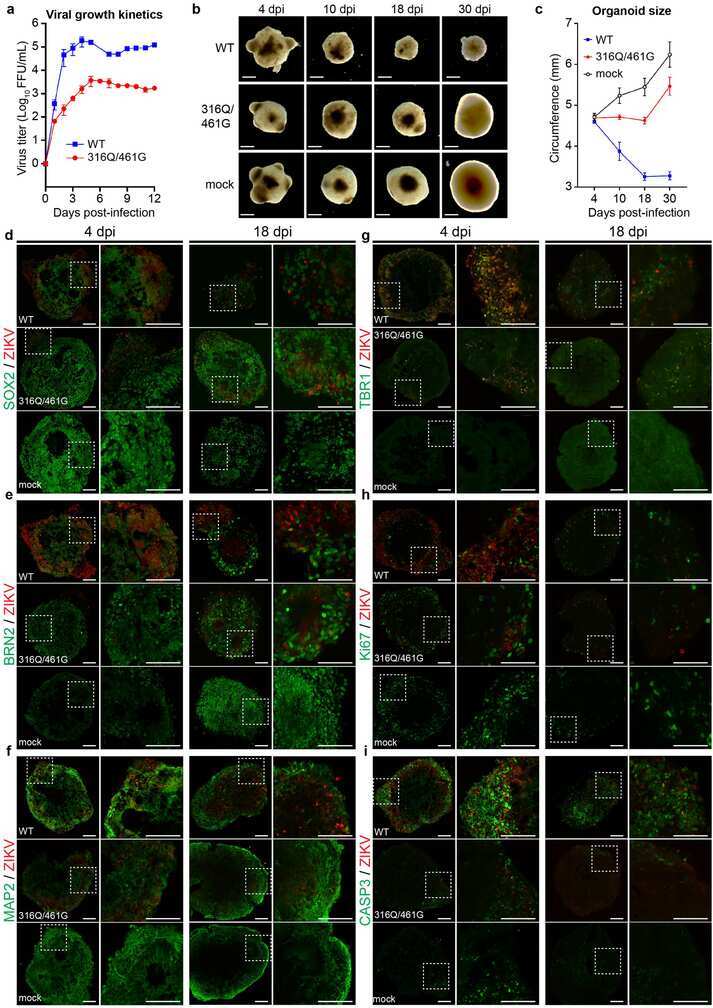
Determinants of Zika virus host tropism uncovered by deep mutational scanning.
Setoh YX, Amarilla AA, Peng NYG, Griffiths RE, Carrera J, Freney ME, Nakayama E, Ogawa S, Watterson D, Modhiran N, Nanyonga FE, Torres FJ, Slonchak A, Periasamy P, Prow NA, Tang B, Harrison J, Hobson-Peters J, Cuddihy T, Cooper-White J, Hall RA, Young PR, Mackenzie JM, Wolvetang E, Bloom JD, Suhrbier A, Khromykh AA
Nature microbiology 2019 May;4(5):876-887
Nature microbiology 2019 May;4(5):876-887
Complement-independent bystander injury in AQP4-IgG seropositive neuromyelitis optica produced by antibody-dependent cellular cytotoxicity.
Duan T, Smith AJ, Verkman AS
Acta neuropathologica communications 2019 Jul 11;7(1):112
Acta neuropathologica communications 2019 Jul 11;7(1):112
Scaling Principles of Distributed Circuits.
Srinivasan S, Stevens CF
Current biology : CB 2019 Aug 5;29(15):2533-2540.e7
Current biology : CB 2019 Aug 5;29(15):2533-2540.e7
An RGD small-molecule integrin antagonist induces detachment-mediated anoikis in glioma cancer stem cells.
Paolillo M, Galiazzo MC, Daga A, Ciusani E, Serra M, Colombo L, Schinelli S
International journal of oncology 2018 Dec;53(6):2683-2694
International journal of oncology 2018 Dec;53(6):2683-2694
No comments: Submit comment
Supportive validation
- Submitted by
- Invitrogen Antibodies (provider)
- Main image

- Experimental details
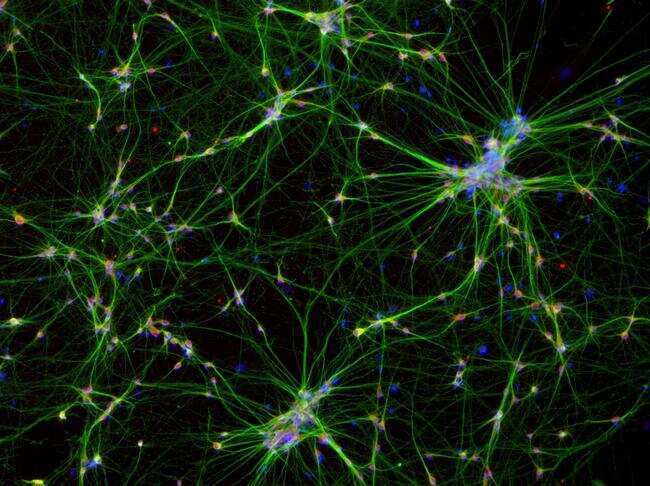
- Immunofluorescent analysis of MAP2 in the differentiated neurons from H9 ESC-derived NSCs. 2 weeks after differentiation, cells were fixed, permeabilized and stained with a MAP2 rabbit polyclonal antibody (Product # PA5-17646) at 1:100 dilution (green) and a HuC/HuD mouse monoclonal antibody (Product # A-21271), at a concentration of 5 µg/mL (red) in blocking buffer for at least 1 hour at room temperature, and then incubated with goat anti-rabbit IgG secondary antibody, Alexa Fluor Plus 488 conjugate (Product # A32731, green) and a donkey anti-mouse IgG secondary antibody, Alexa Fluor 594 conjugate (Product # A-21203, red) at a dilution of 1:1000 for 1 hour at room temperature. Nuclei (blue) were stained with Hoechst 33342 dye (Product # 62249).
- Submitted by
- Invitrogen Antibodies (provider)
- Main image
- Experimental details
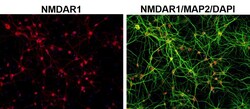
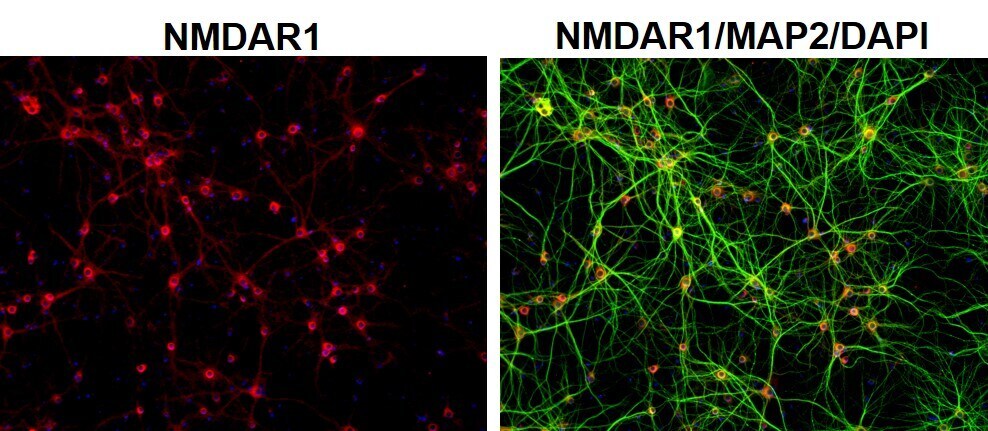
- Immunofluorescent analysis of MAP2 (green) and NMDAR1 (red) on rat primary Hippocampal neurons (E18) (Product # A15587) cultured for 28 days in the B-27 Plus Neuronal Culture System (Product # A3653401). At day 28 the cells were fixed with 4% paraformaldehyde for 15 min, permeabilized with 0.1% triton x-100 for 30min, and blocked with 1% BSA for 30 min at room temperature. Cells were stained with anti-NMDAR1 antibody (Product # 32-0500) at a dilution of 1:100, and anti-MAP2 (Product # PA5-17646) at a dilution of1:250, in 1% BSA staining buffer, overnight at 4C, and then incubated with Alexa Fluor 488 conjugated donkey anti-rabbit (Product # A-21206) and Alexa Fluor 594 donkey anti-mouse (Product # A-21203) antibodies at a dilution of 1:1000 for 30 min. at room temp. Wash 3 times with DPBS. Stain with DAPI for nucleus.
- Submitted by
- Invitrogen Antibodies (provider)
- Main image
- Experimental details
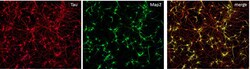
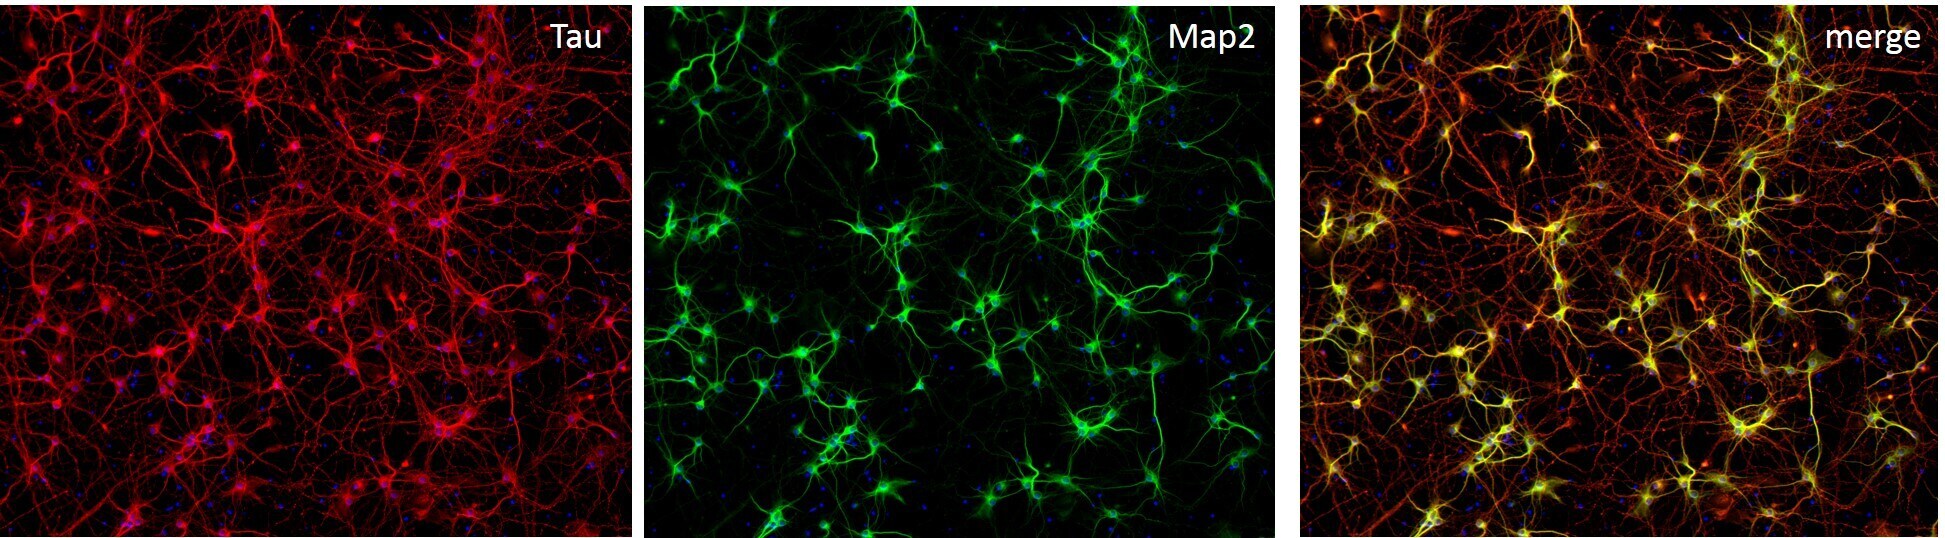
- Immunofluorescent staining of MAP2 (Green) and Tau (red) on Primary Rat Cortex neurons (E18) (Product # A1084001) cultured for 14 days in the B-27 Plus Neuronal Culture System (Product # A3653401). At day 14 the cells were fixed with 4% paraformaldehyde for 15 min, permeabilized with 0.1% Triton X-100 for 30 min, and blocked with 1% BSA for 30 min at room temperature. Cells were stained with a MAP2 rabbit polyclonal antibody (Product # PA5-17646) at a dilution of 1:250, and a Tau mouse monoclonal antibody clone T46 (Product # 13-6400) at a dilution of 1:100 in 1% BSA staining buffer, overnight at 4C, and then incubated with Alexa Fluor secondary antibodies 488 donkey anti-rabbit (Product # A-21206) and 594 donkey anti-mouse (Product # A-21203) at a dilution of 1:1000 for 30 minutes at room temperature. Wash 3 times with DPBS. Stain with DAPI.
- Submitted by
- Invitrogen Antibodies (provider)
- Main image

- Experimental details
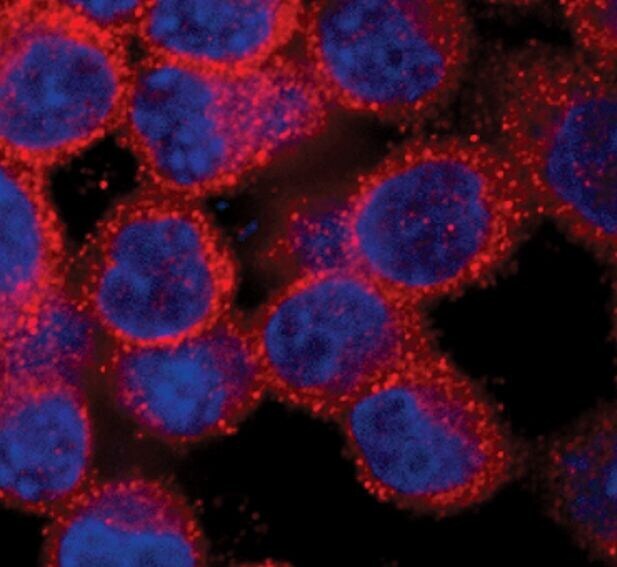
- Immunofluorescent analysis of MAP2 in PC-12 cells using a MAP2 polyclonal antibody (Product # PA5-17646) (red) showing cytoplasmic staining. DNA is labeled using a fluorescent blue dye.
- Submitted by
- Invitrogen Antibodies (provider)
- Main image

- Experimental details
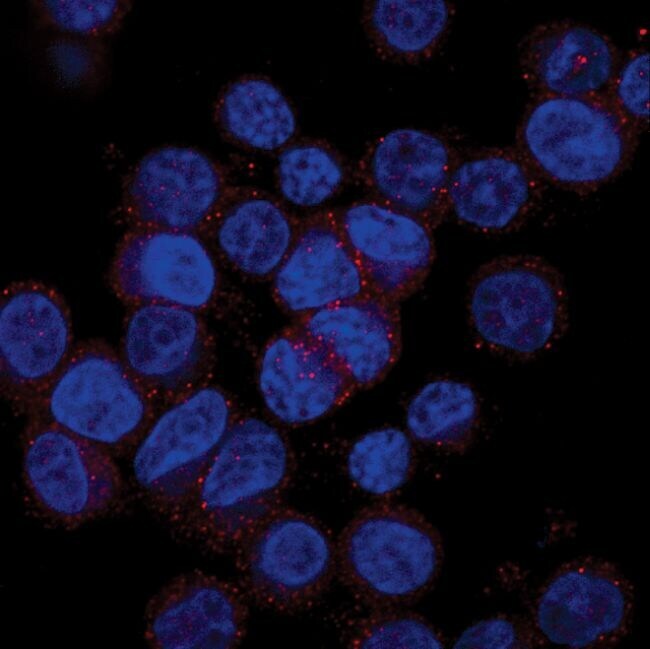
- Immunofluorescent analysis of MAP2 using a polyclonal antibody (Product # PA5-17646).
- Submitted by
- Invitrogen Antibodies (provider)
- Main image
- Experimental details
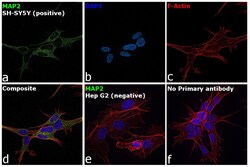
- Immunofluorescence analysis of MAP2 was performed using 70% confluent log phase SH-SY5Y cells. The cells were fixed with 4% paraformaldehyde for 10 minutes, permeabilized with 0.1% Triton™ X-100 for 15 minutes, and blocked with 2% BSA for 45 minutes at room temperature. The cells were labeled with MAP2 Polyclonal Antibody (Product # PA5-17646) at 1:100 dilution in 0.1% BSA, incubated at 4 degree celsius overnight and then labeled with Donkey anti-Rabbit IgG (H+L) Highly Cross-Adsorbed Secondary Antibody, Alexa Fluor Plus 488 (Product # A32790, 1:2000 dilution), for 45 minutes at room temperature (Panel a: Green). Nuclei (Panel b: Blue) were stained with ProLong™ Diamond Antifade Mountant with DAPI (Product # P36962). F-actin (Panel c: Red) was stained with Rhodamine Phalloidin (Product # R415, 1:300 dilution). Panel d represents the merged image showing cytoplasmic localization. Panel e represents Hep G2 cells having no expression of MAP2. Panel f represents control cells with no primary antibody to assess background. The images were captured at 60X magnification.

Supportive validation
- Submitted by
- Invitrogen Antibodies (provider)
- Main image
- Experimental details
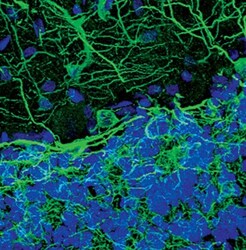
- Immunofluorescent analysis of MAP2 in rat cerebellum using a MAP2 polyclonal antibody (Product # PA5-17646) (green). DNA is labeled using a fluorescent blue dye.
- Submitted by
- Invitrogen Antibodies (provider)
- Main image

- Experimental details
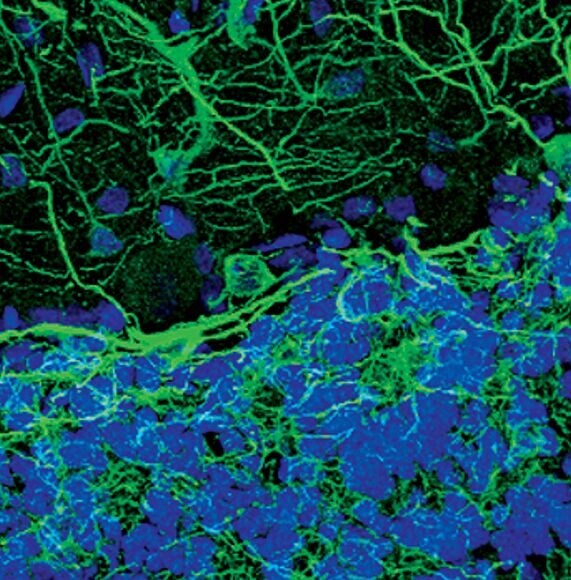
- Immunofluorescent analysis of MAP2 in rat hippocampus using a MAP2 polyclonal antibody (Product # PA5-17646) (green). DNA is labeled using a fluorescent blue dye.
- Submitted by
- Invitrogen Antibodies (provider)
- Main image

- Experimental details
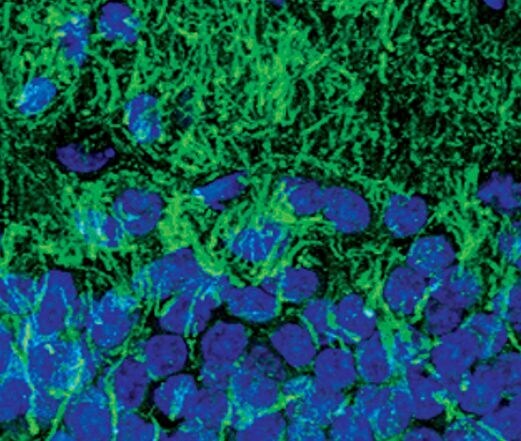
- Immunofluorescent analysis of MAP2 in rat spinal cord using a MAP2 polyclonal antibody (Product # PA5-17646) (green). DNA is labeled using a fluorescent blue dye.

Supportive validation
- Submitted by
- Invitrogen Antibodies (provider)
- Main image

- Experimental details
- NULL
- Submitted by
- Invitrogen Antibodies (provider)
- Main image

- Experimental details
- Figure 1 SARS-CoV-2 infection of mouse neuronal cultures. K18-hACE2 (hACE2 neurons) and non-hACE2-carrier (NC neurons) were prepared from one-day-old pups and cultured for seven days for differentiation. ( A ) hACE2 (blue bars) and NC neurons (red bars) were infected with SARS-CoV-2 at a MOI of 0.1. Virus infectivity titers in the supernatants were measured using a plaque formation assay and are expressed as plaque-forming units (PFU)/mL. ( B ) Intracellular viral RNA copies were determined by qRT-PCR. The data are expressed as genome copies/ug of RNA. Values are the mean +- SEM of three independent infection experiments conducted in duplicate. Each data point represents an independent experiment. ( C ) The hACE2 neurons grown on coverslips were fixed at 48 h after infection and stained with anti-MAP2 (red), dsRNA (green) and DAPI (blue) antibodies. In the bottom row of panels, the boxed areas from the first row are expanded. The images shown are representative of three independent infection experiments, with 20x magnification.

- Submitted by
- Invitrogen Antibodies (provider)
- Main image

- Experimental details
- 1 FIGURE CRISPR-mediated knock-in of AKAP9 I2558 M mutation in SH-SY5Y P301L cells and neuronal differentiation. (a) The scheme of generating AKAP9 I2558 M mutation by CRISPR/Cas9-mediated knock-in. The original nucleotide A-T was replaced with the donor sequence expressing G-C. (b) Sanger sequencing of SH-SY5Y P301L cell line and the knock-in of AKAP9 I2558 M mutation. The red rectangles show targeted sequences. (c) Timetable of SH-SY5Y cells differentiation into neuronal cells. FBS, fetal bovine serum; RA, retinoic acid; BDNF, brain-derived neurotrophic factor; db-cAMP, dibutyryl cyclic AMP. (d) Bright field images of undifferentiated and differentiated SH-SY5Y cells. Undifferentiated SH-SY5Y cells have a flat phenotype with few projections while differentiated SH-SY5Y neurons demonstrate extensive and elongated neuritic projections. Scale bar, 100 mum. (e) Representative immunofluorescent images of fully differentiated SH-SY5Y cells by staining with neuronal-specific marker MAP2 in AKAP9 WT and AKAP9 I2558 M group. Scale bar, 75 mum

- Submitted by
- Invitrogen Antibodies (provider)
- Main image
- Experimental details
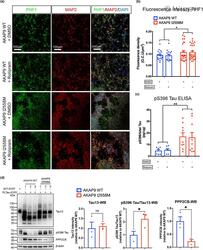
- 2 FIGURE AKAP9 I2558 M mutation significantly enhances tau phosphorylation level in SH-SY5Y P301L neurons. (a) Representative images of rolipram-treated and untreated SH-SY5Y neurons with AKAP9 WT and AKAP9 I2558 M by immunostaining for p-tau with PHF1 (Ser396/Ser404) antibody and neuronal marker with MAP2 antibody. Scale bar, 100 mum. (b) Quantification of the fluorescence intensity of PHF1 positive staining in AKAP9 WT and AKAP9 I2558 M group. N = 3 independent experiments. (c) Levels of pS396 Tau/total Tau in AKAP9 WT and AKAP9 I2558 M group measured by quantitative ELISA. N = 3 independent experiments. Data are presented as the mean +-SEM, * p < 0.05, ** p < 0.01, using two-way ANOVA to compare between the groups with two factors ( AKAP9 genotype and rolipram treatment). (d) Western blotting analysis of tau and related proteins in AKAP9 WT and I2558 M cells. Band intensity was normalized by beta-actin. N = 3 replicates. PPP2CB, protein phosphatase 2 catalytic subunit beta. Data are presented as the mean +-SEM, ns, no significance, * p < 0.05, using unpaired t test
