 Explore
 Validate
 Learn
Learn Western blot
 Immunohistochemistry
Antibody data
- Antibody Data
- Antigen structure
- References [14]
- Comments [0]
- Validations
- Western blot [2]
- Immunocytochemistry [3]
- Other assay [7]
Submit
Validation data
Reference
Comment
Report error
- Product number
- PA1-10005 - Provider product page

- Provider
- Invitrogen Antibodies
- Product name
- MAP2 Polyclonal Antibody
- Antibody type
- Polyclonal
- Antigen
- Recombinant full-length protein
- Description
- PA1-10005 was raised against recombinant constructs of the entire human projection domain, and so recognizes only the high molecular MAP2 forms, MAP2A and MAP2B.| For long term storage, store at 4°C.
- Reactivity
- Human, Mouse, Rat
- Host
- Chicken/Avian
- Isotype
- IgY
- Vial size
- 50 µL
- Concentration
- Conc. Not Determined
- Storage
- 4° C
Submitted references Human iPSC Modeling of Genetic Febrile Seizure Reveals Aberrant Molecular and Physiological Features Underlying an Impaired Neuronal Activity.
Chemical phenotypes of intrinsic cardiac neurons in the newborn pig (Sus scrofa domesticus Erxleben, 1777).
Autism Spectrum Disorder Risk Factor Met Regulates the Organization of Inhibitory Synapses.
Delivering progranulin to neuronal lysosomes protects against excitotoxicity.
The LRRK2 G2019S mutation alters astrocyte-to-neuron communication via extracellular vesicles and induces neuron atrophy in a human iPSC-derived model of Parkinson's disease.
Precise Ultrasound Neuromodulation in a Deep Brain Region Using Nano Gas Vesicles as Actuators.
A peptide inhibitor of Tau-SH3 interactions ameliorates amyloid-β toxicity.
Targeted Neurostimulation in Mouse Brains with Non-invasive Ultrasound.
Imaging of the Axon Initial Segment.
Loss of tau and Fyn reduces compensatory effects of MAP2 for tau and reveals a Fyn-independent effect of tau on calcium.
Tau interacts with SHP2 in neuronal systems and in Alzheimer's disease brains.
Three-dimensional (3D) tetra-culture brain on chip platform for organophosphate toxicity screening.
Zika Virus Infects Intermediate Progenitor Cells and Post-mitotic Committed Neurons in Human Fetal Brain Tissues.
Genetic and morphological features of human iPSC-derived neurons with chromosome 15q11.2 (BP1-BP2) deletions.
Scalise S, Zannino C, Lucchino V, Lo Conte M, Scaramuzzino L, Cifelli P, D'Andrea T, Martinello K, Fucile S, Palma E, Gambardella A, Ruffolo G, Cuda G, Parrotta EI
Biomedicines 2022 May 5;10(5)
Biomedicines 2022 May 5;10(5)
Chemical phenotypes of intrinsic cardiac neurons in the newborn pig (Sus scrofa domesticus Erxleben, 1777).
Ragauskas T, Rysevaite-Kyguoliene K, Pauziene N, Inokaitis H, Pauza DH
Journal of morphology 2022 Jan;283(1):51-65
Journal of morphology 2022 Jan;283(1):51-65
Autism Spectrum Disorder Risk Factor Met Regulates the Organization of Inhibitory Synapses.
Jeckel P, Kriebel M, Volkmer H
Frontiers in molecular neuroscience 2021;14:659856
Frontiers in molecular neuroscience 2021;14:659856
Delivering progranulin to neuronal lysosomes protects against excitotoxicity.
Davis SE, Roth JR, Aljabi Q, Hakim AR, Savell KE, Day JJ, Arrant AE
The Journal of biological chemistry 2021 Sep;297(3):100993
The Journal of biological chemistry 2021 Sep;297(3):100993
The LRRK2 G2019S mutation alters astrocyte-to-neuron communication via extracellular vesicles and induces neuron atrophy in a human iPSC-derived model of Parkinson's disease.
de Rus Jacquet A, Tancredi JL, Lemire AL, DeSantis MC, Li WP, O'Shea EK
eLife 2021 Sep 30;10
eLife 2021 Sep 30;10
Precise Ultrasound Neuromodulation in a Deep Brain Region Using Nano Gas Vesicles as Actuators.
Hou X, Qiu Z, Xian Q, Kala S, Jing J, Wong KF, Zhu J, Guo J, Zhu T, Yang M, Sun L
Advanced science (Weinheim, Baden-Wurttemberg, Germany) 2021 Nov;8(21):e2101934
Advanced science (Weinheim, Baden-Wurttemberg, Germany) 2021 Nov;8(21):e2101934
A peptide inhibitor of Tau-SH3 interactions ameliorates amyloid-β toxicity.
Rush T, Roth JR, Thompson SJ, Aldaher AR, Cochran JN, Roberson ED
Neurobiology of disease 2020 Feb;134:104668
Neurobiology of disease 2020 Feb;134:104668
Targeted Neurostimulation in Mouse Brains with Non-invasive Ultrasound.
Qiu Z, Kala S, Guo J, Xian Q, Zhu J, Zhu T, Hou X, Wong KF, Yang M, Wang H, Sun L
Cell reports 2020 Aug 18;32(7):108033
Cell reports 2020 Aug 18;32(7):108033
Imaging of the Axon Initial Segment.
Di Re J, Kayasandik C, Botello-Lins G, Labate D, Laezza F
Current protocols in neuroscience 2019 Sep;89(1):e78
Current protocols in neuroscience 2019 Sep;89(1):e78
Loss of tau and Fyn reduces compensatory effects of MAP2 for tau and reveals a Fyn-independent effect of tau on calcium.
Liu G, Thangavel R, Rysted J, Kim Y, Francis MB, Adams E, Lin Z, Taugher RJ, Wemmie JA, Usachev YM, Lee G
Journal of neuroscience research 2019 Nov;97(11):1393-1413
Journal of neuroscience research 2019 Nov;97(11):1393-1413
Tau interacts with SHP2 in neuronal systems and in Alzheimer's disease brains.
Kim Y, Liu G, Leugers CJ, Mueller JD, Francis MB, Hefti MM, Schneider JA, Lee G
Journal of cell science 2019 Jul 15;132(14)
Journal of cell science 2019 Jul 15;132(14)
Three-dimensional (3D) tetra-culture brain on chip platform for organophosphate toxicity screening.
Koo Y, Hawkins BT, Yun Y
Scientific reports 2018 Feb 12;8(1):2841
Scientific reports 2018 Feb 12;8(1):2841
Zika Virus Infects Intermediate Progenitor Cells and Post-mitotic Committed Neurons in Human Fetal Brain Tissues.
Lin MY, Wang YL, Wu WL, Wolseley V, Tsai MT, Radic V, Thornton ME, Grubbs BH, Chow RH, Huang IC
Scientific reports 2017 Nov 1;7(1):14883
Scientific reports 2017 Nov 1;7(1):14883
Genetic and morphological features of human iPSC-derived neurons with chromosome 15q11.2 (BP1-BP2) deletions.
Das DK, Tapias V, D'Aiuto L, Chowdari KV, Francis L, Zhi Y, Ghosh BA, Surti U, Tischfield J, Sheldon M, Moore JC, Fish K, Nimgaonkar V
Molecular neuropsychiatry 2015 Jul;1(2):116-123
Molecular neuropsychiatry 2015 Jul;1(2):116-123
No comments: Submit comment
Supportive validation
- Submitted by
- Invitrogen Antibodies (provider)
- Main image

- Experimental details
- Western blot analysis of MAP2 in whole brain tissue lysates using a MAP2 polyclonal antibody (Product # PA1-10005) at a dilution of 1:50,000 as seen in green. 1) protein standard (red), 2) adult rat brain, 3) embryonic E20 rat brain, 4) adult mouse brain. Strong band at ~280 kDa mark corresponds to two major isoforms of MAP2 protein referred to as MAP2A and MAP2B. Smaller fragments of these isoforms are also detected if the antibody is used at higher concentrations.

- Submitted by
- Invitrogen Antibodies (provider)
- Main image

- Experimental details
- Western blot was performed using Anti-MAP2 Polyclonal Antibody (Product # PA1-10005) and a 160 kDa band corresponding to MAP2 was observed across Mouse Brain and Rat Brain and not in Mouse Heart and Mouse Skeletal Muscle. Tissue extracts (30 µg lysate) of Mouse Heart (Lane 1), Mouse Skeletal Muscle (Lane 2), Mouse Brain (Lane 3) and Rat Brain (Lane 4) were electrophoresed using NuPAGE™ 4-12% Bis-Tris Protein Gel (Product # NP0322BOX). Resolved proteins were then transferred onto a Nitrocellulose membrane (Product # IB23001) by iBlot® 2 Dry Blotting System (Product # IB21001). The blot was probed with the primary antibody (1:10000 dilution) and detected by chemiluminescence with Goat anti-Chicken IgY H+L Secondary Antibody, HRP (Product # A16054, 1:4000 dilution) using the iBright FL 1000 (Product # A32752). Chemiluminescent detection was performed using SuperSignal™ West Dura Extended Duration Substrate (Product # 34076).

Supportive validation
- Submitted by
- Invitrogen Antibodies (provider)
- Main image
- Experimental details
- Immunofluorescent analysis of MAP2 using a polyclonal antibody (Product # PA1-10005).

- Submitted by
- Invitrogen Antibodies (provider)
- Main image
- Experimental details
- Immunofluorescent analysis of MAP2 using a polyclonal antibody (Product # PA1-10005).

- Submitted by
- Invitrogen Antibodies (provider)
- Main image
- Experimental details
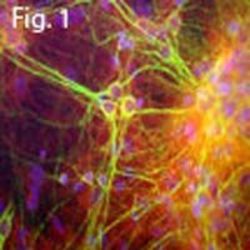
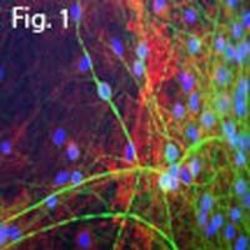
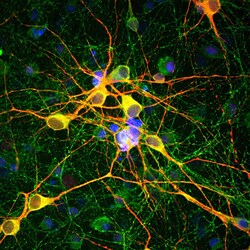
- Immunofluorescent analysis of MAP2 in cortical neuron-glial cell culture. The culture was prepared from an E20 rat and stained using a MAP2 polyclonal antibody (Product # PA1-10005) at a dilution of 1:10,000 as seen in red, and a MAP-tau monoclonal antibody at a dilution of 1:2,000 as seen in green, and with DAPI staining the nuclear DNA in blue. The MAP2 antibody stains dendrites and perikarya of neurons, while the antibody to MAP-tau labels neuronal perikarya, dendrites and also axonal processes. As a result perikarya and dendrites appear orange-yellow, since they contain both MAP2 and tau, while axons are green.

Supportive validation
- Submitted by
- Invitrogen Antibodies (provider)
- Main image

- Experimental details
- NULL

- Submitted by
- Invitrogen Antibodies (provider)
- Main image

- Experimental details
- Figure 1 Met colocalizes with gephyrin and PSD95. Slices prepared from the dentate gyrus or hippocampal neurons were stained for the nuclear stain Hoechst, Met, gephyrin and PSD95 and submitted to confocal fluorescence microscopy. For overview, images of hippocampal neurons (A,B) or the granule cell layer of dentate gyrus (C,D) were stained with antibodies for MAP2 and Hoechst. Scale bar 20 mum. Insets in panels (A-D) are magnified in (A'-A""',B'-B""',C'-C""',D'-D""') . Scale bar 10 mum. (A'-D') : Met staining, (A""-D"") : gephyrin or PSD95 staining as indicated, (A""'-D""') : merged images of the respective representations in (A'-A"",B'-B"",C'-C"",D'-D"") . Arrow heads indicate colocalizing spots at the corresponding locations. (E) 20 mum 3 cubes representative of the granule cell layer (GC layer), proximal (proximal ML) and distal molecular layer (distal ML) of the dentate gyrus were analyzed for the percentage of gephyrin clusters colocalizing with Met. n = 11 for all groups. Error bars: SEM.

- Submitted by
- Invitrogen Antibodies (provider)
- Main image

- Experimental details
- Figure 8. LRRK2 G2019S astrocytes affect the viability and morphology of dopaminergic neurons. ( A ) Confocal images showing neurons labeled by immunofluorescence with the pan-neuronal and dendrite marker MAP2 (red), the marker for dopaminergic neurons TH (green), and the merged images (MAP2, red, and TH, green). MAP2: microtubule-associated protein 2; TH: tyrosine hydroxylase. ( B-F ) Quantification of neuron viability (number of dopaminergic neurons remaining in culture) ( B ), average dendrite length ( C, E ), and dendrite length distribution ( D, F ) after 14 days in culture with WT or LRRK2 G2019S isogenic ( B-D ) or non-isogenic ( E, F ) astrocytes. Viability data are from five ( B, D ) independent biological replicates, and at least 500 neurons were counted per experimental condition and biological replicate. WT and 530 LRRK2 G2019S neurons were counted ( B ). Dendrite length data are from three independent biological replicates, and more than 300 ( E, F ) or 500 ( C, D ) neurites were measured for each experimental condition. ( G ) Confocal images showing WT mouse primary neurons co-cultured with WT or LRRK2 G2019S mouse primary astrocytes. Neurons are labeled by immunofluorescence and images show MAP2 (red), TH (green), and the merged images (MAP2, red, and TH, green). White arrowheads mark TH + /MAP2 + dopaminergic neurons. ( H, I ) The cells were scored for TH + /MAP2 + dopaminergic ( H ) or TH - /MAP2 + non-dopaminergic neuron survival ( I ) after 14 days co-cultu

- Submitted by
- Invitrogen Antibodies (provider)
- Main image

- Experimental details
- Figure 2 GVs enable low-intensity ultrasound to stimulate activity in primary neurons. a) Schematic illustration of the GV-mediated ultrasound setup for recording cells. GVs were mixed into cell culture medium. Cellular response upon US+GVs stimulation was observed in real time. b) Representative images of GCaMP6s fluorescence in primary neurons with or without GVs, before and after 0.20 MPa ultrasound. c) Ca 2+ imaging time course of neurons in (b). Delta F / F 0 : the change in fluorescence/initial baseline. d) Ca 2+ response of neurons to stimulation by 0.20 MPa ultrasound. Bars represent mean +- SD from three independent experiments. **** p < 0.0001, two-tailed unpaired t -test. e) Time-resolved Ca 2+ responses of neurons stimulated by five ultrasound pulses at varying intervals. f) Ca 2+ response of cells to varying GV concentrations, 0.20 MPa ultrasound. Bars represent mean +- SEM of three independent experiments. * p < 0.05, **** p < 0.0001, two-tailed unpaired t -test with Holm-Sidak correction. g) Ca 2+ response of cells to varying ultrasound intensities, 0.8 n m GVs. Bars represent mean +- SEM of three independent experiments. * p < 0.05, ** p < 0.01, *** p < 0.001, **** p < 0.0001, two-tailed unpaired t -test with Holm-Sidak correction. h) Representative IF images of c-Fos and MAP2 staining in untreated cells (CTRL), and cells treated with the indicated combinations of ultrasound (0.20 MPa, +US) or GVs (0.8 n m , +GVs). i) Quantified results of nuclear c-Fos staini

- Submitted by
- Invitrogen Antibodies (provider)
- Main image

- Experimental details
- Figure 4 GVs enable efficient and non-invasive ultrasound stimulation of a deep brain region in vivo. a) Schematic showing the hSyn-GCaMP6s virus delivery, GVs or saline injection, fiber implantation and ultrasound stimulation in the mouse brain. b) Confocal images of hSyn-GCaMP6s expression in the mouse VTA. c) Representative GCaMP6s fluorescence traces in the VTA of the anaesthetized mice in the presence of saline or GVs, before and after US (0.08 MPa peak pressure, 300 us pulse width, 1 kHz PRF, 3 s burst interval). Light blue rectangle bars indicate ultrasound pulses. d) Averaged GCaMP6s fluorescence traces in the VTA of the anesthetized saline mice and GVs mice in response to ultrasound stimulation. n = 5 for both groups. e) Average peak Ca 2+ activity in saline mice and GVs mice respond to different parameter ultrasound stimulation (300 or 500 us pulse width, 0.08 MPa, 1 kHz PRF, 3 s burst interval). n = 5 mice in saline group, n = 5 mice in GVs group. *** P < 0.001, unpaired 2-tailed t -tests. Data are shown as mean +- SD. f) The latency between ultrasonic stimulation of specified pulse widths (300 or 500 us pulse width) and detection of an above-threshold response. n = 5 mice in saline group, n = 5 mice in GVs group. ** P < 0.01, unpaired 2-tailed t -tests. Data are shown as mean +- SD. g) Schematic illustration of our GVs/saline injection and ultrasound stimulation plan. Briefly, mice at 8 weeks were embedded with cannulas in their VTA, and 1 week later, they were tr

- Submitted by
- Invitrogen Antibodies (provider)
- Main image

- Experimental details
- Characterization of idNs. ( A ) Representation of Na V 1.1 channel. The star in segment 1 of domain I shows the localization of the mutated aminoacid (Met145Thr). The relative missense mutation c.434T > C is found in the exon 3 of the translated sequence. ( B ) Bright-field images of idNs from WT and SCN1A M145T -iPSCs (20x magnification). ( C ) Differentiated idNs show high expression levels of neuronal specific genes such as MAP2 , NEFM , NEFL, SYP and PSD95 compared to their undifferentiated counterparts (iPSCs). GAPDH was used as a housekeeping control. Data are presented as mean +- SEM of three biological replicates (black dots), * p < 0.05, ** p < 0.01, *** p < 0.001, t -test has been calculated vs. expression in iPSCs. ( D ) Immunostaining of neuronal markers TUBB3 (neurites marker), MAP2 (cell body and dendrites marker), and NEFH (axonal marker) in WT and SCN1A M145T idNs. DAPI nuclear counterstain is shown in all images in blue (63x magnification).

- Submitted by
- Invitrogen Antibodies (provider)
- Main image
- Experimental details
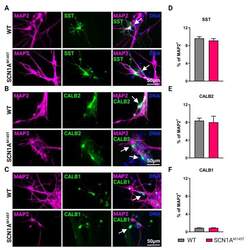
- Types of interneurons generated from iPSCs. Immunofluorescence analysis of idNs stained with antibodies against interneuronal subtypes markers ( A ) somatostatin (SST), ( B ) calretinin (CALB2), and ( C ) calbindin (CALB1). In each group of images, WT cells are shown in the upper panel, while SCN1A M145T idNs are shown in the lower panel. White arrows in the merged images indicate neurons expressing the interneuronal makers indicated (63x magnification). ( D - F ) Quantification of percentage of MAP2 + neurons co-expressing interneuronal markers immunostained in panels ( A - C ). About 9-1% of idNs express SST and CALB2, while CALB1 is present in less than 1% percent of neurons. At least 200 cells were counted for each bar, and data are presented as mean +- SEM of two independent experiments.
