Explore
 Validate
 Learn
Learn Western blot
 ELISA
ELISA Immunocytochemistry
Antibody data
- Antibody Data
- Antigen structure
- References [7]
- Comments [0]
- Validations
- Immunocytochemistry [2]
- Flow cytometry [1]
- Other assay [2]
Submit
Validation data
Reference
Comment
Report error
- Product number
- 36-0700 - Provider product page

- Provider
- Invitrogen Antibodies
- Product name
- PEBP1 Polyclonal Antibody
- Antibody type
- Polyclonal
- Antigen
- Synthetic peptide
- Reactivity
- Human, Mouse, Rat
- Host
- Rabbit
- Isotype
- IgG
- Vial size
- 100 μg
- Concentration
- 0.25 mg/mL
- Storage
- -20°C
Submitted references Phospholipid remodeling is critical for stem cell pluripotency by facilitating mesenchymal-to-epithelial transition.
Mapping protein interactions of sodium channel Na(V)1.7 using epitope-tagged gene-targeted mice.
Effects of Raf kinase inhibitor protein expression on pancreatic cancer cell growth and motility: an in vivo and in vitro study.
Polycomb protein EZH2 regulates tumor invasion via the transcriptional repression of the metastasis suppressor RKIP in breast and prostate cancer.
Raf kinase inhibitor protein positively regulates cell-substratum adhesion while negatively regulating cell-cell adhesion.
Rituximab (chimeric anti-CD20 monoclonal antibody) inhibits the constitutive nuclear factor-{kappa}B signaling pathway in non-Hodgkin's lymphoma B-cell lines: role in sensitization to chemotherapeutic drug-induced apoptosis.
Inhibition of the Raf-MEK1/2-ERK1/2 signaling pathway, Bcl-xL down-regulation, and chemosensitization of non-Hodgkin's lymphoma B cells by Rituximab.
Wu Y, Chen K, Xing G, Li L, Ma B, Hu Z, Duan L, Liu X
Science advances 2019 Nov;5(11):eaax7525
Science advances 2019 Nov;5(11):eaax7525
Mapping protein interactions of sodium channel Na(V)1.7 using epitope-tagged gene-targeted mice.
Kanellopoulos AH, Koenig J, Huang H, Pyrski M, Millet Q, Lolignier S, Morohashi T, Gossage SJ, Jay M, Linley JE, Baskozos G, Kessler BM, Cox JJ, Dolphin AC, Zufall F, Wood JN, Zhao J
The EMBO journal 2018 Feb 1;37(3):427-445
The EMBO journal 2018 Feb 1;37(3):427-445
Effects of Raf kinase inhibitor protein expression on pancreatic cancer cell growth and motility: an in vivo and in vitro study.
Dai H, Chen H, Liu W, You Y, Tan J, Yang A, Lai X, Bie P
Journal of cancer research and clinical oncology 2016 Oct;142(10):2107-17
Journal of cancer research and clinical oncology 2016 Oct;142(10):2107-17
Polycomb protein EZH2 regulates tumor invasion via the transcriptional repression of the metastasis suppressor RKIP in breast and prostate cancer.
Ren G, Baritaki S, Marathe H, Feng J, Park S, Beach S, Bazeley PS, Beshir AB, Fenteany G, Mehra R, Daignault S, Al-Mulla F, Keller E, Bonavida B, de la Serna I, Yeung KC
Cancer research 2012 Jun 15;72(12):3091-104
Cancer research 2012 Jun 15;72(12):3091-104
Raf kinase inhibitor protein positively regulates cell-substratum adhesion while negatively regulating cell-cell adhesion.
Mc Henry KT, Montesano R, Zhu S, Beshir AB, Tang HH, Yeung KC, Fenteany G
Journal of cellular biochemistry 2008 Feb 15;103(3):972-85
Journal of cellular biochemistry 2008 Feb 15;103(3):972-85
Rituximab (chimeric anti-CD20 monoclonal antibody) inhibits the constitutive nuclear factor-{kappa}B signaling pathway in non-Hodgkin's lymphoma B-cell lines: role in sensitization to chemotherapeutic drug-induced apoptosis.
Jazirehi AR, Huerta-Yepez S, Cheng G, Bonavida B
Cancer research 2005 Jan 1;65(1):264-76
Cancer research 2005 Jan 1;65(1):264-76
Inhibition of the Raf-MEK1/2-ERK1/2 signaling pathway, Bcl-xL down-regulation, and chemosensitization of non-Hodgkin's lymphoma B cells by Rituximab.
Jazirehi AR, Vega MI, Chatterjee D, Goodglick L, Bonavida B
Cancer research 2004 Oct 1;64(19):7117-26
Cancer research 2004 Oct 1;64(19):7117-26
No comments: Submit comment
Supportive validation
- Submitted by
- Invitrogen Antibodies (provider)
- Main image
- Experimental details
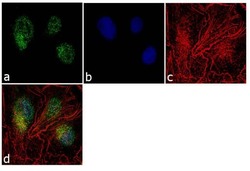
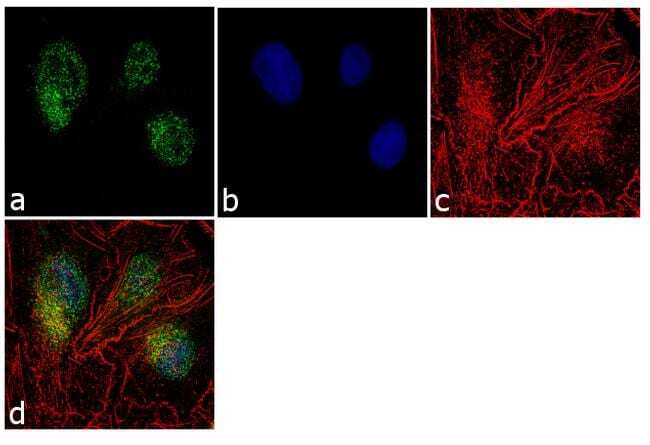
- Immunofluorescence analysis of RKIP (N-term) was performed using 70% confluent log phase Hep G2 cells. The cells were fixed with 4% paraformaldehyde for 10 minutes, permeabilized with 0.1% Triton™ X-100 for 10 minutes, and blocked with 1% BSA for 1 hour at room temperature. The cells were labeled with PEBP1 Rabbit Polyclonal Antibody (Product # 36-0700) at 2µg/mL in 0.1% BSA and incubated for 3 hours at room temperature and then labeled with Goat anti-Rabbit IgG (H+L) Superclonal™ Secondary Antibody, Alexa Fluor® 488 conjugate (Product # A27034) at a dilution of 1:2000 for 45 minutes at room temperature (Panel a: green). Nuclei (Panel b: blue) were stained with SlowFade® Gold Antifade Mountant with DAPI (Product # S36938). F-actin (Panel c: red) was stained with Alexa Fluor® 555 Rhodamine Phalloidin (Product # R415, 1:300). Panel d represents the merged image showing cytoplasmic and nuclear localization. Panel e shows the no primary antibody control. The images were captured at 60X magnification.

- Submitted by
- Invitrogen Antibodies (provider)
- Main image
- Experimental details
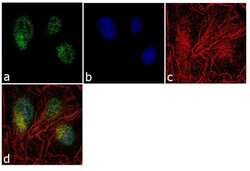
- Immunofluorescence analysis of RKIP (N-term) was performed using 70% confluent log phase Hep G2 cells. The cells were fixed with 4% paraformaldehyde for 10 minutes, permeabilized with 0.1% Triton™ X-100 for 10 minutes, and blocked with 1% BSA for 1 hour at room temperature. The cells were labeled with PEBP1 Rabbit Polyclonal Antibody (Product # 36-0700) at 2µg/mL in 0.1% BSA and incubated for 3 hours at room temperature and then labeled with Goat anti-Rabbit IgG (Heavy Chain) Superclonal™ Secondary Antibody, Alexa Fluor® 488 conjugate (Product # A27034) at a dilution of 1:2000 for 45 minutes at room temperature (Panel a: green). Nuclei (Panel b: blue) were stained with SlowFade® Gold Antifade Mountant with DAPI (Product # S36938). F-actin (Panel c: red) was stained with Alexa Fluor® 555 Rhodamine Phalloidin (Product # R415, 1:300). Panel d represents the merged image showing cytoplasmic and nuclear localization. Panel e shows the no primary antibody control. The images were captured at 60X magnification.
Supportive validation
- Submitted by
- Invitrogen Antibodies (provider)
- Main image
- Experimental details
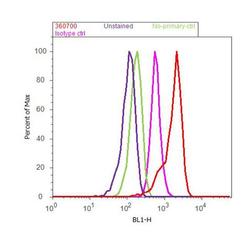
- Flow cytometry analysis of PEBP1 was done on Hep G2 cells. Cells were fixed with 70% ethanol for 10 minutes, permeabilized with 0.25% Triton™ X-100 for 20 minutes, and blocked with 5% BSA for 30 minutes at room temperature. Cells were labeled with PEBP1 Rabbit Polyclonal Antibody (360700, red histogram) or with rabbit isotype control (pink histogram) at 3-5 ug/million cells in 2.5% BSA. After incubation at room temperature for 2 hours, the cells were labeled with Alexa Fluor® 488 Goat Anti-Rabbit Secondary Antibody (A11008) at a dilution of 1:400 for 30 minutes at room temperature. The representative 10,000 cells were acquired and analyzed for each sample using an Attune® Acoustic Focusing Cytometer. The purple histogram represents unstained control cells and the green histogram represents no-primary-antibody control..
Supportive validation
- Submitted by
- Invitrogen Antibodies (provider)
- Main image
- Experimental details
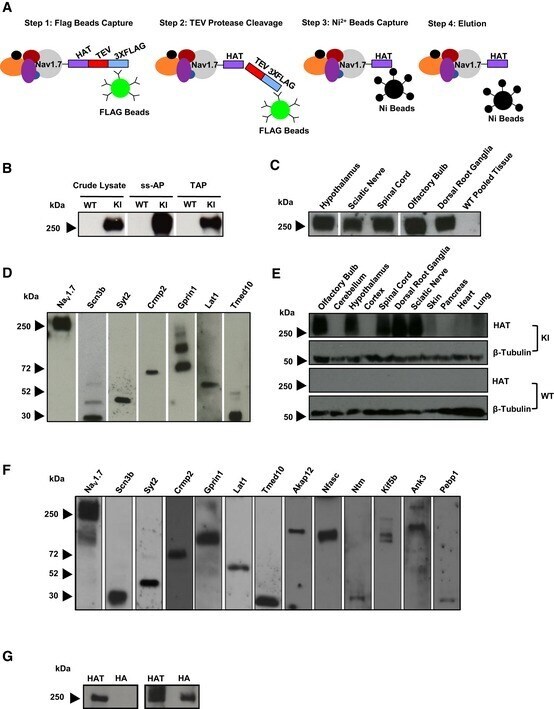
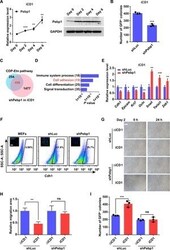
- Figure 5 Optimisation of single-step and tandem affinity purification, validation of identified protein-protein interactors and tissue expression pattern of TAP -tagged Na V 1.7 in Na V 1.7 TAP mice Schematic illustrating the affinity purification (ss-AP and TAP) procedure using the tandem affinity tags separated with a TEV cleavage site. The proteins from DRG and olfactory bulbs were extracted in 1% CHAPS lysis buffer. After single-step and tandem affinity purification, TAP-tagged Na V 1.7 was detected using Western blotting with anti-HAT antibody. The proteins from different tissues including hypothalamus, sciatic nerve, spinal cord, olfactory bulbs and DRG from KI mice, and pooled tissues from WT mice were extracted in 1% CHAPS lysis buffer. After single-step affinity purification, TAP-tagged Na V 1.7 was detected using Western blotting with anti-HAT antibody. The interaction between TAP-tagged Na V 1.7 and identified Na V 1.7 protein-protein interactors including Scn3b, Syt2, Crmp2, Gprin1, Lat1 and Tmed10 was validated using a co-immunoprecipitation in vitro system. The expression vectors containing cDNA of validated genes were cloned and transfected into a HEK293 cell line stably expressing TAP-tagged Na V 1.7. After transfection, TAP-tagged Na V 1.7 complexes were immunoprecipitated with anti-FLAG antibody, and the selected candidates were detected with their specific antibody using Western blotting. The results showed the expected sizes of Scn3b (32 kDa), Syt2 (44
- Submitted by
- Invitrogen Antibodies (provider)
- Main image
- Experimental details
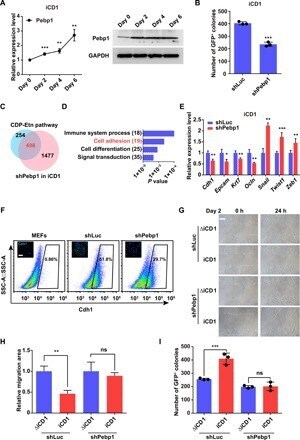
- Fig. 3 The CDP-Etn pathway acceleration of MET depends on Pebp1. ( A ) qRT-PCR analysis (left) and Western blot analysis (right) of expression of Pebp1 on days 0, 2, 4, and 6 in MEFs transduced with SKO in iCD1 medium. Data are represented as mean +- SD ( n = 3). ** P < 0.01 and *** P < 0.001. ( B ) Knockdown of Pebp1 (shPebp1) impaired reprogramming efficiency. The numbers of Oct4 -GFP + colonies were counted on day 6. Data are represented as mean +- SD ( n = 3). *** P < 0.001. ( C ) Venn diagram showing the overlap of genes regulated by the CDP-Etn pathway and Pebp1 on day 2 of SKO reprogramming. ( D ) GO analysis of genes regulated by both the CDP-Etn pathway and Pebp1 on day 2 of SKO reprogramming. ( E ) qRT-PCR analysis of expression of selected epithelial and mesenchymal genes on day 2 in MEFs transduced with SKO and shLuc or shPebp1 in iCD1 medium. Data are represented as mean +- SD ( n = 3). * P < 0.05, ** P < 0.01, and *** P < 0.001. ( F ) Flow cytometry analysis of Cdh1 in MEFs and MEFs transduced with SKO and shLuc or shPebp1 in iCD1 medium. Representative images of immunofluorescence staining of Cdh1 (green) are shown. Scale bar, 100 mum. ( G and H ) No significant differences in cell migration were observed between reprogramming in DeltaiCD1 or iCD1 medium when Pebp1 was knocked down. Representative images (G) and quantification (H) of scratch assays were analyzed on day 2. Scale bar, 100 mum. Data are represented as mean +- SEM ( n = 4). ** P < 0.01. ( I ) No si