Explore
 Validate
 Learn
Learn Western blot
 ELISA
ELISA Immunocytochemistry
Antibody data
- Antibody Data
- Antigen structure
- References [32]
- Comments [0]
- Validations
- Immunocytochemistry [2]
- Immunohistochemistry [3]
- Flow cytometry [1]
- Other assay [32]
Submit
Validation data
Reference
Comment
Report error
- Product number
- 71-3400 - Provider product page

- Provider
- Invitrogen Antibodies
- Product name
- Annexin A1 Polyclonal Antibody
- Antibody type
- Polyclonal
- Antigen
- Purifed from natural sources
- Description
- This antibody is specific for the Annexin I protein and does not cross-react with other Annexins.Reactivity with Annexin I was confirmed by western blotting using total lysates derived from human fibroblasts. Positive control lysates used: human fibroblasts, mouse kidney, mouse lung, adult rat and mouse brain.
- Reactivity
- Human, Mouse, Rat
- Host
- Rabbit
- Isotype
- IgG
- Vial size
- 100 μL
- Concentration
- Conc. Not Determined
- Storage
- -20°C
Submitted references Changes in the expression of annexin A1 in the anterior pituitary gland after ovariectomy in rats.
Interleukin-6 Signaling in Triple Negative Breast Cancer Cells Elicits the Annexin A1/Formyl Peptide Receptor 1 Axis and Affects the Tumor Microenvironment.
New insight into the role of ANXA1 in melanoma progression: involvement of stromal expression in dissemination.
Treatment with galectin-1 improves myogenic potential and membrane repair in dysferlin-deficient models.
Chronic Hyperglycemia Drives Functional Impairment of Lymphocytes in Diabetic INS(C94Y) Transgenic Pigs.
Annexin A1/Formyl Peptide Receptor Pathway Controls Uterine Receptivity to the Blastocyst.
Annexin A1 drives macrophage skewing to accelerate muscle regeneration through AMPK activation.
Annexin A1 attenuates neuroinflammation through FPR2/p38/COX-2 pathway after intracerebral hemorrhage in male mice.
Clinical Significance of ARID1A and ANXA1 in HER-2 Positive Breast Cancer.
Reduced Annexin A1 Expression Associates with Disease Severity and Inflammation in Multiple Sclerosis Patients.
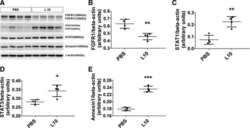
Consequences of early postnatal lipopolysaccharide exposure on developing lungs in mice.
Fusobacterium nucleatum promotes colorectal cancer by inducing Wnt/β-catenin modulator Annexin A1.
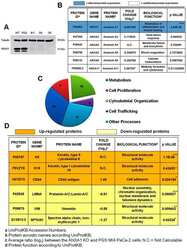
Differentially expressed proteins in positive versus negative HNSCC lymph nodes.
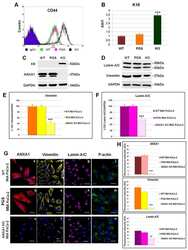
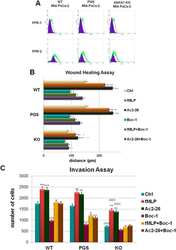
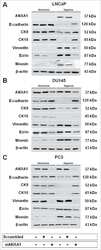
Hypoxia regulates ANXA1 expression to support prostate cancer cell invasion and aggressiveness.
Context Specificity in Causal Signaling Networks Revealed by Phosphoprotein Profiling.
Protective Aptitude of Annexin A1 in Arterial Neointima Formation in Atherosclerosis-Prone Mice-Brief Report.
Loss of ARID1A Activates ANXA1, which Serves as a Predictive Biomarker for Trastuzumab Resistance.
Macrophage activation and polarization modify P2X7 receptor secretome influencing the inflammatory process.
Annexin A1 contributes to pancreatic cancer cell phenotype, behaviour and metastatic potential independently of Formyl Peptide Receptor pathway.
Proteomic screening identifies calreticulin as a miR-27a direct target repressing MHC class I cell surface exposure in colorectal cancer.
Eicosapentaenoic acid membrane incorporation impairs ABCA1-dependent cholesterol efflux via a protein kinase A signaling pathway in primary human macrophages.
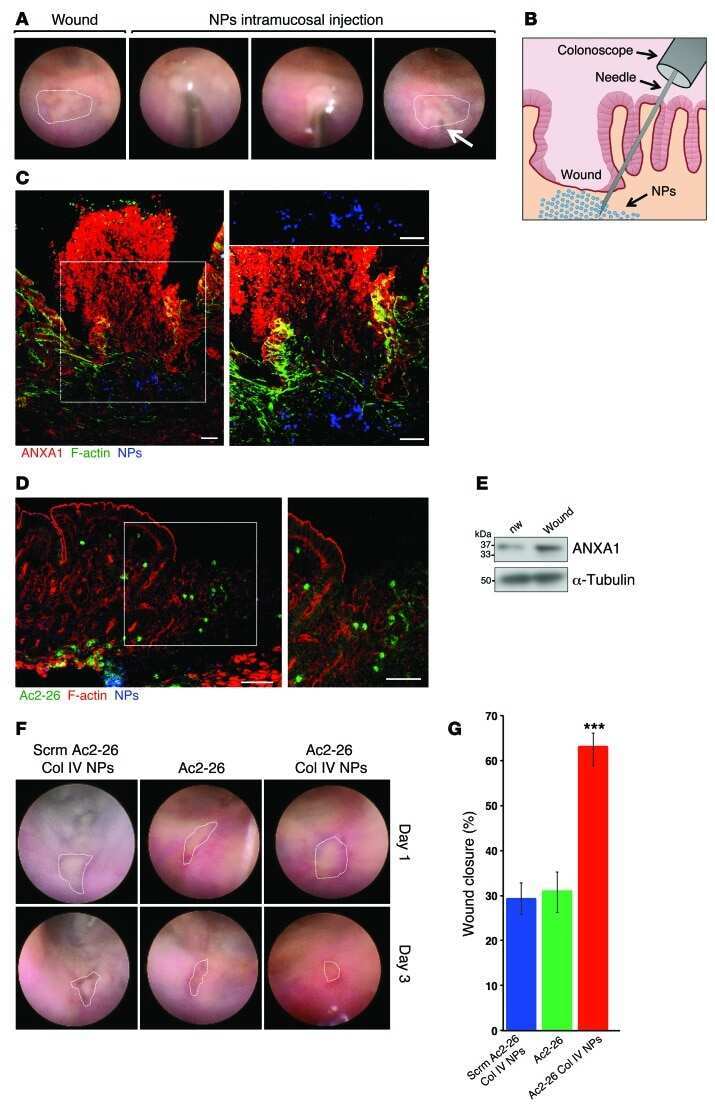
Annexin A1-containing extracellular vesicles and polymeric nanoparticles promote epithelial wound repair.
Systemic gene dysregulation in classical Galactosaemia: Is there a central mechanism?
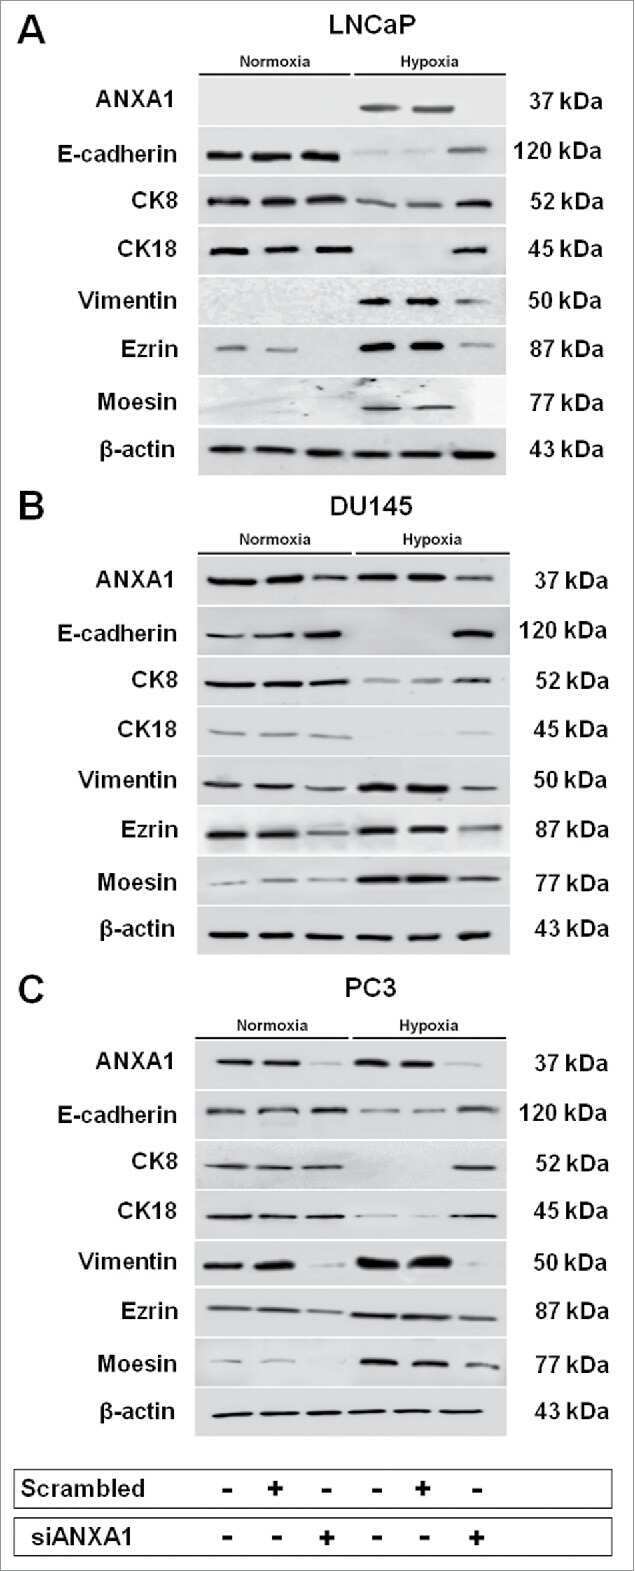
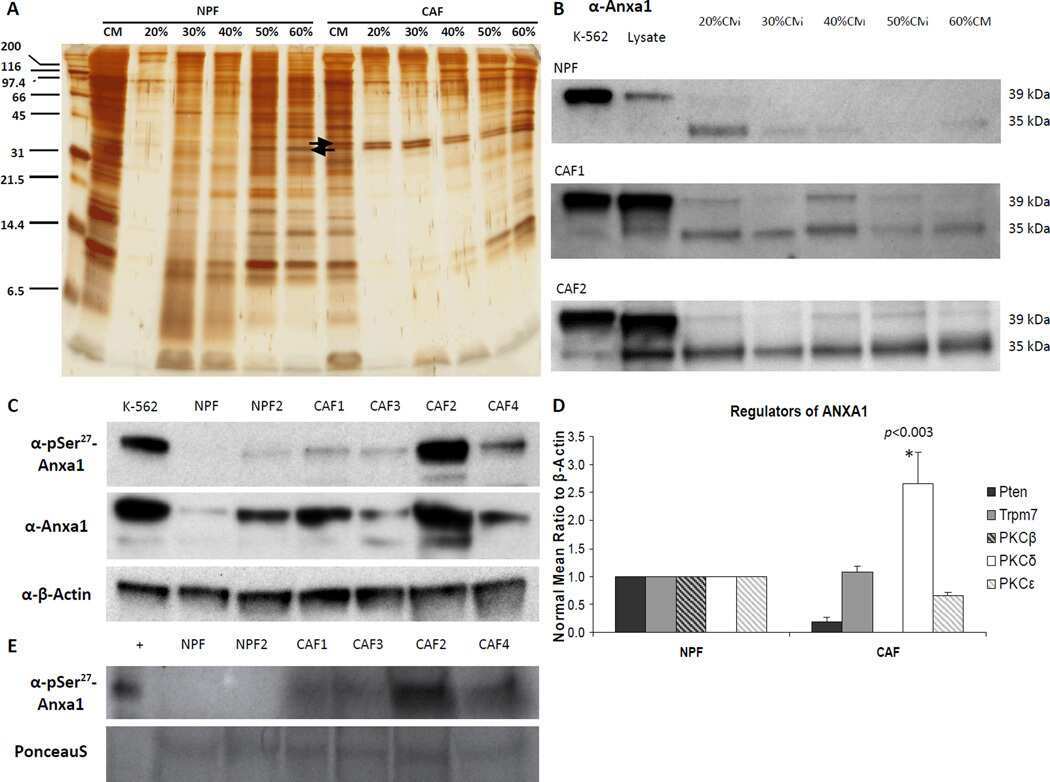
CAF-secreted annexin A1 induces prostate cancer cells to gain stem cell-like features.
MicroRNA expression profile in head and neck cancer: HOX-cluster embedded microRNA-196a and microRNA-10b dysregulation implicated in cell proliferation.
PAX2 Expression in Ovarian Cancer.
Anti-inflammatory mechanisms of the annexin A1 protein and its mimetic peptide Ac2-26 in models of ocular inflammation in vivo and in vitro.
Regulation of cytosolic phospholipase A2 phosphorylation by proteolytic cleavage of annexin A1 in activated mast cells.
Cromoglycate drugs suppress eicosanoid generation in U937 cells by promoting the release of Anx-A1.
Mycobacterium tuberculosis evades macrophage defenses by inhibiting plasma membrane repair.
Cross-species comparison of human and mouse intestinal polyps reveals conserved mechanisms in adenomatous polyposis coli (APC)-driven tumorigenesis.
Impaired phagocytic mechanism in annexin 1 null macrophages.
Fungbun N, Sasaki H, Terashima R, Murata T, Chiba S, Kurusu S, Kawaminami M
The Journal of veterinary medical science 2022 Sep 12;84(9):1288-1291
The Journal of veterinary medical science 2022 Sep 12;84(9):1288-1291
Interleukin-6 Signaling in Triple Negative Breast Cancer Cells Elicits the Annexin A1/Formyl Peptide Receptor 1 Axis and Affects the Tumor Microenvironment.
Vecchi L, Mota STS, Zóia MAP, Martins IC, de Souza JB, Santos TG, Beserra AO, de Andrade VP, Goulart LR, Araújo TG
Cells 2022 May 20;11(10)
Cells 2022 May 20;11(10)
New insight into the role of ANXA1 in melanoma progression: involvement of stromal expression in dissemination.
Delorme S, Privat M, Sonnier N, Rouanet J, Witkowski T, Kossai M, Mishellany F, Radosevic-Robin N, Juban G, Molnar I, Quintana M, Degoul F
American journal of cancer research 2021;11(4):1600-1615
American journal of cancer research 2021;11(4):1600-1615
Treatment with galectin-1 improves myogenic potential and membrane repair in dysferlin-deficient models.
Vallecillo-Zúniga ML, Rathgeber MF, Poulson PD, Hayes S, Luddington JS, Gill HN, Teynor M, Kartchner BC, Valdoz J, Stowell C, Markham AR, Arthur C, Stowell S, Van Ry PM
PloS one 2020;15(9):e0238441
PloS one 2020;15(9):e0238441
Chronic Hyperglycemia Drives Functional Impairment of Lymphocytes in Diabetic INS(C94Y) Transgenic Pigs.
Giese IM, Schilloks MC, Degroote RL, Weigand M, Renner S, Wolf E, Hauck SM, Deeg CA
Frontiers in immunology 2020;11:607473
Frontiers in immunology 2020;11:607473
Annexin A1/Formyl Peptide Receptor Pathway Controls Uterine Receptivity to the Blastocyst.
Hebeda CB, Sandri S, Benis CM, Paula-Silva M, Loiola RA, Reutelingsperger C, Perretti M, Farsky SHP
Cells 2020 May 11;9(5)
Cells 2020 May 11;9(5)
Annexin A1 drives macrophage skewing to accelerate muscle regeneration through AMPK activation.
McArthur S, Juban G, Gobbetti T, Desgeorges T, Theret M, Gondin J, Toller-Kawahisa JE, Reutelingsperger CP, Chazaud B, Perretti M, Mounier R
The Journal of clinical investigation 2020 Mar 2;130(3):1156-1167
The Journal of clinical investigation 2020 Mar 2;130(3):1156-1167
Annexin A1 attenuates neuroinflammation through FPR2/p38/COX-2 pathway after intracerebral hemorrhage in male mice.
Ding Y, Flores J, Klebe D, Li P, McBride DW, Tang J, Zhang JH
Journal of neuroscience research 2020 Jan;98(1):168-178
Journal of neuroscience research 2020 Jan;98(1):168-178
Clinical Significance of ARID1A and ANXA1 in HER-2 Positive Breast Cancer.
Silva-Oliveira R, Pereira FF, Petronilho S, Martins AT, Lameirinhas A, Constâncio V, Caldas-Ribeiro I, Salta S, Lopes P, Antunes L, Castro F, de Sousa SP, Henrique R, Jerónimo C
Journal of clinical medicine 2020 Dec 2;9(12)
Journal of clinical medicine 2020 Dec 2;9(12)
Reduced Annexin A1 Expression Associates with Disease Severity and Inflammation in Multiple Sclerosis Patients.
Colamatteo A, Maggioli E, Azevedo Loiola R, Hamid Sheikh M, Calì G, Bruzzese D, Maniscalco GT, Centonze D, Buttari F, Lanzillo R, Perna F, Zuccarelli B, Mottola M, Cassano S, Galgani M, Solito E, De Rosa V
Journal of immunology (Baltimore, Md. : 1950) 2019 Oct 1;203(7):1753-1765
Journal of immunology (Baltimore, Md. : 1950) 2019 Oct 1;203(7):1753-1765
Consequences of early postnatal lipopolysaccharide exposure on developing lungs in mice.
Shrestha AK, Bettini ML, Menon RT, Gopal VYN, Huang S, Edwards DP, Pammi M, Barrios R, Shivanna B
American journal of physiology. Lung cellular and molecular physiology 2019 Jan 1;316(1):L229-L244
American journal of physiology. Lung cellular and molecular physiology 2019 Jan 1;316(1):L229-L244
Fusobacterium nucleatum promotes colorectal cancer by inducing Wnt/β-catenin modulator Annexin A1.
Rubinstein MR, Baik JE, Lagana SM, Han RP, Raab WJ, Sahoo D, Dalerba P, Wang TC, Han YW
EMBO reports 2019 Apr;20(4)
EMBO reports 2019 Apr;20(4)
Differentially expressed proteins in positive versus negative HNSCC lymph nodes.
Vidotto A, Polachini GM, de Paula-Silva M, Oliani SM, Henrique T, López RVM, Cury PM, Nunes FD, Góis-Filho JF, de Carvalho MB, Leopoldino AM, Tajara EH
BMC medical genomics 2018 Aug 29;11(1):73
BMC medical genomics 2018 Aug 29;11(1):73
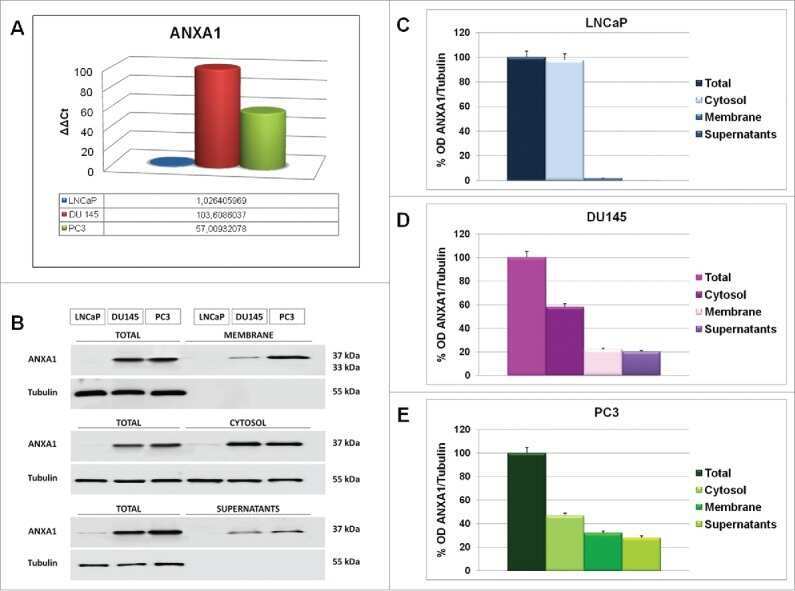
Hypoxia regulates ANXA1 expression to support prostate cancer cell invasion and aggressiveness.
Bizzarro V, Belvedere R, Migliaro V, Romano E, Parente L, Petrella A
Cell adhesion & migration 2017 May 4;11(3):247-260
Cell adhesion & migration 2017 May 4;11(3):247-260
Context Specificity in Causal Signaling Networks Revealed by Phosphoprotein Profiling.
Hill SM, Nesser NK, Johnson-Camacho K, Jeffress M, Johnson A, Boniface C, Spencer SE, Lu Y, Heiser LM, Lawrence Y, Pande NT, Korkola JE, Gray JW, Mills GB, Mukherjee S, Spellman PT
Cell systems 2017 Jan 25;4(1):73-83.e10
Cell systems 2017 Jan 25;4(1):73-83.e10
Protective Aptitude of Annexin A1 in Arterial Neointima Formation in Atherosclerosis-Prone Mice-Brief Report.
de Jong RJ, Paulin N, Lemnitzer P, Viola JR, Winter C, Ferraro B, Grommes J, Weber C, Reutelingsperger C, Drechsler M, Soehnlein O
Arteriosclerosis, thrombosis, and vascular biology 2017 Feb;37(2):312-315
Arteriosclerosis, thrombosis, and vascular biology 2017 Feb;37(2):312-315
Loss of ARID1A Activates ANXA1, which Serves as a Predictive Biomarker for Trastuzumab Resistance.
Berns K, Sonnenblick A, Gennissen A, Brohée S, Hijmans EM, Evers B, Fumagalli D, Desmedt C, Loibl S, Denkert C, Neven P, Guo W, Zhang F, Knijnenburg TA, Bosse T, van der Heijden MS, Hindriksen S, Nijkamp W, Wessels LF, Joensuu H, Mills GB, Beijersbergen RL, Sotiriou C, Bernards R
Clinical cancer research : an official journal of the American Association for Cancer Research 2016 Nov 1;22(21):5238-5248
Clinical cancer research : an official journal of the American Association for Cancer Research 2016 Nov 1;22(21):5238-5248
Macrophage activation and polarization modify P2X7 receptor secretome influencing the inflammatory process.
de Torre-Minguela C, Barberà-Cremades M, Gómez AI, Martín-Sánchez F, Pelegrín P
Scientific reports 2016 Mar 3;6:22586
Scientific reports 2016 Mar 3;6:22586
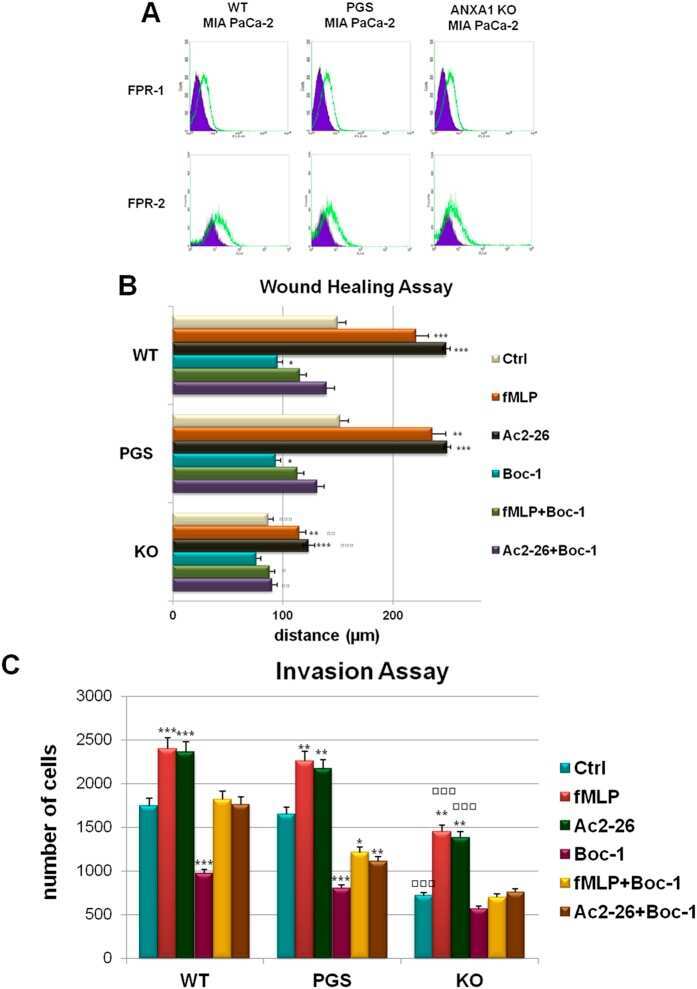
Annexin A1 contributes to pancreatic cancer cell phenotype, behaviour and metastatic potential independently of Formyl Peptide Receptor pathway.
Belvedere R, Bizzarro V, Forte G, Dal Piaz F, Parente L, Petrella A
Scientific reports 2016 Jul 14;6:29660
Scientific reports 2016 Jul 14;6:29660
Proteomic screening identifies calreticulin as a miR-27a direct target repressing MHC class I cell surface exposure in colorectal cancer.
Colangelo T, Polcaro G, Ziccardi P, Pucci B, Muccillo L, Galgani M, Fucci A, Milone MR, Budillon A, Santopaolo M, Votino C, Pancione M, Piepoli A, Mazzoccoli G, Binaschi M, Bigioni M, Maggi CA, Fassan M, Laudanna C, Matarese G, Sabatino L, Colantuoni V
Cell death & disease 2016 Feb 25;7(2):e2120
Cell death & disease 2016 Feb 25;7(2):e2120
Eicosapentaenoic acid membrane incorporation impairs ABCA1-dependent cholesterol efflux via a protein kinase A signaling pathway in primary human macrophages.
Fournier N, Tardivel S, Benoist JF, Vedie B, Rousseau-Ralliard D, Nowak M, Allaoui F, Paul JL
Biochimica et biophysica acta 2016 Apr;1861(4):331-41
Biochimica et biophysica acta 2016 Apr;1861(4):331-41
Annexin A1-containing extracellular vesicles and polymeric nanoparticles promote epithelial wound repair.
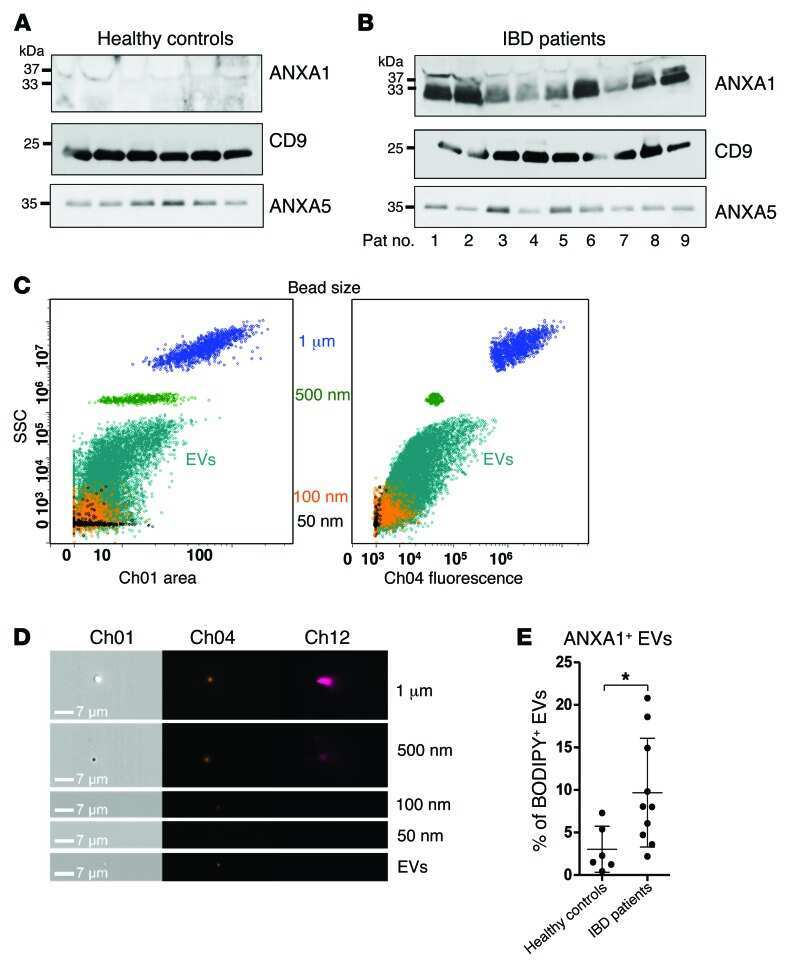
Leoni G, Neumann PA, Kamaly N, Quiros M, Nishio H, Jones HR, Sumagin R, Hilgarth RS, Alam A, Fredman G, Argyris I, Rijcken E, Kusters D, Reutelingsperger C, Perretti M, Parkos CA, Farokhzad OC, Neish AS, Nusrat A
The Journal of clinical investigation 2015 Mar 2;125(3):1215-27
The Journal of clinical investigation 2015 Mar 2;125(3):1215-27
Systemic gene dysregulation in classical Galactosaemia: Is there a central mechanism?
Coss KP, Treacy EP, Cotter EJ, Knerr I, Murray DW, Shin YS, Doran PP
Molecular genetics and metabolism 2014 Nov;113(3):177-87
Molecular genetics and metabolism 2014 Nov;113(3):177-87
CAF-secreted annexin A1 induces prostate cancer cells to gain stem cell-like features.
Geary LA, Nash KA, Adisetiyo H, Liang M, Liao CP, Jeong JH, Zandi E, Roy-Burman P
Molecular cancer research : MCR 2014 Apr;12(4):607-21
Molecular cancer research : MCR 2014 Apr;12(4):607-21
MicroRNA expression profile in head and neck cancer: HOX-cluster embedded microRNA-196a and microRNA-10b dysregulation implicated in cell proliferation.
Severino P, Brüggemann H, Andreghetto FM, Camps C, Klingbeil Mde F, de Pereira WO, Soares RM, Moyses R, Wünsch-Filho V, Mathor MB, Nunes FD, Ragoussis J, Tajara EH
BMC cancer 2013 Nov 9;13:533
BMC cancer 2013 Nov 9;13:533
PAX2 Expression in Ovarian Cancer.
Song H, Kwan SY, Izaguirre DI, Zu Z, Tsang YT, Tung CS, King ER, Mok SC, Gershenson DM, Wong KK
International journal of molecular sciences 2013 Mar 15;14(3):6090-105
International journal of molecular sciences 2013 Mar 15;14(3):6090-105
Anti-inflammatory mechanisms of the annexin A1 protein and its mimetic peptide Ac2-26 in models of ocular inflammation in vivo and in vitro.
Girol AP, Mimura KK, Drewes CC, Bolonheis SM, Solito E, Farsky SH, Gil CD, Oliani SM
Journal of immunology (Baltimore, Md. : 1950) 2013 Jun 1;190(11):5689-701
Journal of immunology (Baltimore, Md. : 1950) 2013 Jun 1;190(11):5689-701
Regulation of cytosolic phospholipase A2 phosphorylation by proteolytic cleavage of annexin A1 in activated mast cells.
Kwon JH, Lee JH, Kim KS, Chung YW, Kim IY
Journal of immunology (Baltimore, Md. : 1950) 2012 Jun 1;188(11):5665-73
Journal of immunology (Baltimore, Md. : 1950) 2012 Jun 1;188(11):5665-73
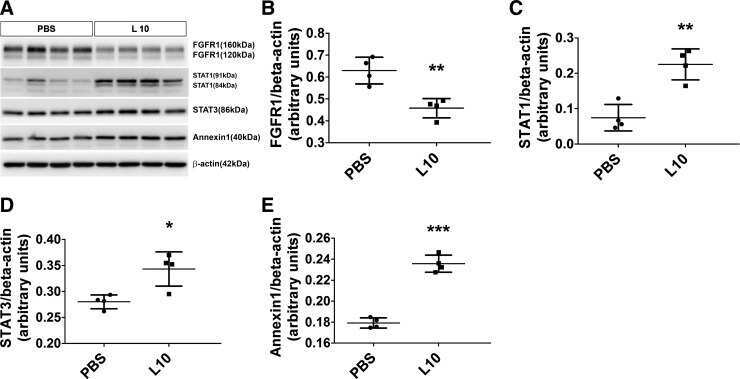
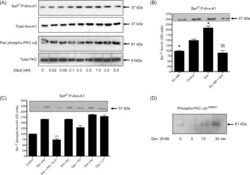
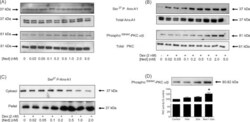
Cromoglycate drugs suppress eicosanoid generation in U937 cells by promoting the release of Anx-A1.
Yazid S, Solito E, Christian H, McArthur S, Goulding N, Flower R
Biochemical pharmacology 2009 Jun 15;77(12):1814-26
Biochemical pharmacology 2009 Jun 15;77(12):1814-26
Mycobacterium tuberculosis evades macrophage defenses by inhibiting plasma membrane repair.
Divangahi M, Chen M, Gan H, Desjardins D, Hickman TT, Lee DM, Fortune S, Behar SM, Remold HG
Nature immunology 2009 Aug;10(8):899-906
Nature immunology 2009 Aug;10(8):899-906
Cross-species comparison of human and mouse intestinal polyps reveals conserved mechanisms in adenomatous polyposis coli (APC)-driven tumorigenesis.
Gaspar C, Cardoso J, Franken P, Molenaar L, Morreau H, Möslein G, Sampson J, Boer JM, de Menezes RX, Fodde R
The American journal of pathology 2008 May;172(5):1363-80
The American journal of pathology 2008 May;172(5):1363-80
Impaired phagocytic mechanism in annexin 1 null macrophages.
Yona S, Heinsbroek SE, Peiser L, Gordon S, Perretti M, Flower RJ
British journal of pharmacology 2006 Jun;148(4):469-77
British journal of pharmacology 2006 Jun;148(4):469-77
No comments: Submit comment
Supportive validation
- Submitted by
- Invitrogen Antibodies (provider)
- Main image
- Experimental details
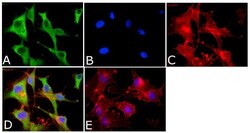
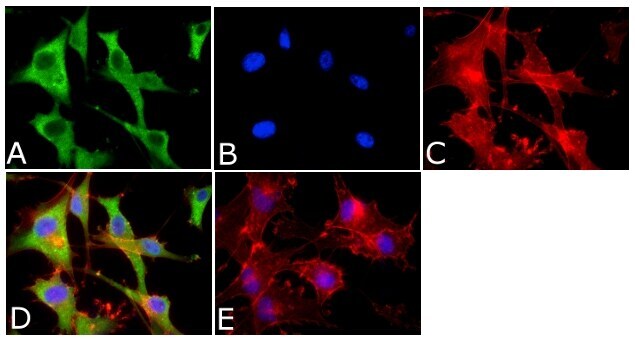
- Immunofluorescent analysis of Annexin-1 Antibody was done on 70% confluent log phase U87-MG cells. The cells were fixed with 4% paraformaldehyde for 15 minutes, permeabilized with 0.25% Triton™ X-100 for 10 minutes, and blocked with 5% BSA for 1 hour at room temperature. The cells were labeled with Annexin-1 Antibody (Product # 71-3400) at 1:1000 dilution in 1% BSA and incubated for 3 hours at room temperature and then labeled with Alexa Fluor 488 Goat Anti-Rabbit IgG Secondary Antibody (Product # A-11008) at a dilution of 1:400 for 45 minutes at room temperature (Panel a: green). Nuclei (Panel b: blue) were stained with SlowFade® Gold Antifade Mountant with DAPI (Product # S36938). F-actin (Panel c: red) was stained with Alexa Fluor 594 Phalloidin (Product # A12381). Panel d is a merged image showing cytoplasmic localization. Panel e is a no primary antibody control. The images were captured at 40X magnification.

- Submitted by
- Invitrogen Antibodies (provider)
- Main image

- Experimental details
- Immunofluorescent analysis of Annexin-1 Antibody was done on 70% confluent log phase U87-MG cells. The cells were fixed with 4% paraformaldehyde for 15 minutes, permeabilized with 0.25% Triton™ X-100 for 10 minutes, and blocked with 5% BSA for 1 hour at room temperature. The cells were labeled with Annexin-1 Antibody (Product # 71-3400) at 1:1000 dilution in 1% BSA and incubated for 3 hours at room temperature and then labeled with Alexa Fluor 488 Goat Anti-Rabbit IgG Secondary Antibody (Product # A-11008) at a dilution of 1:400 for 45 minutes at room temperature (Panel a: green). Nuclei (Panel b: blue) were stained with SlowFade® Gold Antifade Mountant with DAPI (Product # S36938). F-actin (Panel c: red) was stained with Alexa Fluor 594 Phalloidin (Product # A12381). Panel d is a merged image showing cytoplasmic localization. Panel e is a no primary antibody control. The images were captured at 40X magnification.
Supportive validation
- Submitted by
- Invitrogen Antibodies (provider)
- Main image
- Experimental details
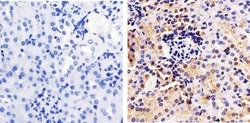
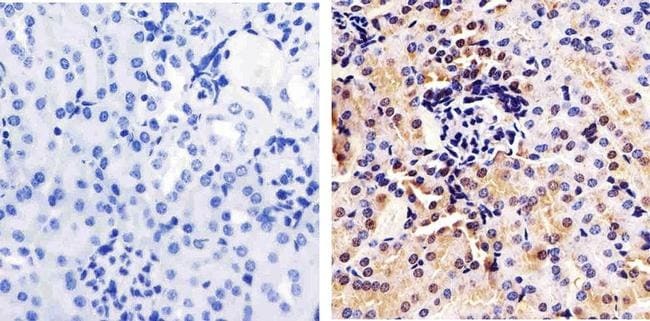
- Immunohistochemistry analysis of Annexin I showing staining in the cytoplasm and nucleus of paraffin-embedded mouse kidney tissue (right) compared to a negative control without primary antibody (left). To expose target proteins, antigen retrieval was performed using 10mM sodium citrate (pH 6.0), microwaved for 8-15 min. Following antigen retrieval, tissues were blocked in 3% H2O2-methanol for 15 min at room temperature, washed with ddH2O and PBS, and then probed with a Annexin I polyclonal antibody (Product # 71-3400) diluted in 3% BSA-PBS at a dilution of 1:100 overnight at 4ºC in a humidified chamber. Tissues were washed extensively in PBST and detection was performed using an HRP-conjugated secondary antibody followed by colorimetric detection using a DAB kit. Tissues were counterstained with hematoxylin and dehydrated with ethanol and xylene to prep for mounting.
- Submitted by
- Invitrogen Antibodies (provider)
- Main image
- Experimental details
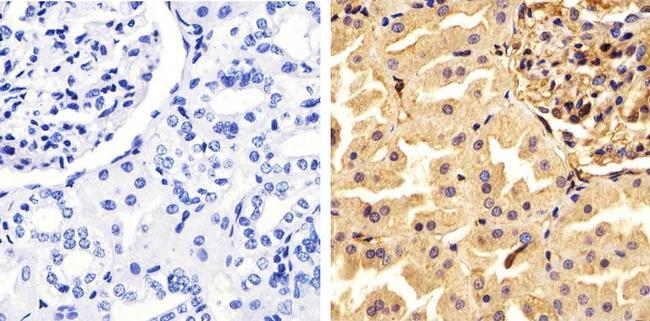
- Immunohistochemistry analysis of Annexin I showing staining in the cytoplasm and nucleus of paraffin-embedded human kidney tissue (right) compared to a negative control without primary antibody (left). To expose target proteins, antigen retrieval was performed using 10mM sodium citrate (pH 6.0), microwaved for 8-15 min. Following antigen retrieval, tissues were blocked in 3% H2O2-methanol for 15 min at room temperature, washed with ddH2O and PBS, and then probed with a Annexin I polyclonal antibody (Product # 71-3400) diluted in 3% BSA-PBS at a dilution of 1:100 overnight at 4ºC in a humidified chamber. Tissues were washed extensively in PBST and detection was performed using an HRP-conjugated secondary antibody followed by colorimetric detection using a DAB kit. Tissues were counterstained with hematoxylin and dehydrated with ethanol and xylene to prep for mounting.
- Submitted by
- Invitrogen Antibodies (provider)
- Main image
- Experimental details
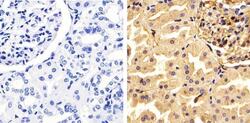
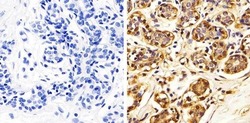
- Immunohistochemistry analysis of Annexin I showing staining in the cytoplasm and nucleus of paraffin-embedded human breast tissue (right) compared to a negative control without primary antibody (left). To expose target proteins, antigen retrieval was performed using 10mM sodium citrate (pH 6.0), microwaved for 8-15 min. Following antigen retrieval, tissues were blocked in 3% H2O2-methanol for 15 min at room temperature, washed with ddH2O and PBS, and then probed with a Annexin I polyclonal antibody (Product # 71-3400) diluted in 3% BSA-PBS at a dilution of 1:100 overnight at 4ºC in a humidified chamber. Tissues were washed extensively in PBST and detection was performed using an HRP-conjugated secondary antibody followed by colorimetric detection using a DAB kit. Tissues were counterstained with hematoxylin and dehydrated with ethanol and xylene to prep for mounting.

Supportive validation
- Submitted by
- Invitrogen Antibodies (provider)
- Main image
- Experimental details
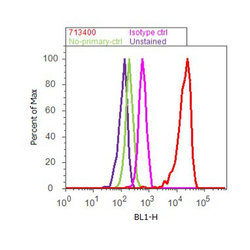
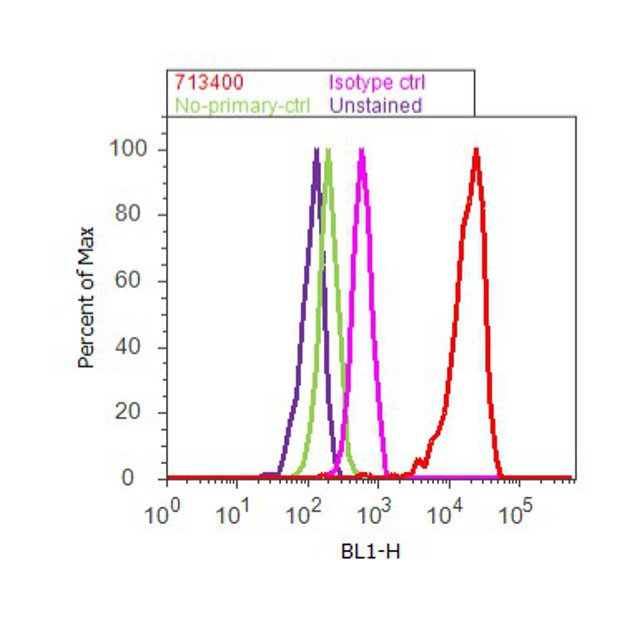
- Flow cytometry analysis of Annexin I was done on HeLa cells. Cells were fixed with 70% ethanol for 10 minutes, permeabilized with 0.25% Triton™ X-100 for 20 minutes, and blocked with 5% BSA for 30 minutes at room temperature. Cells were labeled with Annexin I Rabbit Polyclonal Antibody (713400, red histogram) or with rabbit isotype control (pink histogram) at 3-5 ug/million cells in 2.5% BSA. After incubation at room temperature for 2 hours, the cells were labeled with Alexa Fluor® 488 Goat Anti-Rabbit Secondary Antibody (A11008) at a dilution of 1:400 for 30 minutes at room temperature. The representative 10,000 cells were acquired and analyzed for each sample using an Attune® Acoustic Focusing Cytometer. The purple histogram represents unstained control cells and the green histogram represents no-primary-antibody control.
Supportive validation
- Submitted by
- Invitrogen Antibodies (provider)
- Main image
- Experimental details
- NULL
- Submitted by
- Invitrogen Antibodies (provider)
- Main image
- Experimental details
- NULL

- Submitted by
- Invitrogen Antibodies (provider)
- Main image
- Experimental details
- NULL
- Submitted by
- Invitrogen Antibodies (provider)
- Main image
- Experimental details
- NULL
- Submitted by
- Invitrogen Antibodies (provider)
- Main image
- Experimental details
- NULL

- Submitted by
- Invitrogen Antibodies (provider)
- Main image
- Experimental details
- NULL

- Submitted by
- Invitrogen Antibodies (provider)
- Main image
- Experimental details
- NULL
- Submitted by
- Invitrogen Antibodies (provider)
- Main image
- Experimental details
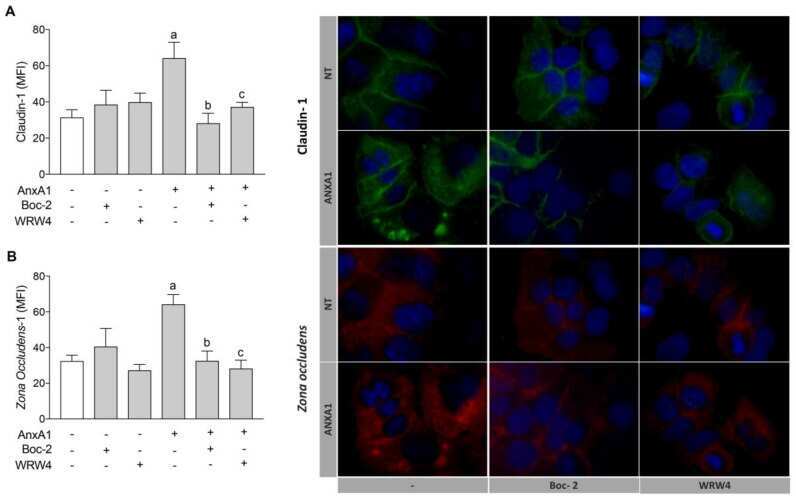
- Figure 3 AnxA1 controlled claudin-1 and ZO-1 expressions on uterine epithelial cells via FPR1 and FPR2. Claudin-1 ( A ) and ZO-1 ( B ) expressions on uterine epithelial cells were determined 24 h after incubations. Representative images of claudin-1 and ZO-1 immunofluorescence are shown. (-) means absence and (+) means presence of treatments. The data are expressed as mean +- standard error of mean of three to five independent experiments. a p < 0.05 vs. NT; b p < 0.01 and c p < 0.05 vs. AnxA1.
- Submitted by
- Invitrogen Antibodies (provider)
- Main image

- Experimental details
- NULL
- Submitted by
- Invitrogen Antibodies (provider)
- Main image
- Experimental details
- NULL
- Submitted by
- Invitrogen Antibodies (provider)
- Main image
- Experimental details
- NULL
- Submitted by
- Invitrogen Antibodies (provider)
- Main image
- Experimental details
- NULL
- Submitted by
- Invitrogen Antibodies (provider)
- Main image
- Experimental details
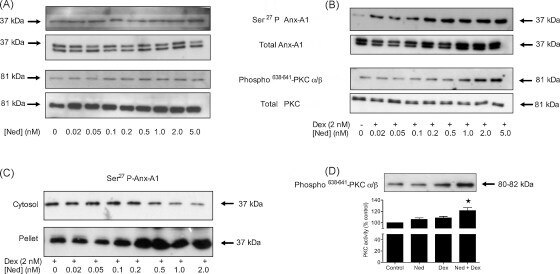
- Fig. 1 Dexamethasone increases the phosphorylation of Anx-A1 and PKC in U937 cells within 5 min in a concentration-dependent fashion. (Panel A) In U937 cells, 5 min treatment with dexamethasone in concentrations of 0.02-5.0 nM increases phosphorylation of Anx-A1 on Ser 27 (upper panel) by ~4-fold and, in parallel, PKCalpha/beta phosphorylation (lower panel) by ~3-fold compared to untreated controls. Whole U937 cell lysates were prepared as detailed. Anx-A1 phosphorylation was detected using a specific anti-Ser 27 phospho Anx-A1 antibody as described. Total Anx-A1 (sometimes shown as a 33/37 kDa doublet) and PKC is shown for reference purposes. (Panel B) The dexamethasone (2 nM) effect on Anx-A1 phosphorylation is dependent on GC receptor occupation since the co-administration of 1 muM RU 486, blocks this effect. Note that the amount of phospho Anx-A1 is significantly less in samples treated with RU 486 alone than in vehicle treated samples, suggesting that some residual GCs may be present in the culture media. * P < 0.05 relative to control values; SSSS P < 0.01 relative to dexamethasone alone. (Panel C) The action of common kinase inhibitors on Anx-A1 phosphorylation. Of these, only PKC 19-31 (5 muM), an inhibitor of PKC, was able to reduce phosphorylation of Anx-A1 when this was stimulated by 2 nM dexamethasone (D). An inhibitor of PI3 kinase inhibitor LY294002 (LY: 10 nM) or a MAP kinase inhibitor PD98059 (PD: 5 muM) were inactive. Insert: a representative Western blot sho

- Submitted by
- Invitrogen Antibodies (provider)
- Main image
- Experimental details
- Fig. 2 Nedocromil potentiates the effect of dexamethasone on Anx-A1 and PKCalpha/beta phosphorylation and protein translocation to the plasma membrane fraction. (Panel A) Nedocromil itself, over a range of concentrations, has a negligible effect on the concentration of Ser 27 phospho Anx-A1 in U937 cell lysates or PKCalpha/beta phosphorylation when compared to untreated samples. Total Anx-A1 (sometimes shown as a 33/37 kDa doublet) and PKC is shown for reference purposes. (Panel B) In the presence of 2 nM dexamethasone, escalating concentrations (0.02-5.0 nM) of nedocromil potentiate (by a further 3-4-fold) the phosphorylation of both Anx-A1 and PKCalpha/beta. Total Anx-A1 (sometimes shown as a 33/37 kDa doublet) and PKC is shown for reference purposes. (Panel C) In the presence of a fixed concentration of dexamethasone (2 nM), nedocromil (0.02-2.0 nM) potentiates the translocation of Ser 27 phospho Anx-A1 from the cytosol into the 13,000 x g particulate fraction of U937 cells. (Panel D) The membrane accumulation of activated PKCalpha/beta is promoted (>2-fold) by the combination of nedocromil (0.5 nM) and dexamethasone (2 nM; see blot insert) and this is reflected in an increase in enzyme activity as measured in the 100,000 x g membrane fraction. * P < 0.05 relative to nedocromil of dexamethasone alone. All experiments were done at least three times and the blots are representatives from one of these experiments. Densitometry was performed as described in the methods and the
- Submitted by
- Invitrogen Antibodies (provider)
- Main image

- Experimental details
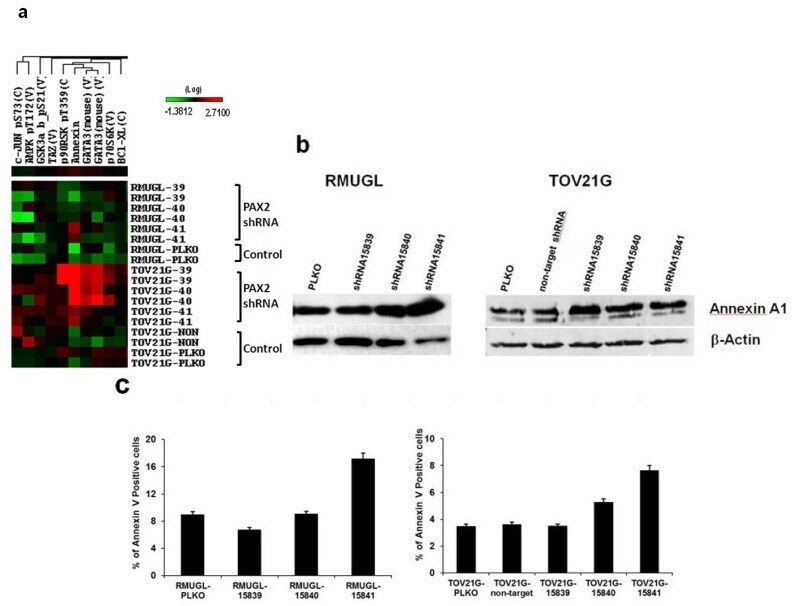
- Figure 4 Up-regulation of Annexin A1 and increase in apoptotic cells in PAX2 knockdown cell lines. ( a ) Reverse phase protein array (RPPA) analysis showed PAX2 knockdown ovarian cancer cell lines had a higher expression of Annexin A1 than control cells; ( b ) Western blot analysis was used to measure Annexin A1 expression in RMUGL and TOV21G ovarian cancer cell lines with or without PAX2 knockdown; ( c ) Flow cytometric analysis of percentage of apoptotic cells using APC-Annexin V staining.
- Submitted by
- Invitrogen Antibodies (provider)
- Main image
- Experimental details
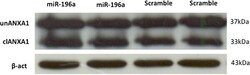
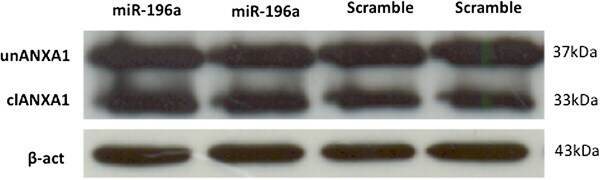
- Figure 6 Western blot analysis of ANXA1 expression in keratinocytes upon overexpression of miR-196a. Total protein extracts from cells overexpressing miR-196a (miR-196a) and negative controls (scramble) were analyzed by western blot for ANXA1. Results show no differences in protein levels between the experiments.
- Submitted by
- Invitrogen Antibodies (provider)
- Main image
- Experimental details
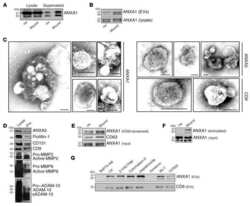
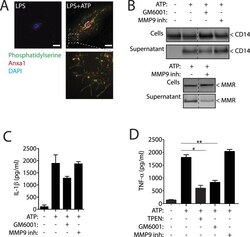
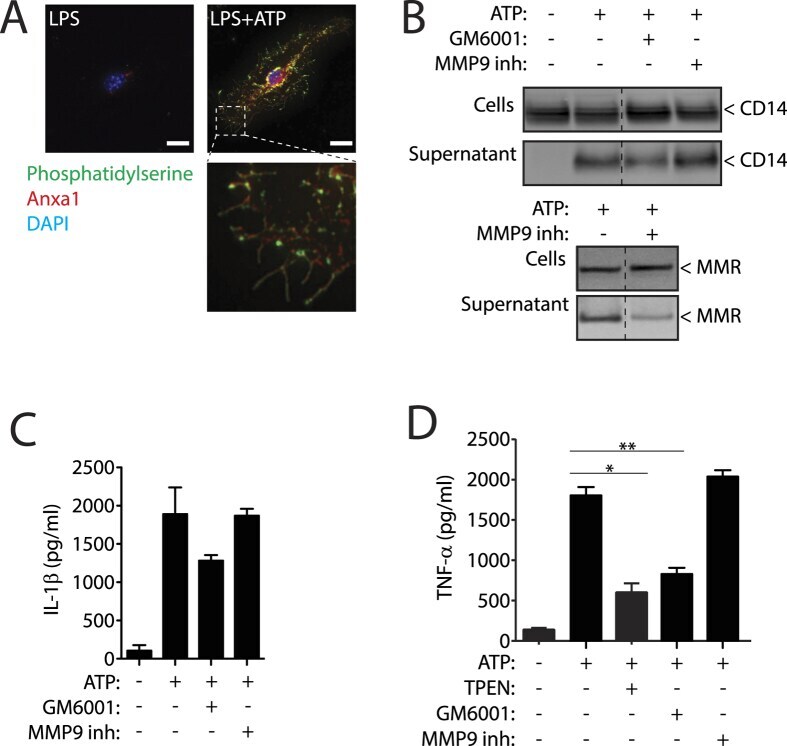
- Figure 4 P2X7R controls different mechanisms in Anxa1, CD14, MMR and TNF- alpha release. ( A ) Representative high intensity projection deconvolved image of a mouse bone marrow-derived macrophages (BMDMs) primed for 4 h with LPS (1 mug/ml), followed by stimulation or not for 5 min with ATP (3 mM) and stained for phosphatidylserine with annexin V-FITC (green), for anxa1 (red) and for nuclei (DAPI, blue) without cell permeabilization; scale bar = 10 muM. ( B ) Western blot for CD14 and MMR in cell-free supernatants and cell lysates from BMDM primed as in ( A ) but with 20 min of ATP (3 mM) stimulation; 10 min before and during ATP stimulation cells were incubated with the general metalloprotease inhibitor GM6001 (100 nM) or with the specific MMP9 inhibitor I (100 nM). Western blots are representative of n = 2 independent experiments and composite is from lanes of the same membrane. ( C,D ) ELISA analysis for released IL-1beta ( C ) or TNF-alpha ( D ) from BMDMs treated as in ( B ) and additionally 10 min before and during ATP stimulation cells were incubated with the Zn 2+ chelator TPEN (50 muM). Data is presented as mean and s.e.m. of n = 3 independent experiments.
- Submitted by
- Invitrogen Antibodies (provider)
- Main image

- Experimental details
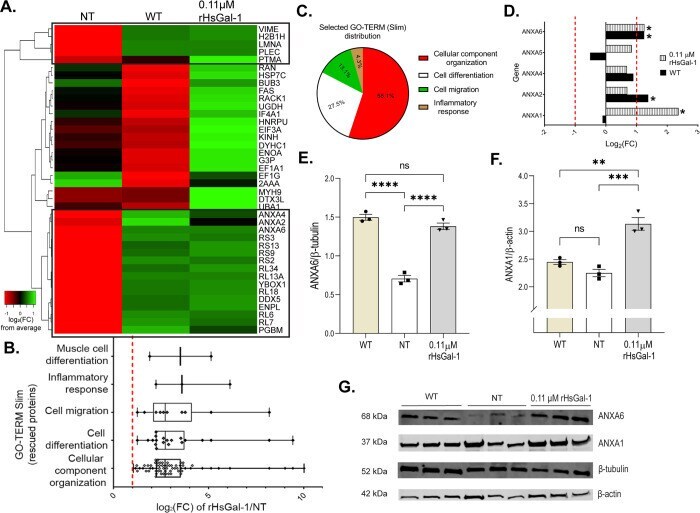
- Fig 6 Shotgun proteomic analyses (MS/MS) of AJ WT, AJ -/- NT and 0.11 muM rHsGal-1 treated myotubes. A. Heatmap of top 20 and bottom 20 expressed proteins for WT myotubes based on Log 2 fold change (FC) from the mean value all conditions. Box denotes cluster of proteins that had similar FC values between WT and rHsGal-1 treatment. B. GO-Term Slim analysis of rescued proteins. C. Relative amount of proteins found in the selected GO-Terms(B). D. Log 2 FC of Annexin family proteins (calculated based on WT and Gal-1 FC from NT). E. Quantification of ANXA6 after 48h differentiation in WT, NT, and 0.11 muM rHsGal-1 treated myotubes. F. Quantification of ANXA1 after 48h in WT, NT, and 0.11 muM rHsGal-1 treated myotubes. G. Western blot images of ANXA1 and ANXA6. p values were measured by 2-way ANOVA multiple comparison test and indicated by *p< 0.05, **p< 0.01, and ***p< 0.001. Error bars represent SEM. n = 3. All proteins were preselected based on protein ID significance values of >=20% (p
- Submitted by
- Invitrogen Antibodies (provider)
- Main image

- Experimental details
- Figure 3 AnxA1 controlled claudin-1 and ZO-1 expressions on uterine epithelial cells via FPR1 and FPR2. Claudin-1 ( A ) and ZO-1 ( B ) expressions on uterine epithelial cells were determined 24 h after incubations. Representative images of claudin-1 and ZO-1 immunofluorescence are shown. (-) means absence and (+) means presence of treatments. The data are expressed as mean +- standard error of mean of three to five independent experiments. a p < 0.05 vs. NT; b p < 0.01 and c p < 0.05 vs. AnxA1.

- Submitted by
- Invitrogen Antibodies (provider)
- Main image
- Experimental details
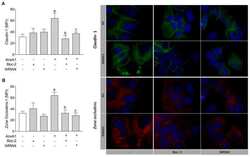
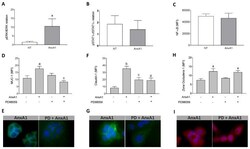
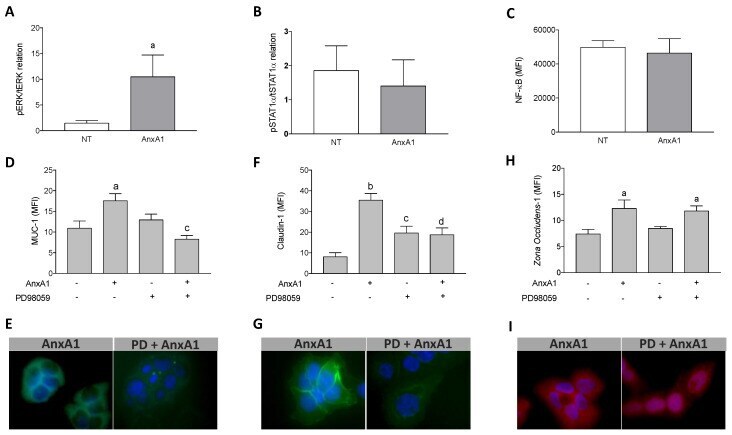
- Figure 4 AnxA1 controlled Muc-1 and Claudin-1 expressions on uterine epithelial cells via ERK1/2 phosphorylation. The effect of AnxA1 on ERK ( A ) and STAT1alpha ( B ) phosphorylation and NF-kappaB expression ( C ) were investigated by flow cytometry. The inhibition on ERK1/2, evoked by PD98059 incubation, was investigated on Muc-1 ( D ), Claudin-1 ( F ) and ZO-1 ( H ) expressions using immunofluorescence. Representative images of Muc-1, Claudin-1 and ZO-1 are shown in ( E ), ( G ) and ( I ), respectively. (-) means absence and (+) means presence of treatments. The data are expressed as mean +- standard error of mean of three to five independent experiments. a p < 0.05 and b p < 0.01 vs. NT; c p < 0.05 and d p < 0.01 vs. AnxA1.
- Submitted by
- Invitrogen Antibodies (provider)
- Main image
- Experimental details
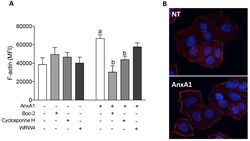
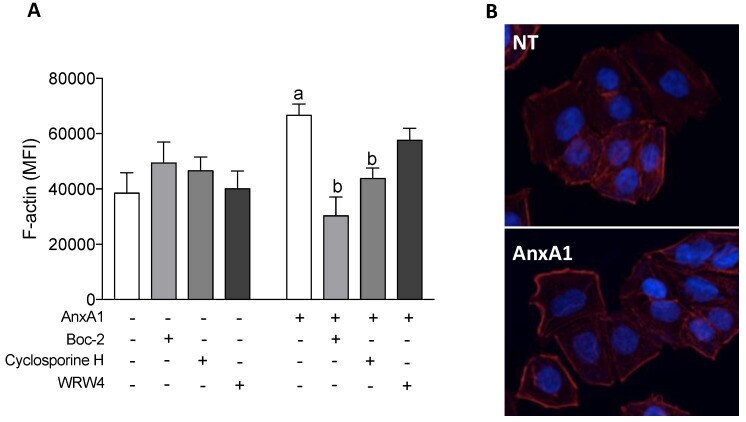
- Figure 5 AnxA1 induced F-actin polymerization via FPR1. F-actin was quantified on uterine epithelial cells 2 h after incubations, using phalloidin-rhodamine by confocal microscopy. (-) means absence and (+) means presence of treatments ( A ). Representative images of F-actin polymerization are shown ( B ). The data are expressed as mean +- standard error of mean of three to five independent experiments. a p < 0.05 vs. NT; b p < 0.05 vs. AnxA1.
- Submitted by
- Invitrogen Antibodies (provider)
- Main image
- Experimental details
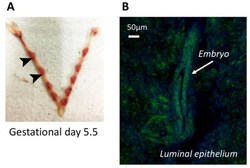
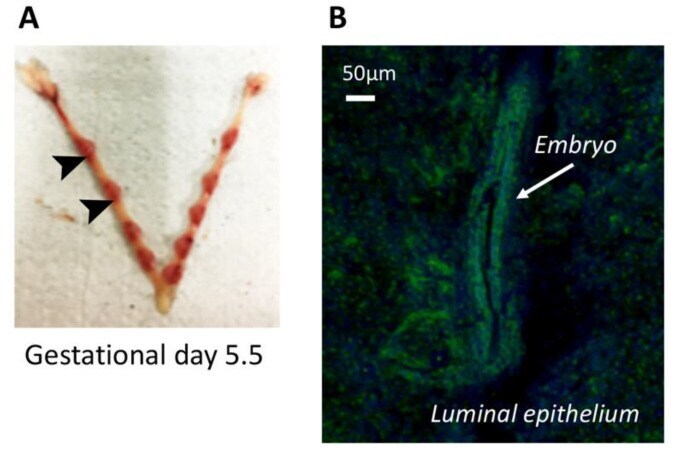
- Figure 7 AnxA1 is expressed at embryo-implantation site in vivo. Implantations sites were obtained from C57bl/6 at gestational day 5.5 ( A ). Representative image of AnxA1 expression at implantation site (arrow) and luminal tissue by confocal microscopy is shown ( B ).
- Submitted by
- Invitrogen Antibodies (provider)
- Main image
- Experimental details
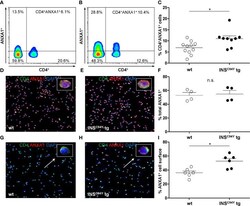
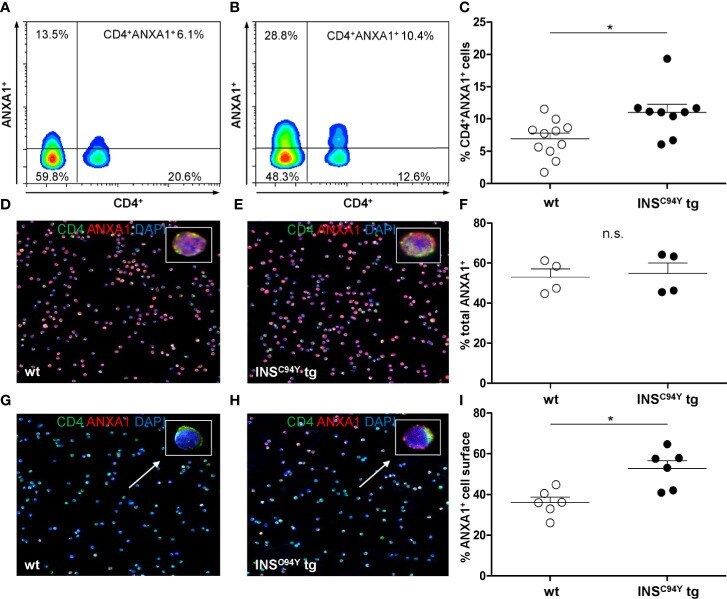
- Figure 5 Differential ANXA1 expression in porcine CD4 + T cells. (A-C) Representative flow cytometric images of ANXA1 + CD4 + T cells of a wild-type (A) and an INS C94Y tg pig (B) are shown with reduced ANXA1 expression in wild-type CD4 + T cells. (C) Scatter plots summarizing flow cytometry analyses of PBMC of eleven wild-type and nine INS C94Y tg pigs. ANXA1 was significantly elevated in CD4 + T cells of INS C94Y tg pigs (*p < 0.05). (D-F) Similar ANXA1 levels after permeabilization in purified CD4 + T cells of a wild-type (D) and an INS C94Y tg pig (E) shown by immunofluorescence staining for ANXA1 (red), CD4 (green) and nucleus (blue, counterstained with DAPI) and confirmed by flow cytometry using n=4 per group (F) . (G-I) Representative images of immunofluorescence staining for ANXA1 on the outer cell membrane of porcine CD4 + T cells demonstrate higher ANXA1 expression in CD4 + T cells of the INS C94Y tg pig (H) compared to the wild-type (G) (arrows). (I) A higher ANXA1 expression on the cell surface of diabetic CD4 + T cells compared to CD4 + T cells of wild-types was confirmed by flow cytometry (n=6 per group). Horizontal bars indicate group means.
- Submitted by
- Invitrogen Antibodies (provider)
- Main image
- Experimental details
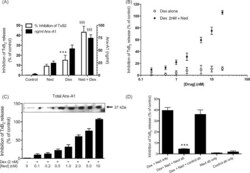
- Fig. 3 Nedocromil potentiates dexamethasone inhibition of TxB 2 release from U937 cells. (Panel A) Measurement of TxB 2 generation (left hand Y -axis) and Anx-A1 (right hand Y -axis) by ELISA assay in the medium of U937 cells after treatment with nedocromil (5 nM), dexamethasone (2 nM), or a combination of both. The varying inhibition of TxB 2 release corresponds with the amount of Anx-A1 externalised. *** P < 0.001 relative to control values; SSSSSS P < 0.001 relative to dexamethasone alone values. (Panel B) Dexamethasone itself (0.2-20.0 nM) inhibits TxB 2 release at 5 min (as assessed by ELISA assay) but does not produce a maximal effect. However, when nedocromil (0.05-20 nM) is added to a maximally effective (2 nM) concentration of dexamethasone, a concentration-dependent potentiation of the inhibitory effect occurs with near maximal inhibition achieved at 20 nM nedocromil. (Panel C) The inhibition of TxB 2 release (as assessed by ELISA assay) by escalating concentrations of nedocromil (0.2-10 nM) in the presence of a fixed concentration (2 nM) of dexamethasone is paralleled by increasing amounts of Anx-A1 externalised from U937 cells. Insert: representative Western blot in which the total Anx-A1 in the medium was assessed. (Panel D) Reversal of the TxB 2 inhibitory action of a combination of 2 nM dexamethasone with 0.5 nM nedocromil by a mouse anti-Anx-A1 neutralising monoclonal antibody (mab 1A) but not by an irrelevant isotype matched monoclonal antibody. *** P < 0.001

- Submitted by
- Invitrogen Antibodies (provider)
- Main image
- Experimental details
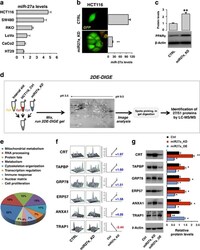
- Figure 2 Proteomic (2DE-DIGE) profiling identifies novel proteins and pathways modulated by miR-27a in CRC cell lines. ( a ) miR-27a expression was analysed by quantitative reverse transcriptase-PCR in the indicated CRC cell lines. The histogram reports the fold change with respect to HT29 cells taken as control. U6 RNA was used as calibrator. ( b ) HCT116 cells were stably transfected with the miR-Zip-27a vector, carrying the miR-27a antisense and the GFP reporter gene, or with the empty vector as control. Cells were isolated for GFP expression and for the miR-27a low-expressing clones (miR27a_KD); ** P

- Submitted by
- Invitrogen Antibodies (provider)
- Main image

- Experimental details
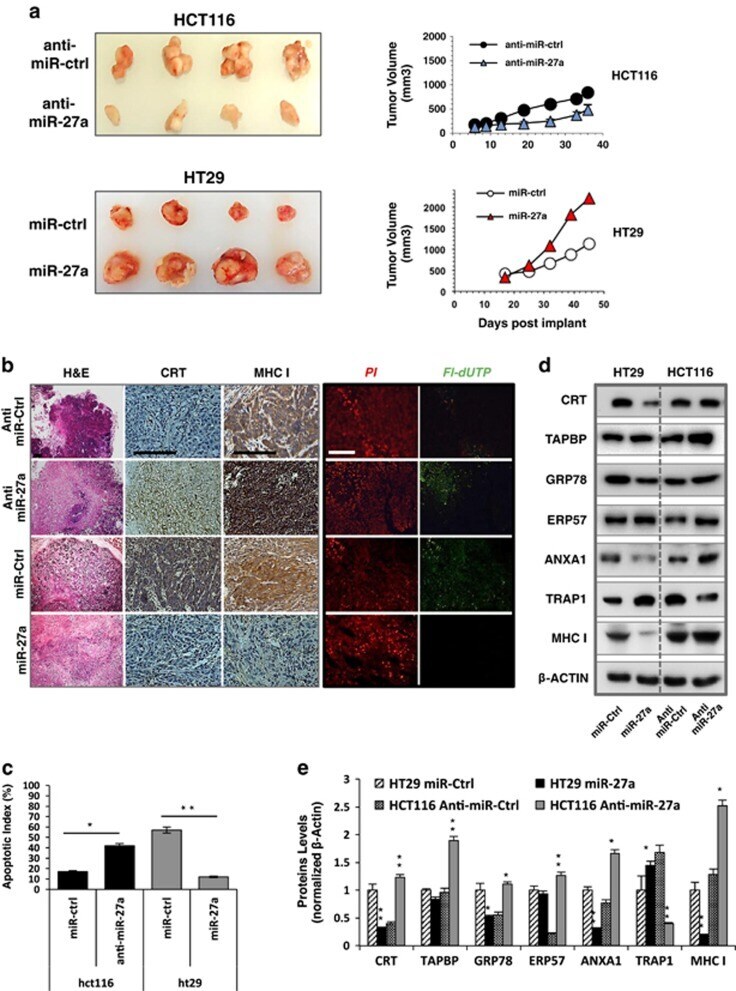
- Figure 5 miR-27a acts as an oncogenic miRNA in mouse xenografts. ( a ) Representative photographs of the xenograft tumour masses excised from each experimental group. miR-27a inhibitor (anti-miR-27a; n =5) and scrambled control (miR-Ctrl; n =5) in HCT116 cells or miR-27a mimic (miR-27a; n =5) and scrambled control (miR-Ctrl; n =5) in HT29 cells were intratumourally injected every 7 days for four cycles starting from the day in which tumours reached the volume of 200 mm 3 . The growth curve of the tumours is reported for both types of xenografts. ( b ) Representative photomicrographs of haematoxylin and eosin staining, calreticulin and MHC class I IHC analysis and TUNEL assay, respectively, performed on paraffin-embedded sections of the same tissues; scale bars, 200 mu m. ( c ) The histogram shows the apoptotic index as determined by TUNEL assay. ( d ) Western blotting analysis of the selected proteins gene identified by 2DE-DIGE performed on total protein extracts of mouse xenografts and ( e ) their relative quantification. Data are represented as means+-S.D. from at least two independently treated tumours; * P
- Submitted by
- Invitrogen Antibodies (provider)
- Main image

- Experimental details
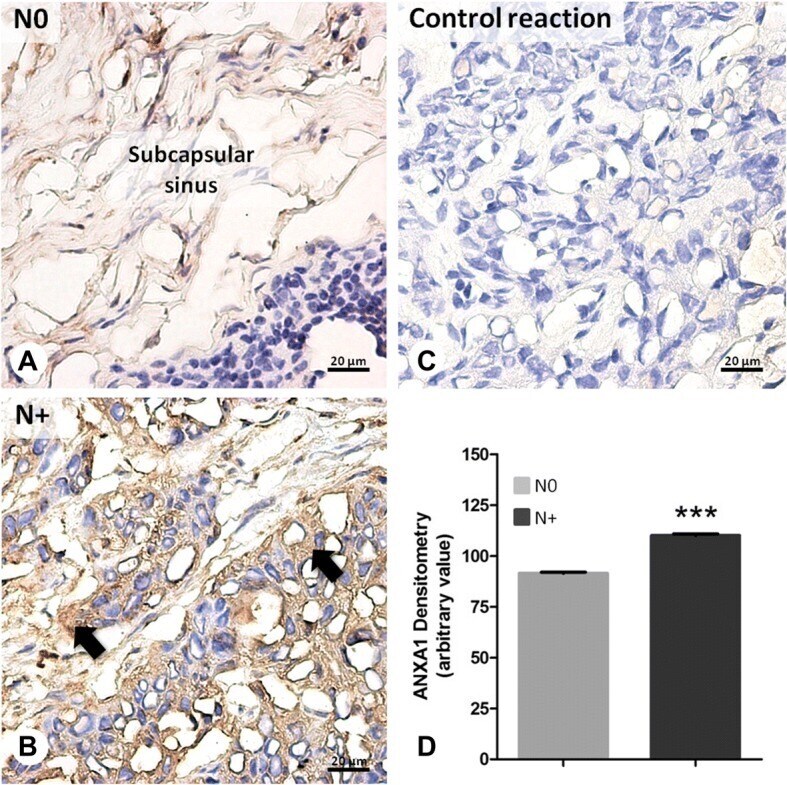
- Fig. 4 Immunohistochemical analysis of ANXA1 expression in lymph nodes from head and neck carcinomas. a Non-metastatic lymph node (N0) samples : constitutive expression of ANXA1 in the subcapsular sinus. b Metastatic lymph node (N+) samples : endogenous ANXA1 expression increased in the lymph node tissue and in the metastatic cells (arrows). c Negative control of reaction. Sections: 2 mum. Counterstain: Hematoxylin. d Densitometry of ANXA1. Values expressed as mean +- S.E.M. *** p < 0,001
- Submitted by
- Invitrogen Antibodies (provider)
- Main image
- Experimental details
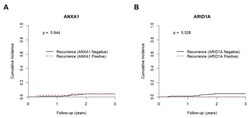
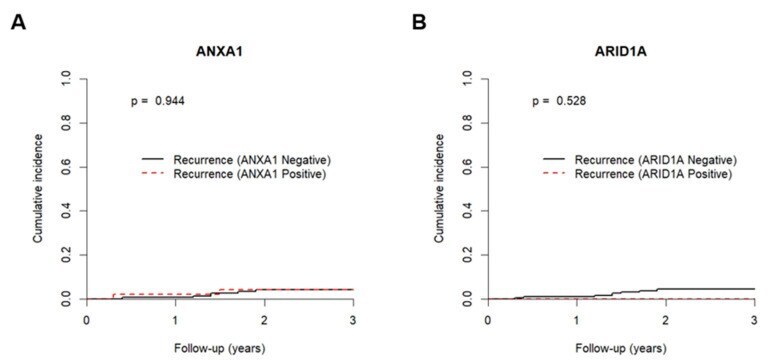
- Figure 1 Cumulative incidence function plots according to ( A ) ANXA1 and ( B ) ARID1A immunoexpression. Dashed red line and full black line represent positive/high expression and negative/low expression for ANXA1 and ARID1A immunoexpression, respectively. p values obtained by Gray's test for trastuzumab resistance relapse.
- Submitted by
- Invitrogen Antibodies (provider)
- Main image
- Experimental details
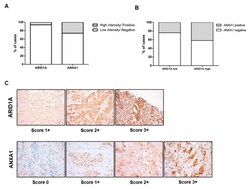
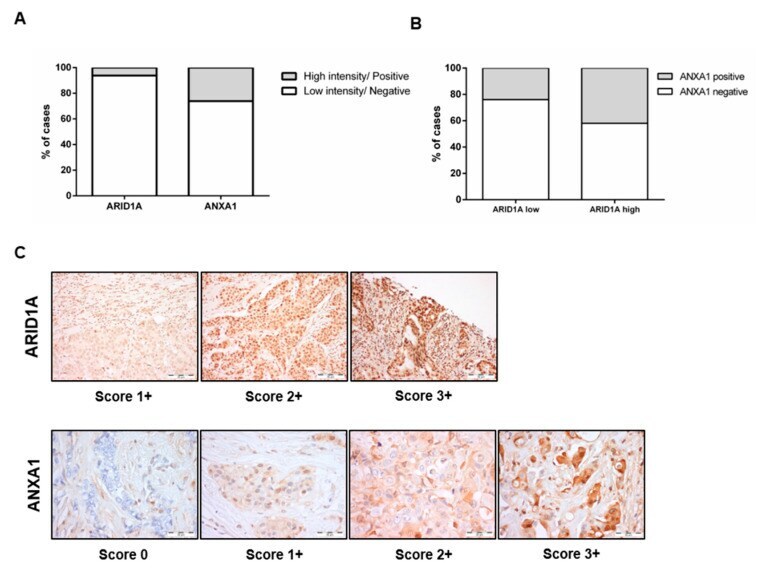
- Figure 2 Relationship between ARID1A and ANXA1. Proportion of tumours with ARID1A high or low intensity and ANXA1 negativity or positivity ( A ). Association between ARID1A and ANXA1 (Chi-square: p = 0.183) ( B ). Illustrative images of the different protein intensity scores ( C ).
- Submitted by
- Invitrogen Antibodies (provider)
- Main image

- Experimental details
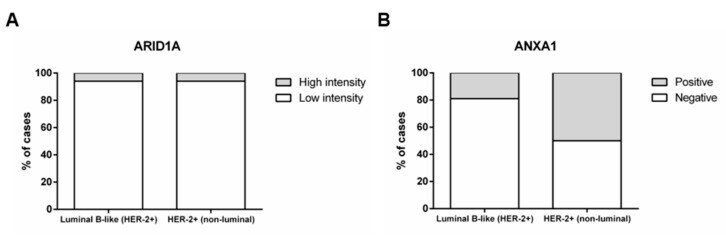
- Figure 3 Distribution of ARID1A and ANXA1 immunoexpression by molecular subtype. Percentage of cases with low and high ARID1A intensity staining score (1+ and 2+ vs. 3+) (Chi-square p = 0.749) ( A ). Percentage of cases with or without ANXA1 expression (Chi-square p < 0.001) ( B ).
- Submitted by
- Invitrogen Antibodies (provider)
- Main image
- Experimental details
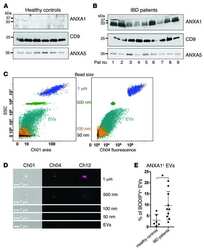
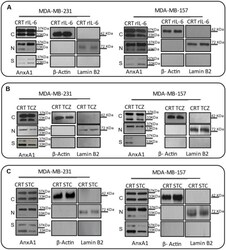
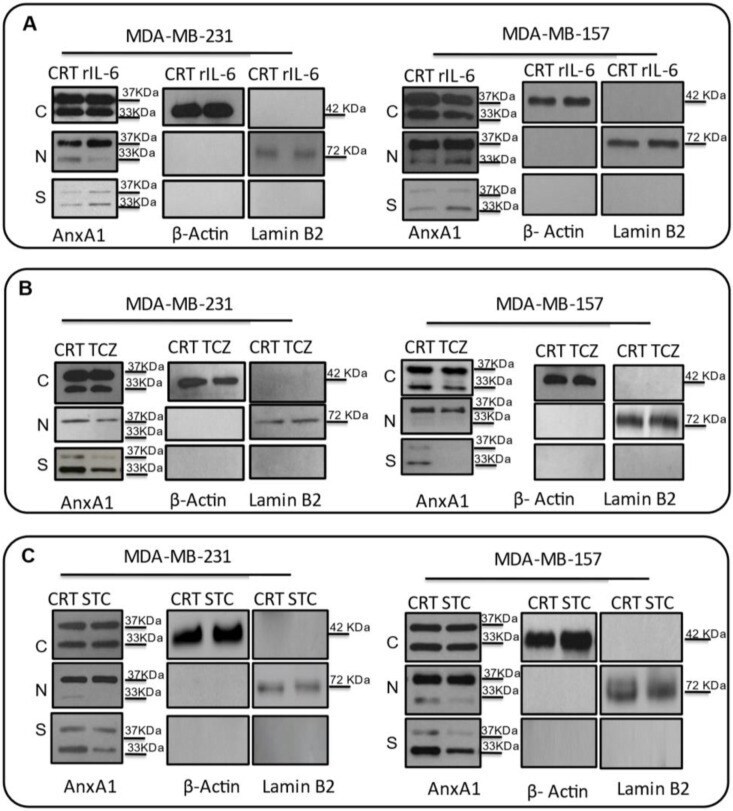
- Effects on the Annexin A1 (AnxA1) expression in MDA-MB-231 and MDA-MB-157 after the stimulation and inhibition of the IL-6 pathway. The cropped Western blotting of AnxA1 expression in the cytoplasm (C), nuclei (N), and supernatants (S) of MDA-MB-231 and MDA-MB-157 cells. ( A ) Cells were treated for 24 h with 1 muM of recombinant human IL-6 (rIL-6). ( B ) Cells were treated for 24 h with 1 muM of neutralizing antibody anti-human IL-6 (Tocilizumab; TCZ), and ( C ) cells were treated for 24 h with 1 muM of an inhibitor of the IL-6 signaling pathway molecule, STAT3 (STATTIC; STC). beta-Actin and Lamin B2 were used to check the proper cell fractionation and as loading controls of cytoplasmic and nuclear extracts, respectively. Three independent experiments were performed.
- Submitted by
- Invitrogen Antibodies (provider)
- Main image

- Experimental details
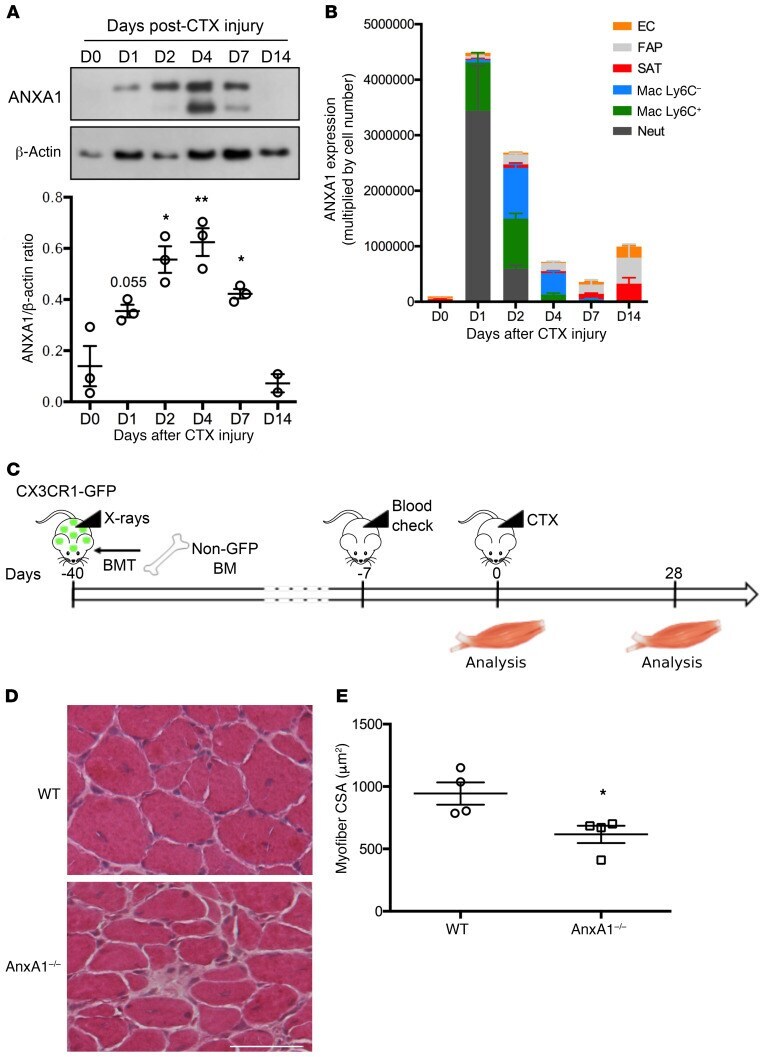
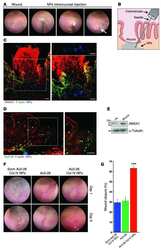
- Figure 2 Infiltrating myeloid cell-derived ANXA1 controls muscle repair. ( A ) Western blot analysis of ANXA1 protein in total TA muscle. Muscles were analyzed 0, 1, 2, 4, 7, and 14 days after injury. Shown are representative blots (top) and quantification of ANXA1 to beta-actin (bottom) and ratios. ( B ) Quantitative reverse transcriptase PCR analysis of AnxA1 mRNA level in various cell populations FACS-sorted from TA muscle. Muscles were analyzed 0, 1, 2, 4, 7, and 14 days after injury. EC, endothelial cells; FAP, fibro/adipogenic progenitors; SAT, satellite cells; Mac, macrophages; Neut, neutrophils. ( C ) Experimental setup of bone marrow transplantation (BMT). CX3CR1-GFP mice were irradiated and then transplanted with bone marrow cells isolated from WT or AnxA1 -/- mice. Bone marrow engraftment was checked on a blood sample after around 5 weeks. Then animals were injured in their TA by CTX injection and muscles analyzed 0 or 28 days later. Engraftment was confirmed on the bone marrow of each animal on the day of sacrifice. H&E staining ( D ) and myofiber cross-sectional area ( E ) of TA muscles 28 days after CTX injury. Scale bar: 50 mum. Results are mean +- SEM of at least 2 (D14 in A ) or 3 muscles. * P < 0.05, ** P < 0.01 vs. WT or D0.